Gravimetrically prepared carbon dioxide standards in support of atmospheric research - Atmos. Meas. Tech
←
→
Page content transcription
If your browser does not render page correctly, please read the page content below
Atmos. Meas. Tech., 12, 517–524, 2019
https://doi.org/10.5194/amt-12-517-2019
© Author(s) 2019. This work is distributed under
the Creative Commons Attribution 4.0 License.

Gravimetrically prepared carbon dioxide standards in support of
atmospheric research
Bradley D. Hall1 , Andrew M. Crotwell1,2 , Benjamin R. Miller1,2 , Michael Schibig3 , and James W. Elkins1
1 Global Monitoring Division, National Oceanic and Atmospheric Administration,
325 Broadway, Boulder, Colorado 80305, USA
2 Cooperative Institute for Research in Environmental Science, University of Colorado, Boulder, Colorado 80309, USA
3 Climate and Environmental Physics, Physics Institute and Oeschger Centre for Climate Change Research,

University of Bern, Bern, Switzerland

Correspondence: Bradley D. Hall (bradley.hall@noaa.gov)

Received: 20 August 2018 – Discussion started: 3 September 2018
Revised: 11 December 2018 – Accepted: 21 December 2018 – Published: 28 January 2019

Abstract. We have explored a one-step method for gravimet-        1986; Zhao and Tans, 2006) and gravimetry (Machida et al.,
ric preparation of CO2 -in-air standards in aluminum cylin-       2011; Rhoderick et al., 2016; Brewer et al., 2014), which pro-
ders. We consider both adsorption to stainless steel sur-         vide traceability to the International System of Units (SI).
faces used in the transfer of highly pure CO2 and adsorp-         The World Meteorological Organization (WMO) Global At-
tion of CO2 to cylinder walls. We demonstrate that CO2 -in-       mosphere Watch (GAW) initially adopted the Scripps Insti-
air standards can be prepared with relatively low uncertainty     tution of Oceanography scale (Keeling et al., 1986) and sub-
(∼ 0.04 %, ∼ 95 % confidence level) by introducing aliquots       sequently the National Oceanic and Atmospheric Adminis-
whose masses are known to high precision and by using well-       tration (NOAA) scale (Zhao et al., 1997), both of which are
characterized cylinders. Five gravimetric standards, prepared     based on repeated manometric measurements of a suite of
over the nominal range of 350 to 490 µmol mol−1 (parts per        primary standards, for WMO-affiliated monitoring networks.
million, ppm), showed excellent internal consistency, with        The WMO scale has been updated over the years as under-
residuals from a linear fit equal to 0.05 ppm. This work com-     standing has improved and measurement records of primary
pliments efforts to maintain the World Meteorological Orga-       standards have increased (Keeling et al., 2002, 1986; Zhao
nization, Global Atmosphere Watch, mole fraction scale for        and Tans, 2006).
carbon dioxide in air, widely used for atmospheric monitor-          Determining the absolute amount of CO2 in air is a chal-
ing. This gravimetric technique could be extended to other        lenge for both gravimetric and manometric methods, par-
atmospheric trace gases, depending on the vapor pressure of       ticularly since the relative uncertainties must be very small
the gas.                                                          (∼ 0.006 % 1σ , or about a factor of 4 lower than the WMO
                                                                  network compatibility goal of 0.1 ppm – WMO, 2018) in or-
                                                                  der to assess changes (drift) in cylinders over many years.
                                                                  Long-term monitoring of atmospheric CO2 requires a stable
1   Introduction                                                  reference, sufficient to identify small atmospheric gradients
                                                                  (of the order of 0.1 µmol mol−1 , or 0.1 ppm, in the remote
Numerous laboratories make routine measurements of atmo-          troposphere). Hereafter we will use parts per million for mi-
spheric carbon dioxide to better understand its sources, sinks,   cromoles per mole. Both methods can be influenced by the
and temporal variability. These measurements are typically        adsorption of CO2 to surfaces. There is increasing evidence
calibrated using high-pressure gas standards containing CO2       that CO2 can adsorb to the internal surfaces of cylinders and
in air (typically natural air with assigned CO2 mole frac-        desorb with decreasing pressure (Langenfelds et al., 2005;
tions), traceable to primary standards prepared or analyzed       Miller et al., 2015; Leuenberger et al., 2015; Brewer et al.,
using absolute methods, such as manometry (Keeling et al.,

Published by Copernicus Publications on behalf of the European Geosciences Union.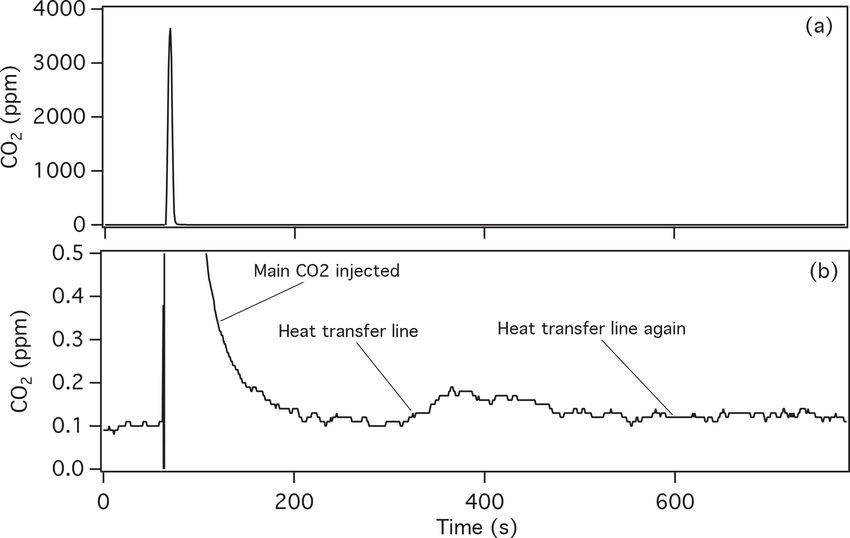
518                        B. D. Hall et al.: Gravimetrically prepared CO2 standards in support of atmospheric research

2018; Schibig et al., 2018). This impacts both the gravimetri-     al., 2018) were performed at pressures ranging from 0.1 to
cally assigned mole fraction and the mole fraction of CO2 in       13.8 MPa. The Schibig et al. (2018) work provided a means
air withdrawn from cylinders over time. Further, since cylin-      to determine the amount of CO2 adsorbed to cylinder walls,
der characteristics may differ among cylinder manufacturers,       and we wanted to perform the gravimetric addition with a
understanding the behavior of CO2 in cylinders is critical to      small amount of residual CO2 in the cylinders, consistent
maintaining stable scales over time.                               with that work. For the standards presented here, the ini-
   The gravimetric technique can employ multiple steps, in         tial CO2 in the cylinder corresponds to < 0.8 % of the to-
which the target gas (CO2 in this case) is diluted to the de-      tal CO2 , and so the uncertainty associated with the mole
sired amount fraction. For example, Brewer et al. (2014) first     fraction of initial CO2 , derived from an independent CO2
prepared standards with mole fractions of a few percent, then      calibration (Zhao and Tans, 2006), makes a negligible con-
made dilutions of those to the range needed for ambient mon-       tribution to the total uncertainty (Table 1). The majority of
itoring (∼ 400 ppm). Others have opted to dilute CO2 to part       the uncertainty in the mass of CO2 originally in the cylin-
per million levels in one step (Machida et al., 2011). Matrix      der results from uncertainty in the mass determination of
gases can also be added in different ways: CO2 can be mixed        the residual air. Nevertheless, we include a standard uncer-
with individual gases (N2 , O2 , Ar) to form an air-like matrix,   tainty of 0.025 % on the WMO X2007 CO2 scale (https://
or CO2 can be added to natural air from which the CO2 has          www.esrl.noaa.gov/gmd/ccl/ccl_uncertainties_co2.html, last
been removed. Methods of targeting stable isotopes of CO2          access: August 2018).
(e.g., 13 C-CO2 ) to better match natural abundances have also        An initial aliquot of high-purity CO2 was added to an
been explored (Brewer et al., 2014).                               evacuated 50 mL stainless steel container with a single metal
   Here we describe one-step preparation of CO2 -in-air com-       bellows valve (Swagelok, model SS-4H) (pressure rated to
pressed gas standards in aluminum cylinders. We used infor-        1000 psi, or 6.90 MPa, at 37 ◦ C). After CO2 was loaded into
mation gained from recent decanting experiments (Schibig et        the 50 mL container at the desired pressure, it was cryo-
al., 2018) to correct for CO2 adsorption to the cylinder walls.    genically transferred to a 5 mL stainless steel container, also
This work was undertaken to support NOAA manometric ef-            with a metal bellows valve (total mass ∼ 150 g) that had
forts and learn more about the behavior of CO2 in aluminum         been evacuated and weighed previously. The CO2 was cryo-
cylinders.                                                         genically purified by freezing at −197 ◦ C and pumping off
                                                                   non-condensible gases. We estimate the purity of the CO2
                                                                   source at 99.994 % and that of the cryogenically purified CO2
2     Experimental methods                                         aliquots at 99.997 ± 0.002 % (Table 2). In this smaller vol-
                                                                   ume, both liquid and vapor phases of CO2 would be present
Standards were prepared in 29.5 L Luxfer aluminum cylin-           at room temperature (18 ◦ C in this case). Note that the vapor
ders (∼ 22 kg empty) (Scott Marrin, Inc., Riverside, CA),          pressure of CO2 at 18 ◦ C is ∼ 795 psi (5.48 MPa) and that our
with brass packless valves (Ceodeux). We chose these cylin-        5 mL container and valve was rated to 1000 psi (6.89 MPa).
ders for two reasons. First, we wanted to perform the dilu-        We employed this secondary transfer to a smaller container
tions in one step and therefore needed relatively large cylin-     so that we could weigh ∼ 1.5 g of CO2 on a balance with
ders. Second, we wanted to use cylinders that were well char-      0.01 mg readability (Mettler Toledo AT201, 200 g capacity).
acterized. We have considerable experience with CO2 in air         The 50 mL container used in the first step is too large to be
in this type of cylinder. Specific to this work, all cylinders     weighed on the AT-201. This is an important aspect of this
used were filled with natural air and decanted several times       work. Without this secondary step, our uncertainties would
for CO2 adsorption studies (Schibig et al., 2018) prior to be-     have been about a factor of 10 larger. The mass of CO2 in
ing used for gravimetric standards described here.                 each 5 mL aliquot was determined by weighing the 5 mL
   For this gravimetric work, each cylinder was evacuated to       container relative to a control object of similar mass and den-
∼ 30 mtorr (4 Pa) and weighed on a mass comparator (Sarto-         sity (sequence ABABA. . . ). The AT-201 was calibrated using
rius CCE40K3: 40 kg capacity, 2 mg readability) relative to a      internal weights and span-checked by adding a 2.0000 g mass
control cylinder of similar mass and volume. The mass com-         to the 5 mL container.
parator was calibrated using a 10 kg mass (Troemner), and             Each purified CO2 aliquot was transferred from the 5 mL
linearity over the working range was confirmed by adding           container to a partially evacuated cylinder on a stainless steel
a 5 kg mass (Mettler Toledo) to the reference cylinder. We         vacuum manifold using a pressurization–expansion method
then added ∼ 50 psi (0.34 MPa) natural air containing 402 or       (Fig. 1) (Dlugokencky et al., 2005). The cylinder was con-
408 ppm CO2 determined by analysis (WMO X2007 scale).              nected to the vacuum manifold using a 1/8 in. o.d. AT-steel
Cylinders were then vented, partially evacuated to ∼ 400 torr      transfer line. AT steel, also known as “activity tested steel”
(53 kPa), and weighed. The mass of residual air along with         (Grace Discovery Science, Columbia, MD), is treated using
the mole fraction of CO2 was used to calculate the ini-            vapor deposition to improve surface inertness. In initial tests
tial mass of CO2 in the cylinder. We did not evacuate the          we found that AT steel performed better than other types of
cylinders further because CO2 adsorption studies (Schibig et       stainless steel, but in subsequent tests both 1/8 in. o.d. stain-

Atmos. Meas. Tech., 12, 517–524, 2019                                                  www.atmos-meas-tech.net/12/517/2019/
B. D. Hall et al.: Gravimetrically prepared CO2 standards in support of atmospheric research 519
Table 1. Components and standard uncertainties associated with standard preparation.
Components
Cylinder CO2 _a µ_CO2 _a CO2 _b µ_CO2 _b Air µ_Air nCO2 µ_nCO2
g g g g g g mol mol
CB11873 1.36062 0.00008 6.80 × 10⁻³ 2.24 × 10⁻⁵ 2515.630 0.033 3.1070 × 10⁻² 1.1888 × 10⁻⁶
CB11906 1.52917 0.00007 7.28 × 10⁻³ 1.25 × 10⁻⁵ 2542.391 0.026 3.4911 × 10⁻² 1.3934 × 10⁻⁶
CB11941 1.51156 0.00015 1.07 × 10⁻² 1.25 × 10⁻⁵ 2470.254 0.030 3.4589 × 10⁻² 3.4205 × 10⁻⁶
CB11976 1.66307 0.00011 7.32 × 10⁻³ 1.18 × 10⁻⁵ 2445.190 0.014 3.7954 × 10⁻² 2.5140 × 10⁻⁶
CB12009 1.71751 0.00007 7.72 × 10⁻³ 1.81 × 10⁻⁵ 2307.297 0.039 3.9200 × 10⁻² 1.6437 × 10⁻⁶
Adjustments Amount fraction
Cylinder nair µ_nair XCO2 ,ad µ_XCO2 ,ad XCO2 ,dil µ_XCO2 ,dil XCO2 µ_XCO2
mol mol ppm ppm ppm ppm ppm ppm
CB11873 86.8651 0.0144 −0.015 0.01 0.01 0.01 357.545 0.059
CB11906 87.7891 0.0146 −0.015 0.01 0.01 0.01 397.497 0.062
CB11941 85.2982 0.0142 −0.017 0.01 0.01 0.01 405.337 0.073
CB11976 84.4328 0.0140 −0.020 0.01 0.01 0.01 449.301 0.075
CB12009 79.6713 0.0133 −0.022 0.01 0.01 0.01 491.763 0.077
Note: Entries preceded by “µ_” represent standard uncertainties (∼ 68 % confidence level).
CO2 _a: mass of CO2 aliquot in a 5 mL container, added to cylinder.
CO2 _b: initial mass of CO2 in the cylinder (based on analyzed mole fraction and mass of residual air).
Air: mass of air (includes 10–15 g residual air initially present in cylinder).
nCO : total amount of CO2 (moles) (0.99997 purity correction applied).
2
nair : total amount of air (moles).
XCO ,ad : correction applied to account for adsorption to cylinder walls.
2
XCO ,dil : correction applied to account for CO2 in the dilution gas.
2
XCO : mole fraction of CO2 .
2
Table 2. CO2 purity assessment.
Component Fraction Method
CO2 (source) 0.99994
CO2 (aliquot)a 0.99997
H2 O 0.00003 electrolytic
CH4 0.00002 laser spectroscopy
CO 0.00001 laser spectroscopy
N2 O 2 × 10⁻⁸ GC-ECDb
Ethyne 3 × 10⁻⁹ GC-GCMSc
Figure 1. Schematic of the blending manifold. The sample aliquot
Ethene 2 × 10⁻⁹ GC-GCMS
(5 mL) was connected to one of three aliquot inlet ports (p1, p2, p3).
Propane 2 × 10⁻⁹ GC-GCMS The sample was transferred to the receiving cylinder by opening the
Other hydrocarbons < 2 × 10⁻⁸ GC-GCMS cylinder valve (with v2 closed), opening the valve on the 5 mL ves-
Total non-condensible 0.00002 residual pressure sel, and then alternately pressurizing the section between valves v2
a Since the CO aliquots were cryogenically purified to remove
2
and v3 and opening v3 to send the gas to the cylinder. The sam-
non-condensible gases, we calculate the aliquot purity based on H2 O only. ple manifold is constructed of 1/4 in. o.d. stainless steel tubing with
Non-condensibles include N2 , O2 , Ar, H2 , CO, and CH4 .
b Gas Chromatography with Electron Capture Detection welded or Swagelok VCR connections. Valves are stainless steel,
c Gas Chromatography with Mass Selective Detection diaphragm-sealed (Swagelok model DSV51).
less steel and 1/8 in. o.d. AT steel performed similarly (see CO2 resulted in significant cooling of the 5 mL container, so
Sect. 3). we heated the 5 mL container, manifold, and transfer lines
To transfer the aliquot to the cylinder, the manifold and to ∼ 60 ◦ C while alternately pressurizing the 5 mL container
transfer lines were preheated to ∼ 60 ◦ C and evacuated to to ∼ 200 psi (1.38 MPa) with CO2 -free air (dilution gas) and
5 mtorr (0.7 Pa). In quick succession, the cylinder valve was expanding into the cylinder. After about 20 pressurization–
opened and the valve on the 5 mL container was opened, al- expansion cycles, the valve on the 5 mL container was closed
lowing CO2 to expand into the cylinder. The expansion of and the cylinder pressurized with dilution gas. The 5 mL con-
www.atmos-meas-tech.net/12/517/2019/ Atmos. Meas. Tech., 12, 517–524, 2019520 B. D. Hall et al.: Gravimetrically prepared CO2 standards in support of atmospheric research
tainer was removed from the manifold at a cylinder pressure
of ∼ 500 psi (3.45 MPa), and the cylinder was then further
pressurized to 1000 psi (6.90 MPa) with dilution gas. Dilu-
tion gas consisted of scrubbed natural air (cryogenic ultra-
pure grade, Scott Marrin, Inc.; now Praxair, Los Angeles,
CA). This gas was analyzed for CO2 by nondispersive in-
frared analysis (NDIR; LI-COR Li-7000). Samples of di-
lution gas were compared to a reference of dry nitrogen
(99.999 %) scrubbed using Ascarite II (Sigma Aldrich). All
cylinders of dilution gas contained 0.01±0.01 ppm CO2 . Af-
ter cylinders cooled to room temperature, they were weighed
on the mass comparator relative to the control cylinder.
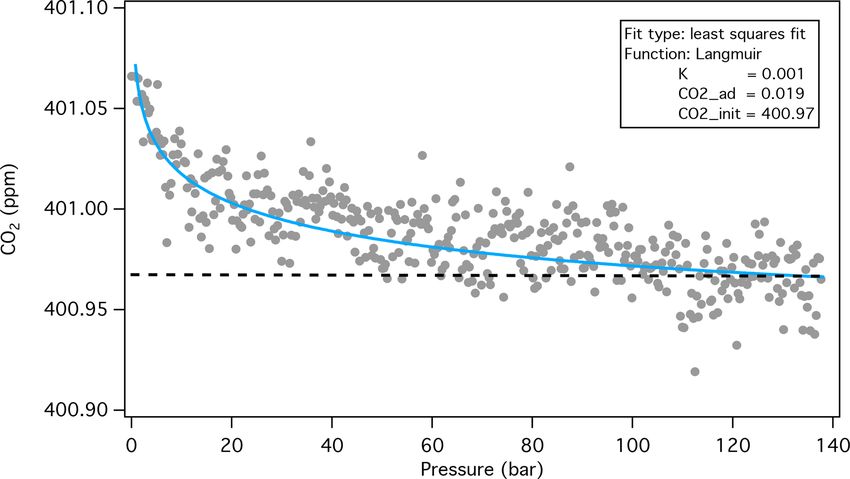
The mole fraction of CO2 , XCO2 , was calculated using Figure 2. Typical result from Schibig et al. (2018) CO2 decanting
Eq. (1), where na is the moles of CO2 transferred from the experiments showing an increase in XCO2 with decreasing cylinder
5 mL container, nb is the moles of CO2 initially present in pressure. The fraction of CO2 adsorbed was found by comparing
the cylinder, nair is the total moles of air (sum of natural air the area under the Langmuir isotherm (blue line) with the area un-
initially present and dilution air), p is the purity coefficient, der the Langmuir isotherm but above the initial CO2 mole fraction
f is the transfer efficiency, XCO2 ,ad is a correction for the (dashed line). The adsorbed CO2 calculated this way, expressed as
a mole fraction, is similar to the parameter CO2,ad from the Lang-
amount of CO2 adsorbed to the cylinder walls (XCO2 ,ad < 0)
muir model (Leuenberger et al., 2015; Schibig et al., 2018). Fit pa-
expressed in parts per million, and XCO2 ,dil is the amount of rameters, K, CO2 _ad, and CO2 _init, are described in Leuenberger
CO2 in the dilution air, also expressed in parts per million. et al. (2015).
pf na + nb
XCO2 = + XCO2 ,ad + XCO2 ,dil (1)
pf na + nb + nair Table 3. Summary of CO2 adsorption experiments. For each cylin-
der, the test was repeated N times. Adsorbed CO2 is expressed as a
The amount of each component was determined from the
fraction of the total CO2 in the cylinder.
mass and molecular weight. For CO2 we used a molecu-
lar weight of 44.0096 ± 0.0006 g mol−1 (consistent with a
13 C-CO content of −29 ‰ on the Vienna Peedee belem- Cylinder N Average SD
2
% %
nite (VPBD) scale, determined using off-axis integrated cav-
ity output spectroscopy (Los Gatos Research) traceable to the CB11873 5 0.0043 % 0.0003 %
University of Colorado (INSTAAR) Stable Isotope Labora- CB11941 4 0.0042 % 0.0003 %
tory realization of VPDB; Trolier et al., 1996; Tans et al., CB11906 5 0.0038 % 0.0004 %
CB11976 5 0.0044 % 0.0005 %
2017). For the dilution gas, we used a molecular weight of
CB12009 5 0.0044 % 0.0002 %
28.9602 ± 0.0042 g mol−1 . The oxygen content of the dilu-
tion gas was measured using a paramagnetic method (Beck-
man, E2) traceable to NIST SRM 2659A (20.863 ± 0.011 %
O2 in N2 ). Argon was taken as 0.933 % (Sutour et al., 2007), der is vented slowly to near-ambient pressure (Fig. 2). The
and the noble gases Xe, Ne, and Kr were taken as 0.09, 18.0, amount of CO2 adsorbed to the walls, expressed as a frac-
and 1.14 ppm, respectively. Nitrogen was assumed to com- tion of the total amount of CO2 in the cylinder, was typically
prise the remaining fraction. We assumed 100 % transfer ef- about 0.004 % (Table 3). Although the low-flow data show
ficiency (f = 1.0) with an uncertainty of 0.01 % (rectangular very good reproducibility (Table 3), we assumed a standard
distribution) (see Sect. 3). uncertainty of 0.01 ppm.
The mole fraction correction for CO2 adsorbed to the Five standards were prepared gravimetrically, with CO2
cylinder walls (XCO2 ,ad ) was determined from multiple mole fractions ranging from 357 to 492 ppm. Prepara-
decanting experiments (Schibig et al., 2018). Briefly, in tion uncertainties were determined by propagating uncer-
those experiments, cylinders were filled with dry natural air tainties associated with variables in Eq. (1) (Table 1),
(∼ 400 ppm) and drained at 0.3 L min−1 and analyzed con- using software available from the National Institute of
tinuously for CO2 by NDIR. These studies showed remark- Standards and Technology (NIST) (https://www.nist.gov/
ably consistent results: that the mole fraction of CO2 exit- programs-projects/metrology-software-project, last access:
ing the cylinder increased as the cylinder pressure decreased May 2014). The two most important factors influencing un-
and that the data can be described with a Langmuir isotherm certainty are repeatability associated with weighing the pu-
(Fig. 2). By fitting the data with a Langmuir isotherm as de- rified CO2 aliquot (contributing ∼ 25 %) and the molecular
rived by Leuenberger et al. (2015), and integrating the area weight of air (contributing ∼ 65 %). For MWair , the uncer-
between the Langmuir fit and the initial XCO2 , we determined tainty is partially limited by our ability to measure O2 and
the amount of CO2 that desorbs from the walls as the cylin- calibrate the O2 analyzer.
Atmos. Meas. Tech., 12, 517–524, 2019 www.atmos-meas-tech.net/12/517/2019/B. D. Hall et al.: Gravimetrically prepared CO2 standards in support of atmospheric research 521
Figure 3. Normalized response of gravimetrically prepared stan-
dards, analyzed by laser spectroscopy (b). Residuals from linear fit Figure 4. Measure of CO2 passing through a ∼ 1 m AT-steel trans-
are shown in (a), along with preparation uncertainties (∼ 68 % con- fer line. The peak in (a) results from 0.6 cm3 air containing 10 %
fidence level, or coverage factor k = 1). CO2 injected into CO2 -free air flowing at 0.2 L min−1 . Panel (b) is
an expanded view of (a), showing a second peak at ∼ 400 s, which
results from CO2 driven off the tubing by heating.
3 Results and discussion
Following preparation, standards were analyzed using laser
spectroscopy (Tans et al., 2017). Each standard was analyzed dards were prepared following several heating cycles and are
twice over a period of 2 weeks. The response was expressed less likely to be influenced by any residual CO2 .
as the mole fraction of CO2 , calculated on the WMO X2007 To support our assumption of 100 % transfer efficiency,
CO2 scale, relative to that of CB11941. We use this relative we examined both the potential for adsorption of CO2 in
response because mole fraction assignments on the X2007 the manifold and transfer lines and the efficiency of trans-
scale account for differences in the abundances of stable ferring CO2 from the 5 mL container to a cylinder. We tested
isotopes of CO2 (mainly 13 C-CO2 ) between the gravimetric the transfer line by flowing air containing ∼ 0.1 ppm CO2 at
standards and secondary standards used for calibration (Tans 0.2 L min−1 through 1/8 in. AT-steel tubing to an NDIR an-
et al., 2017). For comparison, we also calculated the response alyzer. Then we injected 0.6 mL of 10 % CO2 in air into this
based on the analyzer signal derived from a single CO2 iso- air stream. After the initial slug of CO2 was observed and
topologue (16 O-12 C-16 O, 626). Both methods give similar re- the NDIR signal returned to baseline, we heated the transfer
sults with respect to consistency of the standard set. line and measured the additional CO2 coming off (Fig. 4).
Table 4 and Fig. 3 show the best-fit results and resid- Comparing the area of the CO2 released upon heating with
uals (difference between best fit and prepared mole frac- that of the main sample injected, we found that our AT-steel
tion). All standards agree (within expanded uncertainties) transfer line (length 1 m) retained about 0.04 % of CO2 in
with the regression line. The standard deviation of residu- the sample. We were able to drive off most of this CO2 on
als is 0.05 ppm and the largest residual is 0.09 ppm. Since the first heating cycle, with < 0.01 % released on subsequent
the uncertainty associated with the molecular weight of air is heating. Tests with stainless steel (not AT steel) showed sim-
the largest contributor to the total uncertainty, but is common ilar results. By heating the lines multiple times and passing a
to all standards, it is worth recalculating uncertainty with- large amount of CO2 -free air through them, it is unlikely that
out this contribution in order to assess consistency. With- a significant amount of CO2 would remain in the manifold or
out µ_MWair , standard uncertainties for each standard are transfer line.
40 %–60 % lower than when µ_MWair is included. Recalcu- We tested the transfer efficiency from the 5 mL container
lating the regression using these lower uncertainties, we find by cryogenically moving aliquots of CO2 from one 5 mL
that the residuals do not change appreciably. However, the container to another on a vacuum line (using liquid N2 ),
residual for cylinder CB11941 becomes 0.098 ppm. With a without additional flushing, and measuring changes in mass.
standard uncertainty of 0.046 ppm, CB11941 is not consis- When both the initial 5 mL container and transfer line were
tent with the rest of the standards. This may be the result heated, a transfer efficiency of 99.9 ± 0.1 % was achieved.
of preparation. Cylinder CB11941 was the first standard pre- Without heating, the same test revealed only 99 % efficiency.
pared and followed testing that involved injecting high con- We expect that repeated pressurization–expansion with CO2 -
centrations of CO2 into the manifold and transfer lines. It is free air, in addition to heating, would improve the trans-
possible that some residual CO2 remained in the manifold fer efficiency of the CO2 aliquot to near 100 %. The rela-
and transfer lines and was introduced into CB11941 when tively good agreement among the four standards prepared af-
the manifold and transfer lines were heated. The other stan- ter CB11941 supports this assumption. It seems unlikely that
www.atmos-meas-tech.net/12/517/2019/ Atmos. Meas. Tech., 12, 517–524, 2019522 B. D. Hall et al.: Gravimetrically prepared CO2 standards in support of atmospheric research
Table 4. Analysis of CO2 -in-air standards. Best-fit values were determined from a linear fit (response vs. prepared CO2 ) using orthogonal
distance regression, with fit coefficients equal to 2.4644 × 10⁻³ and 8.7851 × 10⁻⁴ . Uncertainties (unc.) are shown as a ∼ 68 % confidence
level. Results are not sensitive to how the response was normalized.
Cylinder Prepared Unc. Response Unc. Best-fit Residual
ppm ppm ppm ppm
CB11873 357.545 0.059 0.881915 0.000028 357.512 −0.033
CB11906 397.497 0.062 0.980465 0.000025 397.502 0.005
CB11941 405.337 0.073 1.000000 0.000025 405.429 0.092
CB11976 449.301 0.075 1.108007 0.000025 449.257 −0.044
CB12009 491.763 0.077 1.212741 0.000039 491.756 −0.007
Table 5. Results of mother–daughter testing on 29.5 L aluminum cylinders. Note that final pressures do not sum correctly due to thermal
differences. Mother–daughter differences were calculated as daughter minus mother (after transfer).
Cylinder ∼ Pressure (MPa) CO2 (ppm)
CB11795 Mother 12.07 initial 401.928
CB11795 Mother 5.79 after transfer 401.988
CB11941 Daughter 0.03 initial n/a
CB11941 Daughter 5.72 after transfer 401.828
change in mother 0.06
daughter–mother −0.16
CB11088 Mother 13.80 initial 408.125
CB11088 Mother 6.69 after transfer 408.188
CB11873 Daughter 0.03 initial n/a
CB11873 Daughter 6.55 final 407.995
change in mother 0.06
daughter–mother −0.19
n/a: not applicable
this level of agreement could be achieved with poor or vari- containing natural air was transferred into CB11941 and
able transfer efficiency. CB11873. We found that the CO2 in daughter cylinders
As mentioned earlier, we estimated the amount of CO2 ad- CB11941 and CB11873 was 0.16–0.19 ppm lower than their
sorbed to the cylinder walls (∼ 0.004 %) from the results of respective mothers after transfer (Table 5), similar to the re-
low-flow decanting experiments. The Schibig et al. (2018) sults of Miller et al. (2015) and Brewer et al. (2018). Our tests
decanting tests reveal substantially less CO2 adsorbed com- with 5.9 L cylinders also showed differences of ∼ 0.2 ppm
pared to “mother–daughter” tests (Miller et al., 2015; Brewer (not shown).
et al., 2018), in which half the contents of one cylinder are Mother–daughter tests suggest 5 to 10 times more ad-
transferred to an equal size cylinder and the adsorption deter- sorption than that determined from the Schibig et al. (2018)
mined based on the resulting mole fraction difference. From low-flow data. The difference between mother–daughter tests
mother–daughter tests on 5.9 L cylinders from Airgas (River- and the low-flow experiments could be related to thermal
ton, NJ) and 5 L cylinders from Air Products (Vilvoorde, fractionation. Schibig et al. (2018) performed both low-
Belgium), Miller et al. (2015) estimated that about 0.02 % flow (0.3 L min−1 ) and high-flow (5.0 L min−1 ) decanting
of the CO2 was adsorbed to the walls. Brewer et al. (2018) experiments. They found that changes in CO2 at the high
performed similar tests on 10 L aluminum cylinders treated flow rate were 2.5 times those observed at the low flow
with the BOC Spectra Seal process and found CO2 adsorp- rate and attributed the difference to thermal fractionation
tion fractions of about 0.05 %. at the higher flow rate. During our mother–daughter tests,
In preparation for this work, we performed mother– the mother cylinders experienced significant cooling during
daughter tests on both 5.9 and 29.5 L aluminum cylinders transfer, which could have caused fractionation as cooler air
(Scott Marrin, Riverside, CA), including cylinders CB11941 sinks in the center core of the cylinder, with CO2 preferen-
and CB11873 used in this work. Cylinders CB11941 and tially remaining in the mother cylinder. In fact, after trans-
CB11873 were filled with natural air, vented, and then evac- ferring half of the gas from a mother cylinder to a respective
uated to 5 psia (0.03 MPa). Air from two mother cylinders daughter cylinder, the mole fraction of CO2 in each mother
Atmos. Meas. Tech., 12, 517–524, 2019 www.atmos-meas-tech.net/12/517/2019/B. D. Hall et al.: Gravimetrically prepared CO2 standards in support of atmospheric research 523
cylinder increased 0.06±0.01 ppm relative to its value deter- Competing interests. The authors declare that they have no conflict
mined prior to transfer (Table 5). From Fig. 2, which repre- of interest.
sents a typical low-flow decanting result, the increase due to
desorption from the cylinder walls should be far smaller than
0.06 ppm at 50 % of the original cylinder pressure. Acknowledgements. This work was supported, in part, by NOAA’s
Finally, we compare these standards to the WMO X2007 Atmospheric Chemistry, Carbon Cycle, and Climate program
CO2 scale. The mean ratio of gravimetrically assigned mole (AC4). Michael Schibig was supported by an Early Postdoc
Mobility fellowship from the Swiss National Science Foundation
fractions to values assigned on the WMO X2007 scale
(SNSF) while working at NOAA in Boulder, CO. The authors thank
is 1.00045 with a standard deviation of 0.00017. Thus,
Thomas Mefford for performing the analysis and Duane Kitzis for
the WMO X2007 scale is ∼ 0.05 % lower than a scale providing cylinders of clean, unpolluted air.
based on these gravimetric standards. However, this differ-
ence is not outside the range of uncertainties (∼ 0.05 % for Edited by: Marc von Hobe
WMO X2007 and ∼ 0.033 % for this work, ∼ 95 % confi- Reviewed by: three anonymous referees
dence level, or coverage factor k = 2). While the 13 C-CO2
content of these gravimetrically prepared standards is lower
than that of natural air (−29 ‰, compared to about −8 ‰
References
for natural air), and these standards were compared to WMO
secondary standards with 13 C-CO2 at ambient levels during Brewer, P. J., Brown, R. J. C., Miller, M. N., Miñarro, M.
analysis, this introduces negligible bias because the analyt- D., Murugan, A., Milton, M. J. T., and Rhoderick, G. C.:
ical method compensates for different isotopic abundances Preparation and Validation of Fully Synthetic Standard Gas
(Tans et al., 2017). Further discussion on differences between Mixtures with Atmospheric Isotopic Composition for Global
the WMO X2007 scale and these gravimetric standards will CO2 and CH4 Monitoring, Anal. Chem., 86, 1887–1893,
be included in a subsequent publication. https://doi.org/10.1021/ac403982m, 2014.
Brewer, P. J., Brown, R. J. C., Resner, K. V., Hill-Pearce, R. E.,
Worton, D. R., Allen, N. D. C., Blakley, K. C., Benucci, D.,
and Ellison, M. R.: Influence of Pressure on the Composition
of Gaseous Reference Materials, Anal. Chem., 90, 3490–3495,
4 Conclusions https://doi.org/10.1021/acs.analchem.7b05309, 2018.
Dlugokencky, E. J., Myers, R. C., Lang, P. M., Masarie,
K. A., Crotwell, A. M., Thoning, K. W., Hall, B. D.,
Five gravimetric CO2 -in-air standards, prepared at the parts
Elkins, J. W., and Steele, L. P.: Conversion of NOAA at-
per million level in one dilution step, show excellent internal mospheric dry air CH4 mole fractions to a gravimetri-
consistency. Prepared mole fractions were adjusted for CO2 cally prepared standard scale, J. Geophys. Res.-Atmos., 110,
expected to adsorb to cylinder walls. This correction was de- https://doi.org/10.1029/2005JD006035, 2005.
termined from low-flow decanting studies and is a factor of Keeling, C. D., Guenther, P. R., and Moss, D. J.: Scripps reference
5–10 smaller than that inferred from mother–daughter tests. gas calibration system for carbon dioxide-in-air standards: revi-
With improved understanding of CO2 adsorption character- sion of 1985, Gaw Report No. 42, WMO, Geneva, Switzerland,
istics, and by introducing condensed-phase aliquots of CO2 1986.
into small vessels that can be weighed with sufficient repeata- Keeling, C. D., Guenther, P. R., Emanuele, G., Bollenbacher, A.,
bility, CO2 -in-air standards can be prepared with relatively and Moss, D. J.: Scripps reference gas calibration system for car-
low uncertainty. This work supports parallel efforts to main- bon dioxide-in-nitrogen and carbon dioxide-in-air standards: re-
vision of 1999, Scripps Institution of Oceanography, La Jolla,
tain the WMO mole fraction scale for CO2 .
CA, 2002.
Langenfelds, R. L., van der Schoot, M. V., Francey, R. J., Steele,
L. P., Schmidt, M., and Mukai, H.: Modification of air stan-
Data availability. Most relevant data are included in Tables 1–3. dard composition by diffusive and surface processes, J. Geophys.
Data needed to calculate values in Table 3 are available in Schibig Res.-Atmos., 110, https://doi.org/10.1029/2004JD005482, 2005.
et al. (2018). Additional data are available in the Supplement. Leuenberger, M. C., Schibig, M. F., and Nyfeler, P.: Gas adsorp-
tion and desorption effects on cylinders and their importance
for long-term gas records, Atmos. Meas. Tech., 8, 5289–5299,
Supplement. The supplement related to this article is available https://doi.org/10.5194/amt-8-5289-2015, 2015.
online at: https://doi.org/10.5194/amt-12-517-2019-supplement. Machida, T., Tohjima, Y., Katsumata, K., and Mukai, H.: A new
CO2 calibration scale based on gravimetric one-step dilution
cylinders in National Institute for Environmental Studies – NIES
Author contributions. BDH designed the experiment, carried out 09 CO2 Scale, Gaw Report No. 194, WMO, Geneva, Switzer-
the laboratory work, and prepared the standards. AMC and BJM land, 165–169, 2011.
performed purity analysis. MS performed cylinder stability tests. Miller, W. R., Rhoderick, G. C., and Guenther, F. R.: Inves-
BDH prepared the paper with contributions from all authors. tigating Adsorption/Desorption of Carbon Dioxide in Alu-
www.atmos-meas-tech.net/12/517/2019/ Atmos. Meas. Tech., 12, 517–524, 2019524 B. D. Hall et al.: Gravimetrically prepared CO2 standards in support of atmospheric research minum Compressed Gas Cylinders, Anal. Chem., 87, 1957– Trolier, M., White, J. W. C., Tans, P. P., Masarie, K. A., and 1962, https://doi.org/10.1021/ac504351b, 2015. Gemery, P. A.: Monitoring the isotopic composition of atmo- Rhoderick, G. C., Kitzis, D. R., Kelley, M. E., Miller, W. R., spheric CO2 : Measurements from the NOAA Global Air Sam- Hall, B. D., Dlugokencky, E. J., Tans, P. P., Possolo, A., pling Network, J. Geophys. Res.-Atmos., 101, 25897–25916, and Carney, J.: Development of a Northern Continental Air https://doi.org/10.1029/96JD02363, 1996. Standard Reference Material, Anal. Chem., 88, 3376–3385, WMO: 19th WMO/IAEA Meeting on Carbon Dioxide, Other https://doi.org/10.1021/acs.analchem.6b00123, 2016. Greenhouse Gases and Related Tracers Measurement Techniques Schibig, M. F., Kitzis, D., and Tans, P. P.: Experiments with CO2 - (GGMT-2017), Geneva, Switzerland, 2018. in-air reference gases in high-pressure aluminum cylinders, At- Zhao, C. L., Tans, P. P., and Thoning, K. W.: A high precisionmano- mos. Meas. Tech., 11, 5565–5586, https://doi.org/10.5194/amt- metric systemfor absolutecalibrations of CO2 in dry air, J. Geo- 11-5565-2018, 2018. phys. Res., 102, 5885–5894, 1997. Sutour, C., Stumpf, C., Kosinski, J. P., Surget, A., Hervouët, G., Zhao, C. L. and Tans, P. P.: Estimating uncertainty of the WMO Yardin, C., Madec, T., and Gosset, A.: Determination of the argon mole fraction scale for carbon dioxide in air, J. Geophys. Res., concentration in ambient dry air for the calculation of air density, 111, https://doi.org/10.1029/2005JD006003, 2006. Metrologia, 44, 448–452, 2007. Tans, P. P., Crotwell, A. M., and Thoning, K. W.: Abun- dances of isotopologues and calibration of CO2 greenhouse gas measurements, Atmos. Meas. Tech., 10, 2669–2685, https://doi.org/10.5194/amt-10-2669-2017, 2017. Atmos. Meas. Tech., 12, 517–524, 2019 www.atmos-meas-tech.net/12/517/2019/
You can also read