GROUND WATER INFORMATION RAJSAMAND DISTRICT RAJASTHAN
←
→
Page content transcription
If your browser does not render page correctly, please read the page content below
GOVERNMENT OF INDIA

MINISTRY OF WATER RESOURCES

CENTRAL GROUND WATER BOARD

GROUND WATER INFORMATION
   RAJSAMAND DISTRICT
        RAJASTHAN

        WESTERN REGION

            JAIPUR

             2013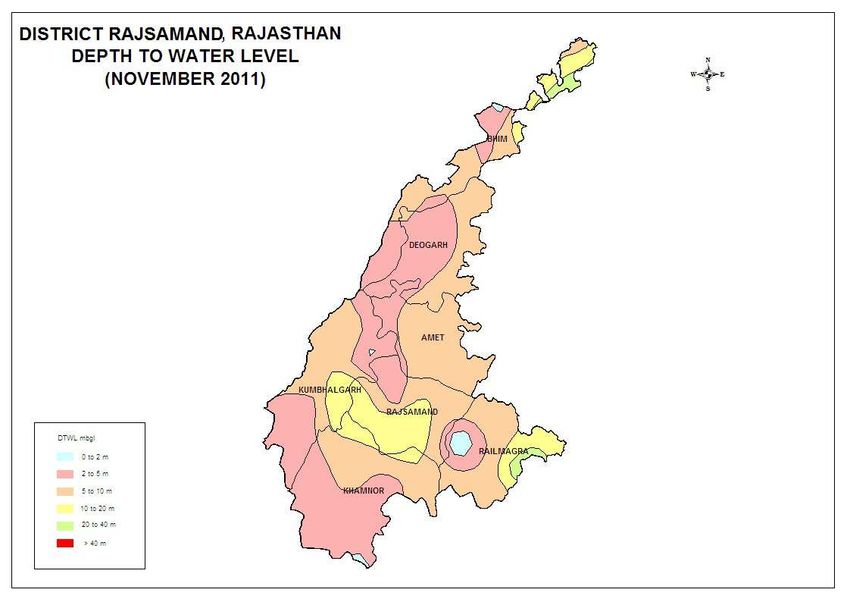
2
RAJSAMAND DISTRICT AT A GLANCE
Latitude (North)                                24o46'32" : 26o01'36"
Longitude (East)                                 73o28'30":74o18'55"
Geographical area (sq. km)                         4522.26 sq km
Per cent area of the State                              1.33
Altitude                                        532.50 m above mean sea Level
No. of Tehsils & Name                                    (7)
                                Amet, Bhim, Deogarh, Khamnor, Kumbhalgarh,
                                Railmagra, Rajsamand
No. of Blocks & Name                                     (7)
                                Amet, Bhim, Deogarh, Khamnor, Kumbhalgarh,
                                Railmagra, Rajsamand
No. of Villages                 1037
Population (as per 2011         Rural : 972777
census)
                                Urban : 183820
Average annual rainfall (mm)         524.37 mm
(2001-2011)
Major physiographical           Rolling topography intersected by shallow valleys.
Units                           Aravalli hills in the western part, central and eastern
                                parts occupied by relatively plain area forming foothills
                                of Aravallis. Alluvium more conspicuous and relatively
                                thick.
Major Drainage                  Banas river and its tributaries viz. Khari, Candrabhaga,
                                Gomati, Kothari, Ahar etc.
Land Use (ha) (As on 2010-11) (Source: Dte. Of Economics & Statistics, Ministry of
Agriculture, GOI)
Forest area                                        25952
Other      uncultivable   land                    174425
excluding current fallows
Fallow land                                        31087
Land      not   available    for                         126565
cultivation
Net sown area                                            94697
Total cropped area                                       145629
Area sown more than once                                 50932
Principal crops (Source: Dte. Of Economics & Statistics, Ministry of Agriculture, GOI) (As
on 2010-11)
Crop                                                    Area (ha)
Maize                                                     63620
Wheat                                                     31898
Jowar                                                     8310
Barley                                                    8472
Pulses                                                    3508
Condiments & spices                                       1476
Oil seeds                                                 13787
Fruits & vegetables                                        689
Fibre                                                     2888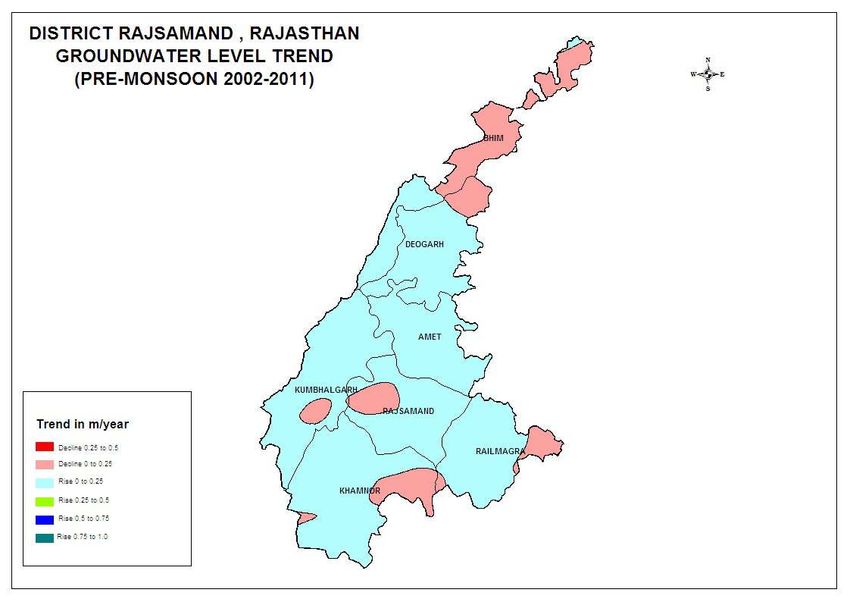
Irrigation by different sources (As on 2010-11) (Source: Dte. Of Economics & Statistics,
Ministry of Agriculture, GOI)
Source                                Net area irrigated Gross area irrigated
Canals                                          -                           -
Tanks                                         4606                        4666
Tubewells                                     895                         1243
Other wells                                  38549                      43156
Other sources                                   3                           3
Total                                        44053                      49068
No. of observation wells                    30
Monitored
Geological formations                 Rocks of Aravalli Bhilwara Super group, Aravalli
                                      super group and Delhi Super group and alluvial
                                      deposits along the channels of river Banas, Khari
                                      and other rivers in the form of valley fills.
Principal water bearing             Quartzite, Phyllite, Gneisses, Schist, Dolomitic
Formations                          marble
Pre-monsoon depth to                2.25 - 18.04
water level during 2011 (mbgl)
Post-monsoon depth to               0.7 - 15.95
water level during 2011 (mbgl)
    Ground Water Quality
Electrical Conductivity                             1120 - 5920 µS/cm at 25°C
Fluoride                                          0.5 - 3.8 mg/l
Nitrate                                           2.8 - 500 mg/l
Iron                                              0 - 4.89 mg/l
Type of water                                               Alkaline
Ground Water Exploration
Type of wells                                                Total
EW                                                           48
OW                                                            2
SH                                                            7
Depth of wells (m)                                        8 to 203
Discharge (lpm)                                       Meagre to 1110
Electric Conductivity                              300 to 3440 µS/cm at 25°C
Total annually replenishable                          103.6106 MCM
ground water resource
Net annual GW availability                             93.2495 MCM
Gross GW draft for all uses                           118.1736 MCM
Stage of GW development                                  126.73 %
Major ground water problems and      Over-exploitation of ground water, declining
issues                               ground water levels

                                         ii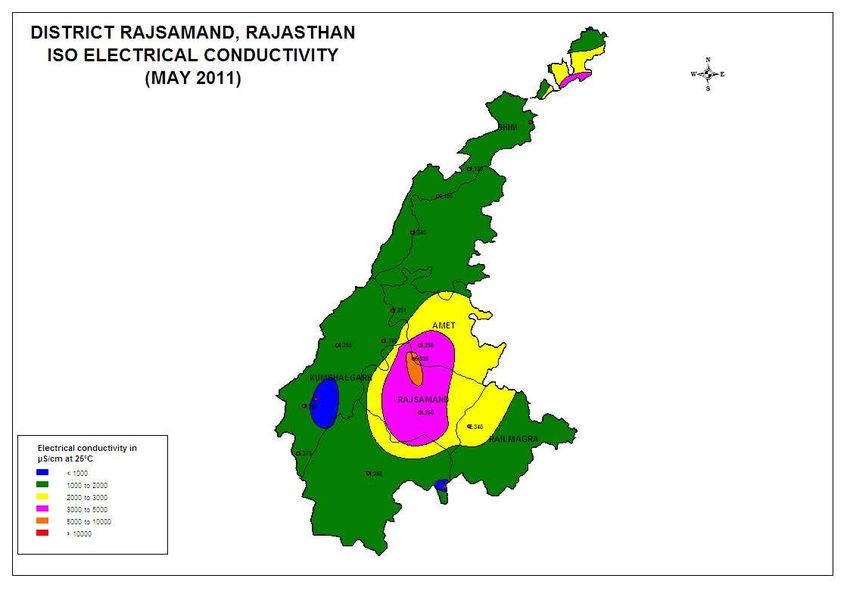
Ground Water Information
                           Rajsamand District
                                      Contents
1.0   Introduction                                                   1
2.0   Rainfall & Climate                                             2
3.0   Geomorphology & Drainage                                       3
4.0   Soil, Land Use & Irrigation Practices                          3
4.1   Land-use pattern                                                4
4.2   Irrigation                                                      4
5.0   Geological Framework                                           4
6.0   Ground Water Scenario                                          4
6.1   Hydrogeology                                                    4
6.2   Ground water levels                                             6
6.3   Chemical quality of ground water                                9
7.0   Ground Water Resources                                         12
7.1   Status of ground water development                             12
8.0   Ground Water Related Issues & Problems                         13
9.0   Ground Water Management Strategy                               13
9.1   Ground water development                                       13
9.2   Water conservation and artificial recharge                     13
10.0 Recommendations                                                 13
                                   List of Figures
1.    Map showing Administrative Divisions
2.    Hydrogeological map
3.    Depth to Water Level Map (May, 2011)
4.    Depth to Water Level Map (November, 2011)
5.    Seasonal water level fluctuation map (May – November, 2011)
6.    Decadal premonsoon water level trend map (2002-2011)
7.    Iso Electrical Conductivity Map (May, 2011)
8.    Iso Fluoride Map (May, 2011)
9.    Iso Iron Map (May, 2011)
10.   Map showing distribution of Nitrate (May, 2011)

                                    List of Tables
1.    Salient features of ground water exploration
2.    Annual Rainfall Data (2001-2011)
3.    Land Use Pattern (2010-11)
4.    Area irrigated by different sources (2010-11)
5.    Tehsil wise range of depth to water levels (2011)
6.    Block wise replenishable ground water resources (As on 2009)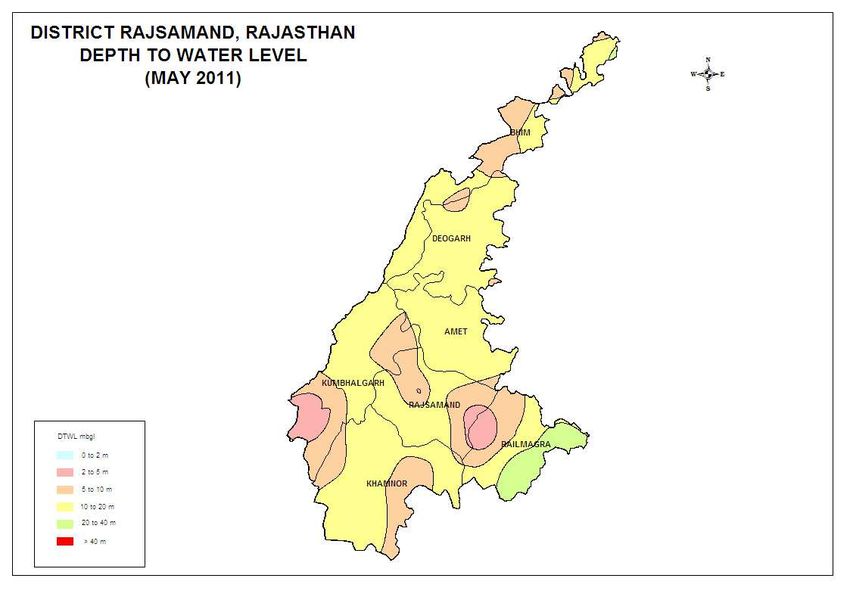
GROUND WATER INFORMATION
                   RAJSAMAND DISTRICT
1.0     Introduction
Rajsamand district is located in the southern part of Rajasthan State and extends
between north latitudes 24°46’32” and 26°1’36” and east longitudes 73° 28’30” and
74°18’55”. Covering an area of 4522.26 sq km, it occupies 1.39% of the total area of
the state. It is bounded in the south and southwest by Udaipur district, in the east
and southeast by Bhilwara and Chittorgarh district, in the north by Ajmer district and
in the west by Pali district. The district is divided into 7 Tehsils and 7 blocks. As per
2011 Census data the population of the district is 1156597. The rural and urban
population is 972777 and 183820 respectively with a density of 248 persons per sq
km. Administrative map of the district is presented in Figure 1.

                     Figure 1: Map showing Administrative Divisions
Systematic hydrogeological survey and other investigations were carried out in the
district by the Geological Survey of India till 1972 and later by Central Ground Water
Board during 1972 to 1985. Reappraisal hydrogeological surveys have been carried
out in the district by Central Ground Water Board between F.S.P. 1986-87 and 1987-
88. Monitoring of water level is being carried out four times a year from 30 National
Hydrograph Network Stations. Under ground water exploration programme, 48
exploratory boreholes and 2 observation wells and 7 piezometers have been drilled
in the district in order to delineate potential aquifer zones and ascertain aquifer
characteristics. Salient features of ground water exploration in the district are given
in Table 1.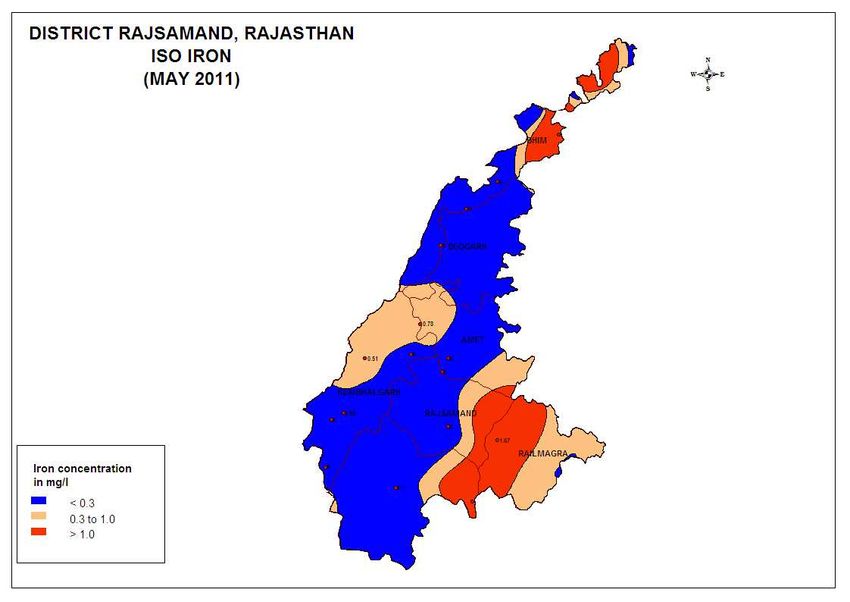
Table 1: Salient features of ground water exploration
 Type       No.         Depth        drilled SWL (m)                   Transmissivity       Discharge        EC
 of well                (m)                                            (m2/day)             (lpm)            (micromhos/c
                                                                                                             m) at 25oC
 EW         48          8 - 203                  1 - 39.3              985 – 7944           10 – 1110        300 – 3440
 OW         2           160 – 194.6              5.22 - 15                                                   1485
 PZ         7           87 - 199                 2.3 – 21                                                    580 - 1450

 2.0        Rainfall & Climate
 The district experiences arid to semi-arid type of climate. Normal rainfall (1951-2000)
 of the district is 554.5 mm whereas average annual rainfall (2001-2011) has been
 lower than average annual rainfall and placed at 524.37 mm. Almost 93% of the total
 annual rainfall is received during the southwest monsoon which enters the district in
 the third or fourth week of June and withdraws in the mid of September. Rainfall
 data of the district during the period 2001 - 2011 is presented in Table 2. The highest
 average annual rainfall has been 836.09 mm at Kumbhalgarh, which lies near the
 southwestern boundary of the district. The lowest average annual rainfall 439.67 mm
 has been received at Rajsamand, which lies in the central part of the district. Drought
 analysis based on agriculture criteria indicates that the district is prone to mild and
 normal type of droughts. Occurrence of severe and very severe type of drought is
 very rare.
 Table 2: Annual Rainfall Data (2001-2011)
Station         2001     2002     2003    2004    2005       2006    2007    2008    2009   2010    2011    Average
Nathdwara       815.0    339.0 403.0      441.0 1004.0       774.0   591.0   345.0   595.0 955.0    783.0    640.45
Railmagra       533.0    249.0 519.0      603.0 889.0        915.0   636.0   478.0   471.0 703.0    872.0    624.36
Amet            691.0    264.0 423.0      436.0 564.0        789.0   700.0   492.0   336.0 650.0    669.0    546.73
Bharai          492.0    212.0 387.0      495.0 495.0        889.0   629.0   269.0   470.0 485.0    665.0    498.91
Bhim            774.0    286.0 416.0      463.0 656.0        623.0   452.0   378.0   377.0 702.0    746.     533.91
Chikalwas                         461.0   415.0 452.0        608.0   438.0   324.0   392.0 712.0    699.0    500.11
Deogarh         280.0    259.0 485.0      530.0 680.0        788.0   509.0   493.0   321.0 752.0    765.0    532.91
Kumbhalgarh     1266.0 669.0 1464.0       373.0 822.0        926.0   788.0   502.0   401.0 1077.0   909.0    836.09
Nand samand     639.0    283.0 376.0      326.0 673.0        703.0   460.0   227.0   451.0 538.0    521.0    472.45
Rajsamand       636.0    364.0 483.0      462.0 805.0        730.0   637.0   423.0   447.0 1039.0   522.0    595.27
Rajsammand                        345.0   307.0 640.5        636.0   526.0   177.5   296.0 477.0    552.0    439.67

 The winter season sets in after about the middle of November, when both day and
 night temperatures begin to drop steadily up to the month of January. January is the
 coldest month with mean daily minimum temperature of 7.8ºC. The day and night
 temperatures rise rapidly from February to May. May is the hottest month of the year
 with mean daily maximum temperature of 38.6ºC.
 When the southwest monsoon arrives in the district both day and night temperatures
 start decreasing appreciably. After the withdrawal of southwest monsoon there is a
 slight increase in day temperatures and a secondary maximum is obtained in the
 month of October. The night temperature, however, continues to fall gradually. The
 day temperature also starts falling in November.

                                                               2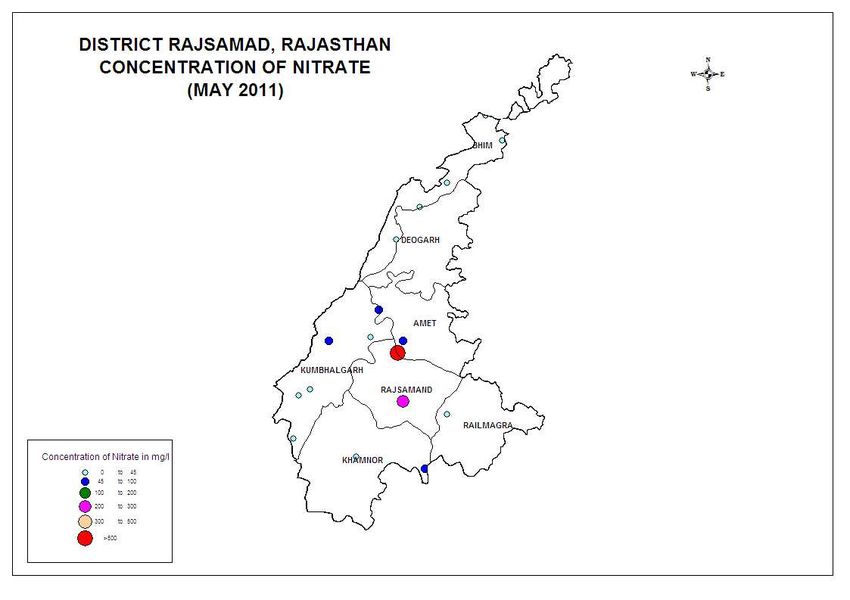
The relative humidity is generally low except during southwest monsoon season. The
highest relative humidity (81%) is recorded in the month of April. The summer
season is the driest part of the year. Winds are generally light with some
strengthening in the later half of summer and southwest monsoon season. During
the period from May to September, winds blow from directions between south and
west. In the post monsoon season, the winds are predominantly from direction
between northwest and northeast. The potential evapotranspiration is highest in the
month of May and lowest in December. Evapotranspiration is more than rainfall in all
the months except in July and August.

3.0     Geomorphology & Drainage
Rajsamand district consists of monotonously rolling topography intersected by
shallow valleys. Towards the western part of the district, Aravalli hills, a series of
ridges run diagonally in the direction of NE and SW. The highest portion of Aravallis
occurs south of Kailwara near Kumbhalgarh fort with an altitude of 1293 m amsl. A
typical gneissic plain bearing irregularly carved off gneisses and granites without any
alluvial cover is observed to the highest altitude of above 600 m amsl. The central
and eastern parts of the district are relatively plain forming the foot hill part of Aravalli
ranges. This plain gently slopes towards the east and northeast. In the higher and
more rugged part towards the western side, alluvium is scanty whereas in the
eastern flank, the alluvium is more continuous and reasonably thick.
Geomorpholgically, there are Intermontane plateaus, structural hills, pediment,
buried pediment, aggradational plains, denudational plains, valley fills, flood plains
etc. Geomorphological units show linearity specially the structural hills which are
aligned in the direction of Arravallis (NE-SW).
Rajsamand district is drained by Banas river and its tributaries i.e. Khari,
Chandrabhaga, Gomati, Kothari, Ahar etc. The river as well as tributaries are
ephemeral and flow only in response to heavy precipitation. The predominant
drainage pattern in the western hill ranges is rectangular to sub-rectangular and it is
dendritic to sub-dendritic in rest of the area. Drainage pattern in the western hill
region is controlled by fractures and joints and in the rest of the area by subsurface
lineaments. The area has some lakes and tanks also. The famous Rajsamand lake
is situated near the district head quarters Rajsamand and is the main source of
supply of drinking water to Rajsamand city. There are small check dams and tanks
constructed on the rivers and streams of the district which augument the natural
recharge of ground water in the area.

4.0     Soil, Land Use & Irrigation Practices
The soils of the district are mainly lithosols in the western part on slope and some
inceptisols as per topography. Texturally it varies from sandy loam in Bhim, Deogarh
& Amet blocks to heavy clay in Kumbhalgerh block. The types of soil occurring in the
district are classified as follows:
Type of Soil                  Name of block
Sandy loam                   Bhim, Deogarh, Amet
Clay loam                    Rajsamand, Railmagra, Khamnor
Heavy clay                   Kumbhalgarh.

                                             3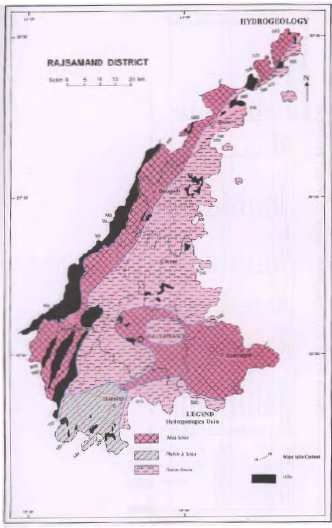
4.1     Land-use pattern
 The socio cultural and economic factors have significant influence over land use,
 both in rural and urban areas. Land forms, relief of land forms, slope, nature of soils
 and natural resources are some of the important factors which control the land use
 pattern of the district. Out of the total area of 452726 hectares, approximately
 145629 hectares land is cultivable land and there was 94697 (20.9% of total
 geographical area) actual cultivated land during 2010-11. The land use pattern of the
 district as on 2010-11 is given in Table 3. The most of the farmers have small and
 marginal land holdings.
 Table 3: Land Use Pattern (2010-11)
Geographical Area        452726 Hectors
Forest                   25952 Hectors (5.73% of total geographic area.)
Non Agriculture Land     183276 Hectors (40.48%)
Fallow Land              100285 Hectors(22.15%)
Dupaj Land               50932 Hectors(11.25 %)
Actual Cultivated Area   94697 Hectors ( 20.91% )
Total Cultivated Area    145629 Hectors (32.16%)
Total Irrigated Area     49068 Hectors (10.83%)

 4.2     Irrigation
 The principal means of irrigation in the district are wells though the small area is
 irrigated by tanks also. Ground water plays an important role for irrigation and is
 utilized through dug wells, dug cum bored wells and tube wells. The details of the net
 and gross irrigated area by different sources are given in Table 4.
 Table 4: Area irrigated by different sources (2010-11)
 Source             Net area irrigated (ha)            Gross area irrigated (ha)
 Tanks                             4606                              4666
 Tubewells                         895                               1243
 Other wells                      38549                             43156
 Other sources                      3                                  3
 Total                            44053                             49068

 5.0     Geological Framework
 The oldest formations exposed in the area belongs to Bhilwara super group of
 Archaean age. The northern, central and western parts of the district are occupied by
 the younger formations of Aravalli super group and Delhi super group of Proterozoic
 age. Quaternary and recent alluvium overlies most of the formations in isolated
 pockets, along river courses and in shallow depressions.

 6.0     Ground Water Scenario
 6.1     Hydrogeology
 Occurrence of ground water in the district is mainly controlled by the topographic and
 structural features present in geological formations. Ground water occurs mainly
 under water table conditions in all formations. Important water bearing formations
 besides alluvium are gneisses, granites, schists, phyllites and limestone. In hard rock

                                              4
formations, occurrence and movement of ground water is governed by
foliation/bedding planes, fractures, joints solution cavities and other structurally weak
planes. Weathered mantle of hard rocks yields good discharge of water. In alluvium,
ground water occurs in interstices of unconsolidated sand and gravel. Locally semi
confined conditions are encountered in both hard rock and alluvium. Hydrogeological
map of the district is presented in Figure 2. Water bearing properties of
different aquifers in the district are described below.

                            Figure 2: Hydrogeological Map
6.1.1 Ground water in Bhilwara Super Group
The eastern part of the district is underlain by the rocks of Bhilwara super group
comprised of schists, gneisses and migmatites with intrusive granites. Ground water
in these rocks occurs under water table conditions in weathered and fractured zones

                                           5
and along joints and foliation planes. Schists intermixed with gneisses form better
aquifer. At places, granites and gneisses form fairly good aquifer. Intrusive contacts
are found to be good channels for ground water circulation. Yield of wells varies from
10000 to 150000 litres per day (lpd). The rate of recuperation in wells is slow in
gneisses and schists as compared to that in granites.
6.1.2 Ground water in Aravalli Super Group
Rocks belonging to Aravalli super group are located in south central part of the
district and comprise mainly of phyllite, schist, quartzite, conglomerate, dolomite,
marble etc. Phyllite, quartzite and dolomite form important aquifer. Quartzite
generally occurs intercalated with phyllite and slate and is well jointed. Yield of wells
in these rocks varies from 15000 to 150000 lpd. However, average yield is around
40000 lpd. In dolomite and limestone, yield of wells varies from 20000 to 200000 lpd
with an average yield of 92000 lpd.
6.1.3 Ground water in Delhi Super Group
The formations belonging to Gogunda and Kumbhalgarh groups of Delhi super group
are exposed in the western part of the district along a NW- SE trending belt. Lower
Gogunda group constitutes mainly quartzite and schist and the upper Kumbhalgarh
group consists mainly of schist, gneiss, marble and quartzite. Yield of wells in
quartzite varies from 16000 and 96000 lpd. Yield of wells tapping biotite schist and
hornblende schist varies from 12000 to 250000 lpd. In calc schist and calc gneiss,
yield of wells varies between 10000 and 100 lpd.
6.1.4 Ground water in alluvial valley fills
Alluvial deposits of Recent origin occur in narrow discontinuous bands along the
channels of Banas, Khari and other rivers in the form of valley fills. They are
composed of stream laid sand and gravel and occasionally silt, clay and kankar.
Besides these, blown sand occurs in localized patches. Thickness of alluvium has
been found to vary from thin veneer near outcrops to 19m in the south of Bamania
Kalan. The bed rock is overlain by a boulder gravel bed varying in thickness from 2
to 6 m. Ground water in boulder and gravel beds occurs under confined conditions.
Saturated thickness of alluvium has been found to vary between 3 and 12 m.
6.2 Ground water levels
6.2.1 Depth to water levels
During pre-monsoon period (May, 2011), the depth to water level was recorded
between 2.25 mbgl in Railmagra block and 18.04 mbgl in Kumbhalgarh block. More
than 55 % of the wells monitored have registered depth to water level between 10
and 20 mbgl. Shallow water levels in the range of 2 to 5 m have been observed in
isolated pockets in Kumbhalgarh, Rajsamand and Railmagra blocks (Figure 3).
During post-monsoon period (November, 2011), the depth to water level varied from
0.7 mbgl in Railmagra block to 15.95 mbgl in Kumbhalgarh block. About 83% of the
wells monitored have registered water levels in the range of 0 to 10 mbgl. Depth to
water level in the range of 10 to 20 mbgl has been recorded in parts of Rajsamand,
Kumbhalgarh, Khamnor and Railmagra blocks (Figure 4). Tehsil wise minimum and
maximum depth to water levels during pre- and post-monsoon periods are given in
Table 4.
6Figure 3: Depth to water level map (May, 2011)
Figure 4: Depth to water level map (November, 2011)
7Table 4: Tehsil wise range of depth to water levels (2011)
Tehsil Pre-monsoon depth to water level Post-monsoon depth to water level
(mbgl) (mbgl)
Minimum Maximum Minimum Maximum
Amet 10.08 26.15 3.15 9.75
Bhim 5.90 14.65 2.02 6.89
Kumbhalgarh 3.24 18.04 1.81 15.95
Khamnor - - 2.39 6.30
Railmagra 2.25 13.49 0.7 9.95
Rajsamand 4.91 13.73 3.44 15.02
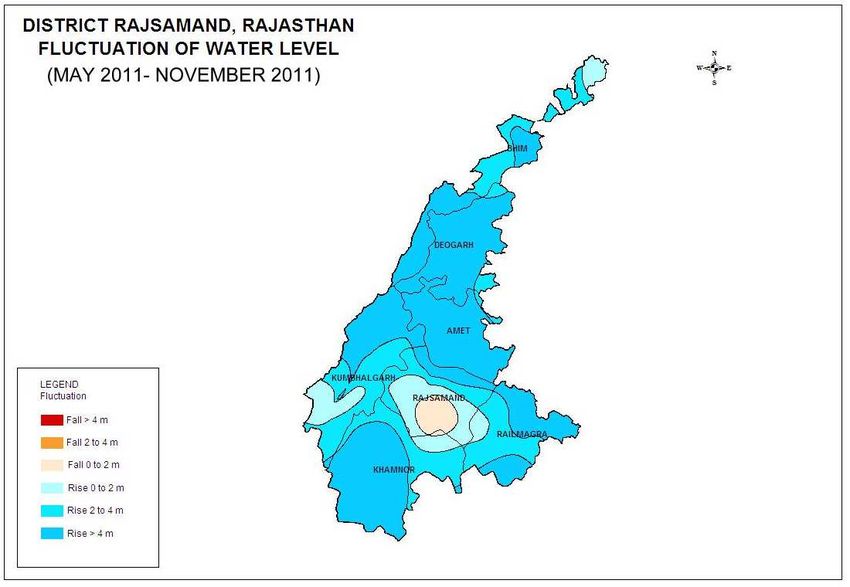
6.2.2 Seasonal fluctuation
Analysis of depth to water level data of Pre- and Post-monsoon periods (may and
November, 2011) indicates that out of 26 wells analysed, only 1 well in Rajsamand
block has registered decline of 1.29 m. All the remaining wells have registered rise in
water levels with extent of rise varying from 1.27 to 12.56 m. More than 50 % of the
wells analysed have registered rise of more than 4 m in water levels (Figure 5).
Figure 5: Seasonal water level fluctuation map (May-November, 2011)
6.2.3 Long term trend of water levels
Analysis of decadal pre-monsoon water level data indicates that major part of the
district has witnessed rising trend in water levels of upto 25 cm/year. Declining trend
of upto 25 cm/year has been recorded in the northern part of the district in Bhim and
Deogarh blocks and isolated pockets in Kumbhalgarh, Khamnor, Rajsamand and
Railmagra blocks (Figure 6).
8Figure 6: Decadal pre-monsoon water level trend map (May 2002 – 2011)
6.3 Chemical quality of ground water
The quality of ground water is potable in major part of the district. However,
presence of excess fluoride, nitrate, iron and electrical conductivity in ground water
has been reported from some pockets in the district.
The electrical conductivity (EC) in ground water varies from 1120 µS/cm at 25°C at
Barar, Bhim block to 5920 µS/cm at 25°C at Nadiawala, Rajsamand block. In most
parts of the district, EC has been found to be within 3000 µS/cm at 25°C. However,
in Rajsamand and Amet blocks, EC above 3000 µS/cm at 25°C has been reported
(Figure 7).
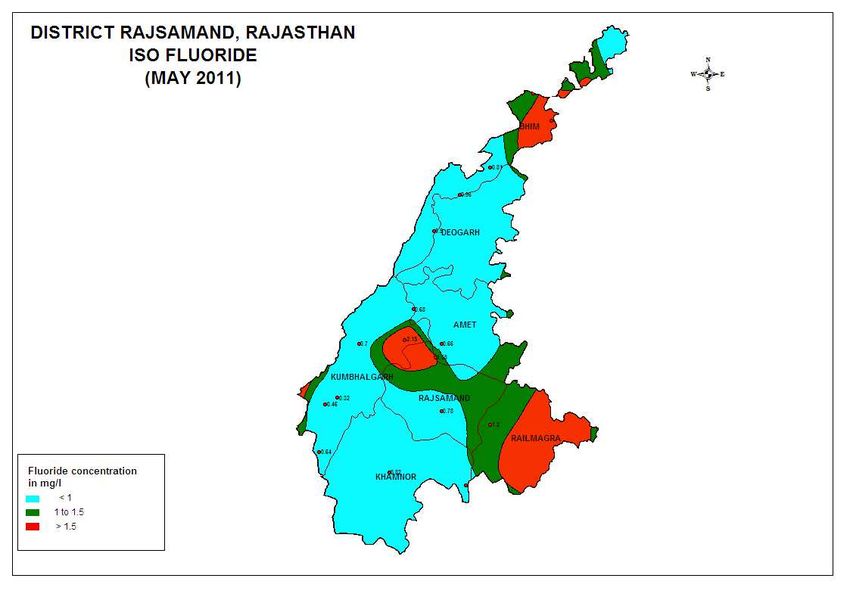
Fluoride content in ground water varies from 0.5 mg/l at Baghana to 3.8 mg/l at
Ghata in Bhim block. Fluoride content in ground water is within the maximum
permissible limit of 1.5 mg/l (as prescribed by BIS) in major part of the district.
Excess fluoride in ground water has been reported from parts of Rajsamand,
Railmagra, Kumbhalgarh and Bhim blocks (Figure 8).
Iron content in ground water is generally within the maximum permissible limit of 1
mg/l. Excess iron content has been reported from Railmagra and Bhim blocks
(Figure 9). Maximum concentration of 4.89 mg/l has been reported from Ghata in
Bhim block.
Nitrate concentration in ground water varies widely from 2.8 mg/l at Baghana, Bhim
block to 500 mg/l at Nadiawala, Rajsamand block. Nitrate content in excess of
maximum permissible limit of 45 mg.l has been observed in parts of Amet,
Kumbhalgarh and Rajsamand blocks (Figure 10).
9Figure 7: Iso electrical conductivity map (May, 2011)
Figure 8: Iso fluoride map (May, 2011)
10Figure 9: Iso iron map (May, 2011)
Figure 10: Map showing distribution of Nitrate (May, 2011)
117.0 Ground Water Resources
Ground water resources of the district have been estimated jointly by CGWB and
State Ground Water Department as per the norms recommended by GEC’ 97. While
assessing the ground water resources, saline and hilly areas have not been
considered. Annually replenishable ground water resources of the district have been
estimated to be 103.6106 MCM. Net annual ground water availability in the district is
estimated as 93.2495 MCM. Annual ground water withdrawal for all uses is 118.1735
MCM and overall stage of ground water development is 126.734%. Summarised
block wise estimate of dynamic ground water resources is given in Table 6.
The dynamic ground water resource estimation (2009) indicates 126.73%
percentage of ground water development and all the 7 blocks are under over
exploited category. But during this period due to the extensive measures taken for
increasing the natural recharge of ground water a no. of hydrograph stations show
rising trend but still some area has shown declining trend of ground water levels in
the district due to increase in the pace of ground water development. There is
increase in the net irrigated areas in the district by different sources that is also
reflected in the trend of water level of the district.
Table 6: Block wise replenishable ground water resources (As on 2009)
Block Annually Net annual Annual Annual Gross Stage of Category
replenishable ground ground ground annual ground
ground water water water water ground water
resource availability draft for draft for water develop-
(MCM) (MCM) irrigation domestic draft ment
(MCM) & (MCM) (%)
industrial
use
(MCM)
Amet 13.0539 11.7485 13.1022 1.9728 15.0750 128.31 OE
Bhim 12.1457 10.9311 13.9956 1.0862 15.0818 137.97 OE
Deogarh 12.3505 11.1154 11.7042 0.6986 12.4028 111.58 OE
Khamnor 19.0327 17.1294 18.7005 2.8616 21.5621 125.88 OE
Kumbhalgarh 22.3782 20.1404 19.3428 1.3585 20.7013 102.79 OE
Railmagra 14.5402 13.0862 17.5206 1.3414 18.8620 144.14 OE
Rajsamand 10.1094 9.0985 11.6868 2.8017 14.4885 159.24 OE
District 103.6106 93.2495 106.0527 12.1208 118.1735 126.73
7.1 Status of ground water development
Rainfall in the district is the main source of ground water recharge. Due to less
rainfall and increased ground water withdrawals, ground water levels are declining in
some parts of the district particularly in the northern part. Increasing urbanization and
change in lifestyle have led to increased demand of water. Increasing urbanization
also leads to reduced recharge. Further ground water is also an important source for
irrigation in the district. The stage of ground water development for the district as a
whole has reached around 127% as on 31.03.2009. All the blocks in the district are
over-exploited. There is practically no scope left for further ground water
development in the district.
128.0 Ground Water Related Issues & Problems
All the blocks in the district are over-exploited, where stage of ground water
development has exceeded 100 % leaving no further scope for ground water
development. These blocks require judicious development of ground water. Quality
of ground water is generally potable, except for a few pockets, where high Electrical
Conductivity, Fluoride, Nitrate and Iron have been reported.
9.0 Ground Water Management Strategy
Due to pressure of population and improvement in the standard of living, the demand
of fresh water for both agriculture and domestic use has substantially increased. This
has led to a sharp increase in ground water withdrawal. The top layer of fresh ground
water is also reducing every year. Artificial recharge serves as a means for restoring
the depleted ground water storage, slow down the quality deterioration and put back
into operation many ground water abstraction structures.
9.1 Ground water development
Stage of ground water development in all the blocks in the district has exceeded
100%, which indicates that the scope of ground water development is already
exhausted and the blocks have been categorized as “Over-exploited”. There is no
scope for further development of ground water for irrigation or industrial use.
However, exploratory drilling can be taken up in unexplored area for estimation of
aquifer parameters. There is need to control and regulate ground water development
in the entire district.
9.2 Water conservation and artificial recharge
Precious ground water resources have to be conserved for sustainable availability.
There is need to reduce/ avoid wastage of water in various uses. Ground water
should be used judiciously taking into account modern agriculture water
management techniques by cultivating crops needing less watering and use of
sprinkler system & drip irrigation should be encouraged.
It is recommended that increasing number of ground water structures should not be
encouraged and artificial ground water recharge schemes like check dams, bunds,
anicuts etc., should be constructed at appropriate hydrogeological locations. Surface
water reservoirs like ponds/ tanks etc. should be constructed, which would serve
dual purpose of supply of water during lean period and recharge to the ground water
body. Also watershed development projects and soil conservation projects should be
encouraged.
10.0 Recommendations
• Large diameter (5-8 m) dug wells should be constructed in hard rock
area with sufficient depth 30-40 mbgl so as to have good storage during
pumping and also during the lean period. Horizontal drilling can be done
to tap the lateral fractures for enhancing the yield of the wells in hard rock areas.
• Ground water should be used judiciously taking into account modern agriculture
water management techniques by cultivating crops that need less watering.
• Use of sprinkler system & drip irrigation should be encouraged.
13• Small farmers in the area should be encouraged to use common ground water
structures for optimum use of ground water resources for irrigation purposes.
• Cultivators should also be made aware and encouraged to adopt suitable
cropping pattern using modern techniques by extension services for getting
maximum agriculture production through minimum withdrawal.
• Suitable artificial recharge structures like subsurface barriers across the river
beds should be constructed so that the ground water runoff can be arrested and
impounded in the subsurface reservoir for meeting various sectoral demands.
• There is need for regulation of ground water development in overexploited areas.
• Awareness about the consequences in the near future of the over-exploitation of
ground water resources and need and ways of judicious use of water and rain
water harvesting and artificial recharge needs to be created among the users.
• The quality of ground water in most part of the district is good for
irrigation and domestic/ drinking purpose except at few places where nitrate and
iron problems need to be tackled by the concerned state agencies by tapping
alternate sources of water supply.
14You can also read