H1 2020 RESULTS PRESENTATION - SEPTEMBER 2020 - Amazon AWS
←
→
Page content transcription
If your browser does not render page correctly, please read the page content below
H1 2020
  RESULTS
PRESENTATION
SEPTEMBER 2020
DISCLAIMER

The information contained in this confidential document (“Presentation”) has been prepared by Central Asia Metals plc (the “Company”). It has not been fully verified and is subject to material
updating, revision and further amendment. This Presentation has not been approved by an authorised person in accordance with Section 21 of the Financial Services and Markets Act 2000 and
therefore it is being delivered for information purposes only. Any person who receives this Presentation should not rely or act upon it. This Presentation is not to be disclosed to any other person or
used for any purpose.
While the information contained herein has been prepared in good faith, neither the Company nor any of its shareholders, directors, officers, agents, employees or advisers give, have given or have
authority to give, any representations or warranties (express or implied) as to, or in relation to, the accuracy, reliability or completeness of the information in this Presentation, or any revision
thereof, or of any other written or oral information made or to be made available to any interested party or its advisers (all such information being referred to as “Information”) and liability therefore
is expressly disclaimed. Accordingly, neither the Company nor any of its shareholders, directors, officers, agents, employees or advisers take any responsibility for, or will accept any liability whether
direct or indirect, express or implied, contractual, tortious, statutory or otherwise, in respect of, the accuracy or completeness of the Information or for any of the opinions contained herein or for any
errors, omissions or misstatements or for any loss, howsoever arising, from the use of this Presentation.
This Presentation may contain forward-looking statements that involve substantial risks and uncertainties, and actual results and developments may differ materially from those expressed or implied
by these statements. These forward-looking statements are statements regarding the Company's intentions, beliefs or current expectations concerning, among other things, the Company's results of
operations, financial condition, prospects, growth, strategies and the industry in which the Company operates. By their nature, forward-looking statements involve risks and uncertainties because they
relate to events and depend on circumstances that may or may not occur in the future. These forward-looking statements speak only as of the date of this Presentation and the Company does not
undertake any obligation to publicly release any revisions to these forward-looking statements to reflect events or circumstances after the date of this Presentation.
Neither the issue of this Presentation nor any part of its contents is to be taken as any form of commitment on the part of the Company to proceed with any transaction and the right is reserved to
terminate any discussions or negotiations with any prospective investors. In no circumstances will the Company be responsible for any costs, losses or expenses incurred in connection with any
appraisal or investigation of the Company. In furnishing this Presentation, the Company does not undertake or agree to any obligation to provide the recipient with access to any additional information
or to update this Presentation or to correct any inaccuracies in, or omissions from, this Presentation which may become apparent.
This Presentation should not be considered as the giving of investment advice by the Company or any of its shareholders, directors, officers, agents, employees or advisers. In particular, this
Presentation does not constitute an offer or invitation to subscribe for or purchase any securities and neither this Presentation nor anything contained herein shall form the basis of any contract or
commitment whatsoever. Each party to whom this Presentation is made available must make its own independent assessment of the Company after making such investigations and taking such advice
as may be deemed necessary. In particular, any estimates or projections or opinions contained herein necessarily involve significant elements of subjective judgment, analysis and assumptions and
each recipient should satisfy itself in relation to such matters.
The Company's principal activity is the exploration and mining of precious and base metals in Kazakhstan and North Macedonia. You should be aware of the risks associated with this type of investment
and that in emerging markets such as Kazakhstan and North Macedonia, the risks are far greater than in more developed markets (including significant legal, economic and political risks) and that the
Company could potentially lose the benefit of its assets in Kazakhstan and North Macedonia. You acknowledge the high number of expenses and difficulties frequently encountered by companies in the
early stages of development, particularly companies operating in emerging markets and you should be aware that this may lead to the loss of your entire investment.
Neither this Presentation nor any copy of it may be (a) taken or transmitted into any country, its territories or possessions (each a “Restricted Territory”), where it may be in breach of the laws and
regulations of that country; or (b) given to any individual who is a citizen or resident of a Restricted Territory where it may be in breach of the laws and regulations of that country. The distribution of
this document in or to persons subject to other jurisdictions may be restricted by law, and persons into whose possession this document comes should inform themselves about, and observe, any such
restrictions. Any failure to comply with these restrictions may constitute a violation of the laws of the relevant jurisdiction.
September 2020

Central Asia Metals PLC                                                                                                                                                                                    1
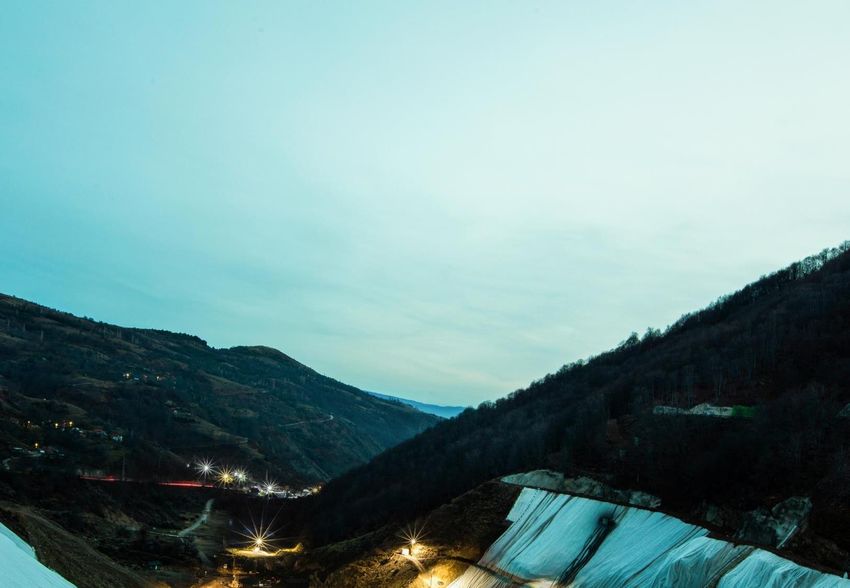
TSF4 INCIDENT

TSF4 leakage 14 September 2020
-   Short term leakage of tailings into the local river

-   Leakage stopped soon after (c.1.5hrs)

-   No one harmed in incident

-   Situation under control

-   All relevant North Macedonian authorities
    informed

-   Investigation underway to ascertain volume of
    material and cause

-   Sasa processing plant not currently operational

-   Mine remains operational, with stockpiling
    underway

-   Plans in place to repair and secure the facility so
    that safe operations can recommence as soon as
    possible

Central Asia Metals PLC                                   2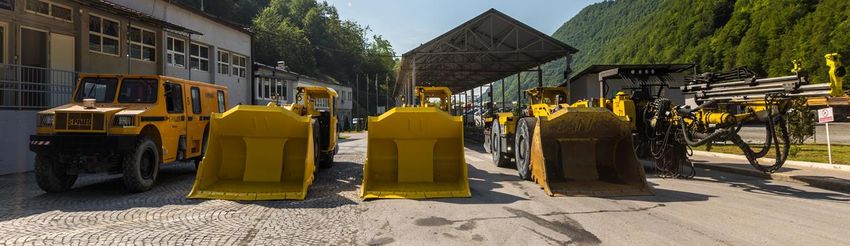
H1 2020 HIGHLIGHTS

                                                         H1 2020 revenue    H1 2020 EBITDA
Strong performance in challenging conditions
- Solid H1 2020 production
                                                         $75.4m             $42.5m
                                                         H1 2019: $89.9m    H1 2019: $56.7m
- Interim dividend decision deferred due to TSF4
- Strong EBITDA margin and cash generation in context
  of global conditions                                   H1 2020 net debt   H1 2020 gross debt
  - EBITDA $42.5m (H1 2019: $56.7m)
  - EBITDA margin 56% (H1 2019: 63%)                     $58.8m             $99.0m
  - Free cash flow $21.1m (H1 2019: $35.5m)              H1 2019: $80.2m    2019: $108.8m
  - Demonstrates fundamental strength of CAML business
- Deleveraging rapidly                                   H1 2020 LTIFR      Cu production
  - H1 2020 debt repayments, $19.2m (H1 2019: $19.2m)
  - 30 June 2020 net debt, $58.8m (Dec 2019: $80.2m)
  - 30 June 2020 cash, $44.0m - inc. $10m overdraft
                                                         0.00               6,607t
    (Dec 2019: $32.6m)                                   H1 2019: 0.89      H1 2019: 6,594t
- Looking after our employees
  - Firm on-site response to COVID-19                    Zn production      Pb production

                                                         12,203t            15,140t
  - H1 2020, zero LTIs
- Life of Mine study concluded, transition to cut and
  fill to commence in the near term                      H1 2019: 11,517t   H1 2019: 14,357t

Central Asia Metals PLC                                                                        3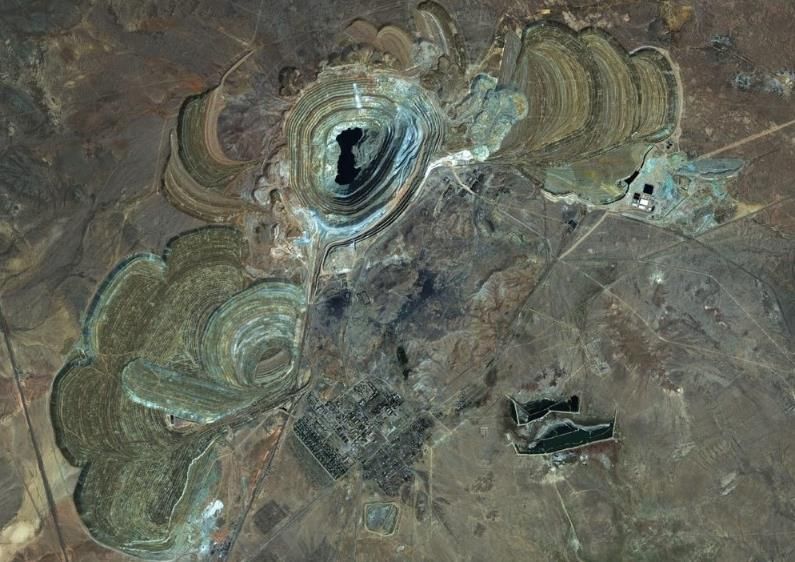
Financial results
H1 2020 MARKET CONDITIONS

COVID-19 pandemic                                                                  7000

- COVID-19 lockdowns impacted all major economies
- Uncertainty remains, however strong potential for V-shaped
  recovery supported by unprecedented stimulus packages                            6000

Copper                                                                                                                            Copper down
                                                                                                                                    2% YTD
- Copper benefited from Q2 China economic recovery                                 5000

                                                               Metal price ($/t)
- 2020 broker consensus price (August), $5,732/t

Zinc                                                                               4000

- High Chinese smelter utilisation coupled with mine supply
  disruptions lead to c.50% reduction in spot TCs in Q2
                                                                                                                                    Zinc down
- 2020 broker consensus price (August), $2,050/t                                   3000                                              10% YTD

Lead
- Weak auto sales coupled with rapid secondary supply                              2000
  recovery capped lead price                                                                                                        Lead down
- 2020 broker consensus price (August), $1,768/t                                                                                      6% YTD

                                                                                   1000
Currencies                                                                                              1 January to 30 June

- Kazakh Tenge (KZT) to US Dollar averaged 404 in H1 2020                                 Copper 2020       Zinc 2020          Lead 2020
- North Macedonian Denar (MKD) pegged to Euro                                             Copper 2019       Zinc 2019          Lead 2019
- US Dollar strong against all major currencies

Central Asia Metals PLC                                                                                                                         5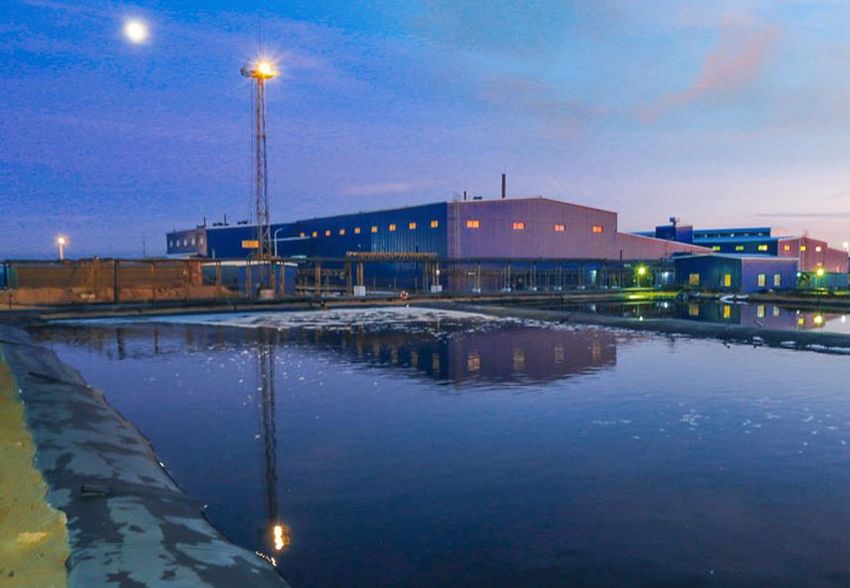
H1 2020 INCOME STATEMENT

EBITDA margin 56%                                               Highlights               H1 2020   H1 2019   % change
- Gross revenue and EBITDA lower due to weak
  commodity prices and higher treatment charges                Gross revenue, $m          75.4      89.9       -16%

- Strong EBITDA margin given global conditions                 Selling & distribution,
                                                                                           1.2       0.9      +33%
- Increased S&D due to lead sales to China                     $m

Kounrad                                                        Cost of sales, $m          34.7      36.0       -4%
- Gross revenue $37.0m (H1 2019: $39.9m)
                                                               Admin expenses, $m          7.1       7.3       -3%
  - Reflects higher sales volumes with reduced copper price
- EBITDA $27.1m (H1 2019: $28.7m)
                                                               Profit before tax, $m      24.3      35.5       -32%
  - EBITDA margin increased to 73% (H1 2019: 72%) due to
    lower costs
                                                               EBITDA, $m                 42.5      56.7       -25%
Sasa
                                                               EBITDA margin               56%       63%       -7%
- Gross revenue $38.4m (H1 2019: $49.9m)
  - Reflects higher sales volumes with reduced zinc and lead   EPS from cont. ops, c      10.35     15.42      -33%
    prices and higher treatment charges
- EBITDA $19.5m (H1 2019: $31.7m)
  - EBITDA margin 51% (H1 2019: 63%)

Central Asia Metals PLC                                                                                                 6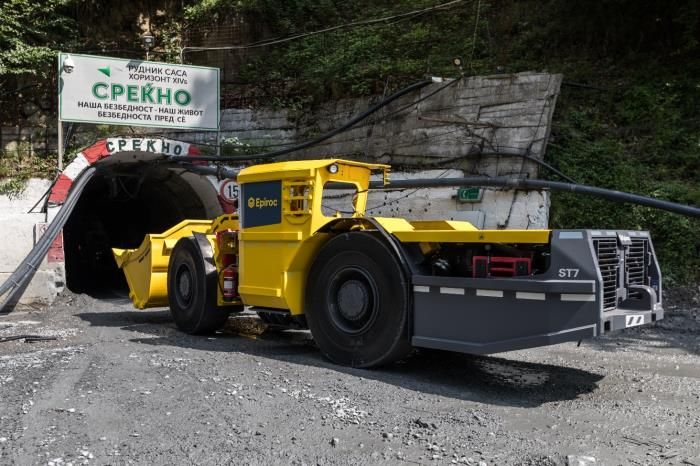
EBITDA H1 2020 VS H1 2019

                            42.5

Central Asia Metals PLC            7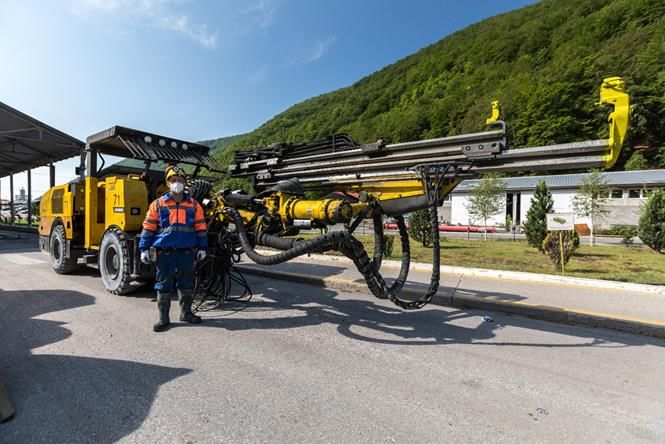
H1 2020 KOUNRAD C1 COPPER CASH COST

H1 2020 C1 cash cost $0.48/lb                  (H1 2019: $0.51/lb)
                                                                            400                    Wood Mackenzie
                   Local G&A, $0.05
                                                                                                2019 copper cost curve
                                                                            300

                                                                     $/lb
    Realisation, $0.08
                                                                            200                      CAML 103c
                                                                                  Kounrad 48c

                                                                            100

                                                     Processing ,
                                                        $0.35
                                                                             0

                                                                                        1st Q         2nd Q      3rd Q   4th Q   18.5mt

 Cost                           H1 2020 $/lb     H1 2019 $/lb
Reagents                              0.08            0.10

Power                                 0.06            0.06
                                                                        H1 2020 Kounrad EBITDA margin
Payroll                               0.12            0.11

Materials

Consulting & other

Processing total
                                      0.04

                                      0.05

                                      0.35
                                                      0.03

                                                      0.07

                                                     0.37
                                                                                                    73%
Central Asia Metals PLC                                                                                                             8
H1 2020 SASA C1 ZINC EQ. CASH COST

H1 2020 C1 cash cost $0.43/lb                                                          (H1 2019: $0.47/lb)
                                                                                                                                                  H1     H1     H1       H1
                                                                                                                     C1 cash cost                2020   2019   2020     2019
                                                                                              Processing , $0.07
                                                                                                                                                  $m     $m    $/lb     $/lb
           Mining , $0.14
                                                                                                                    Zinc payable production, t                 10,273   9,708

                                                                                                                    Pro-rata costing zinc                       37%     45%

                                                                                                                    Mining                        8.3    8.0    0.14    0.17

                                                                                                                    Processing                    4.1    4.3    0.07    0.09
                                                                                              Realisation , $0.19
                                                                                                                    Local G&A                     2.3    2.5    0.03    0.05
       Local G&A , $0.03

                                                                                                                    Realisation                  11.6    7.6    0.19    0.16

                                                                                                                    Sasa C1 costs                26.3   22.4   0.43     0.47
  Unit costs, Run of Mine (RoM)                                             H1 2020                H1 2019
Mining, $m                                                                        8.3                  8.0

Processing, $m                                                                    4.1                  4.3
                                                                                                                    H1 2020 Sasa EBITDA margin
Local G&A, $m                                                                     2.3                  2.5

Total operating costs, $m*

RoM mine, t

Unit cost, $/t
                                                                                 14.7

                                                                              416,055

                                                                                 35.5
                                                                                                      14.8

                                                                                                    404,450

                                                                                                      36.4
                                                                                                                                             51%
*H1 2019 unit costs updated to included Sasa related costs incurred by other Group entities

Central Asia Metals PLC                                                                                                                                                         9
H1 2020 GROUP C1 CASH COST
Kounrad copper C1 cash cost $0.48/lb H1 2020 H1 2019 % change
- Remains in lowest quartile of industry cash cost curve Kounrad Cu C1 cash
0.48 0.51 -6%
cost, $/lb
- 6% lower HoH due to weaker Tenge and cost control
Sasa Zn eq. C1 cash
- Average C1 cash cost over life of project, $0.55/lb 0.43 0.47 -9%
cost, $/lb
Sasa zinc equivalent C1 cash cost $0.43/lb Cu eq. production, t 14,683 15,072 -3%
- Approx. 25th percentile of zinc industry cost curve CAML Cu eq. C1 cash
1.03 0.90 +14%
cost, $/lb
- 9% lower HoH despite increase in TCs due to higher
zinc production and lower pro-rata zinc costs
CAML Group Cu eq. C1 cash cost $1.03/lb
- 14% higher HoH due to
- lower Cu eq. production units as a result of lower zinc and
lead revenue
- increased zinc TCs and selling costs
- Group average cost in lowest industry quartile
Central Asia Metals PLC 10H1 2020 FULLY INCLUSIVE CU EQ. UNIT COST
CAML Group fully inclusive cost, $1.46/lb H1 2020 H1 2019
% change
($/lb) ($/lb)
- Overall increase of $0.02/lb HoH
C1 cash cost 1.03 0.90 +14%
- Increase in C1 copper equivalent cash cost
- Lower concession tax and MET due to reduced commodity Capital expenditure 0.13 0.14 -7%
prices
Concession fees 0.03 0.04 -25%
- Lower capital expenditure
- Lower loan interest due to reducing loan balance and MET 0.06 0.07 -14%
reduction in interest rate
Loan interest 0.11 0.19 -42%
Corporate overheads 0.10 0.10 -
Fully inclusive cost 1.46 1.44 +1%
Central Asia Metals PLC 11H1 2020 CAPEX
H1 2020 Group capex $4.3m (H1 2019: $4.4m) 4.0
- Exercise undertaken to identify potential savings
3.0
Sasa capex, includes
$m
2.0
- Underground fleet: 3.7
- $1.4m (net of $0.3m trade-in), 3 loaders and 1 boomer
drill rig 1.0
- H2 2020 capex to include second boomer and truck $0.7m
0.6
(net of $0.1m trade-in)
-
- Underground development $1.3m Kounrad Sasa
- Mining equipment $0.7m
- Processing equipment $0.2m
Kounrad capex, includes
- SX-EW anodes $0.4m
FY2020E capex guidance
- Reduced from $12-14m, to $9-11m
Central Asia Metals PLC 1230 JUNE 2020 BALANCE SHEET
Net debt $58.8m (2019: $80.2m) 30 Jun 2020, $m 31 Dec 2019, $m
PPE 397.8 406.4
- Group cash balance, $44.0m
Intangible assets 57.0 58.7
- Group gross debt, $99.0m (2019: $108.8m)
Cash 40.3 28.6
- $89.0m Traxys corporate debt
Restricted cash 3.7 4.0
- c.$10.0m North Macedonian overdraft facilities, to provide
Other assets 18.4 17.4
additional financial flexibility during COVID-19 uncertainty
Total assets 517.2 515.1
- H1 2020 debt repayments of $19.2m
Borrowings 99.0 108.8
- Debt interest reduction from 4.75% +LIBOR to 4.00%
Silver stream commitment 21.8 22.9
+LIBOR wef April 2020
Other liabilities 8.9 13.1
- FY2020E debt repayments $38-39m
Deferred tax & provisions 34.5 35.2
Equity & reserves 353.0 335.1
Total equity & liabilities 517.2 515.1
Central Asia Metals PLC 13H1 2020 CASH FLOW
44.0
H1 2020 FCF of
$21.1m
Central Asia Metals PLC 14Sustainability
FIRST SUSTAINABILITY REPORT PUBLISHED

Delivering value through                                                                                                                  Caring for the environment
stewardship
                                                                                                                                          -   Energy usage and climate
-   Corporate governance, business                                                                                                            change
    ethics
                                                                                                                                          -   Air quality and pollution
-   Sustainability management
                                                                                                                                          -   Water usage
Maintaining health and safety
                                                                                                                                          -   Waste management
-   Safety
                                                                                                                                          -   Rehabilitation and biodiversity
-   Occupational heath and
    wellbeing                                                                                                                             Unlocking value for our
                                                                                                                                          communities
Focusing on our people
                                                                                                                                          -   Community engagement and
-   Employee retention and                                                                                                                    development
    development
                                                                                                                                          -   Social investment
-   Diversity and inclusion
                                                                                                                                          -   Economic value added

                                                                                                                                          -   Supply chain
                                     See link for disclaimer - https://www.centralasiametals.com/sustainability/sustainability-reports/
Central Asia Metals PLC                                                                                                                                                         16
CAML 2020 SUSTAINABILITY TARGETS
Health and safety “CAML’s performance against these targets,
- Zero fatalities as well as other initiatives, will be reported
- 15% reduction in 2 year average LTIFR from 2.01 to upon in the 2020 Sustainability Report, to be
below 1.71 published in Q2 2021.”
Environment
- Zero severe or major environmental incidents
- Complete Kounrad scoping study into potential
generation of wind / solar power in Kazakhstan
Community
- Zero severe or major community incidents
People
- 100% of new joiners given full induction training
and a training and development plan
- Development of site people plans for both
operations
Governance
- Deliver audit plan for suppliers and contractors to
ensure responsible supply chain
Central Asia Metals PLC 17HEALTH AND SAFETY
Sasa H1 2020 H1 2020 H1 2020 2019
Sasa Kounrad CAML CAML
- 0 LTI No. lost time
0 0 0 1
injuries (LTI)
- 518 days since last Sasa LTI to 30 June 2020
No. medical
- 1 MTI (employee broken finger) treatment 1 0 1 1
injuries (MTI)
- No occupational health issues identified at Sasa No. recordable
1 0 1 2
injuries (RI)
Kounrad Cumulative
0.8m 0.4m 1.2m 2.4m
hours worked
- 0 LTIs or MTIs
Lost time
- 775 days since last Kounrad LTI to 30 June 2020 injury
0.00 0.00 0.00 0.42
frequency rate
- No occupational health issues identified at (LTIFR)
Kounrad
Total
recordable
Group injury 1.32 0.00 0.87 0.85
frequency rate
- LTIFR 0.00 (TRIFR)
- TRIFR 0.87
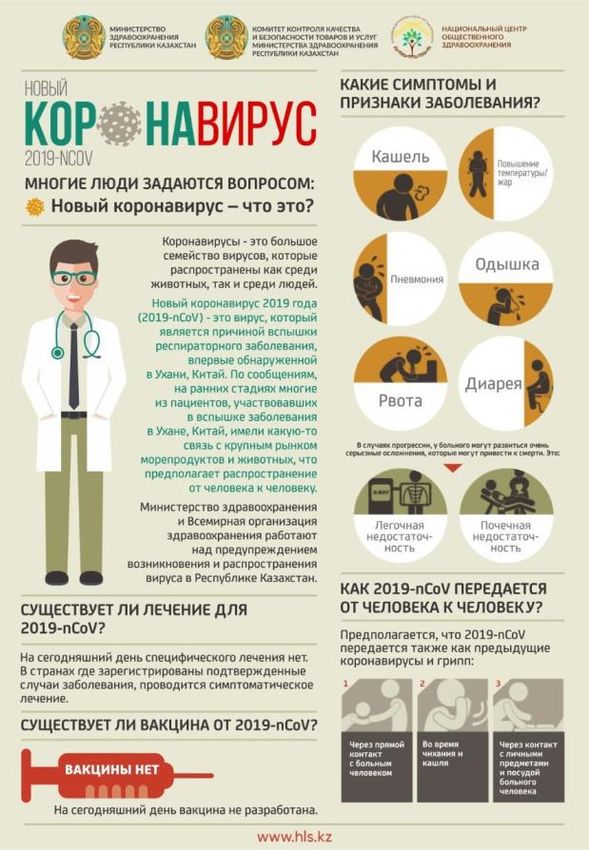
Central Asia Metals PLC 18COVID-19 UPDATE
Kazakhstan North Macedonia
- Nationally, over 100,000 cases - Nationally, over 15,000 cases
- 700+ cases reported in - 100+ cases in wider Delcevo /
Balkhash, town closest to Makedonska Kamenica area
Kounrad operation close to Sasa mine
- Employees currently with - Employees currently with
COVID-19, 0 COVID-19, 4
- No disruption to production or - No disruption to production or
sale of copper sale of zinc and lead
concentrates
Central Asia Metals PLC 19OUR COMMUNITIES
North Macedonia COVID-19 support Kazakhstan COVID-19 support
- Support of up to $150,000 - Kounrad Foundation, purchase of PCR machine for
Balkhash Central Hospital
- Community PPE provisions
- Cost of $70,000
- Procurement of PPE for medical staff
- Recommended by WHO
- Food and hygiene product donations to the most
vulnerable - Enables rapid testing and identification of COVID-19
cases in local community
- Purchase of new automatic anaesthesia workstation for
Kocani General Hospital (purchase cost in H2 2020) - Purchase of automatic back-up power unit for
- Donation to Ministry of Health Balkhash hospital
- Food and hygiene product donations to the most
vulnerable
Sasa H1 2020 community donations ($0.1m) Kounrad H1 2020 community donations ($0.2m)
Medical
Education Sports treatment
2% 9% Education
2%
3%
Community
COVID-19
donations
39%
9%
Social
Social development Community
development COVID-19 55% donations
1% 79% 1%
Central Asia Metals PLC 20Sasa
SASA ZINC AND LEAD MINE

Long life of mine
                                                                                                N
-   Reserves and resources to
    2038
-   Skarn hosted deposit
-   Mechanised underground mine
-   Currently, sub-level caving
    operation, with transition to
    cut and fill planned
-   Single boom jumbos and
    diesel loaders
-   Currently, ore either trucked                                                   0km               1km

    (30%) or hoisted (70%) to
    surface, with plans for more
    efficient sole decline haulage           Svinja Reka         Kozja Reka           Golema Reka
    in the future (pending Board approval)   Primary orebody    2019 exploratory    Indicated and Inferred
                                                               drilling programme         Resources
-   Current main tracked haulage             Area of current
    830 level                                                  (previously mined      (previously mined
                                               production         1966-1989)             1980-2010)
-   Shaft at Golema Reka

Central Asia Metals PLC                                                                                   22
SASA PRODUCTION UPDATE
Solid H1 2020 performance Unit H1 2020 2019 2018
- Ore mined, 416,055t
Ore mined t 416,055 817,714 803,101
- Zinc in concentrate, 12,203t
Plant feed t 419,856 820,491 804,749
- Lead in concentrate, 15,140t
Zinc grade % 3.37 3.29 3.31
2020 production guidance, under review Zinc
% 86.3 86.5 84.6
recovery
- Processing facilities not currently operational
Zinc t 12,203 23,369 22,532
- Guidance was:
- Zinc 23,000t - 25,000t, Lead 30,000t - 32,000t Lead grade % 3.82 3.77 3.90
70 900 Lead
800 % 94.3 94.5 93.6
Metal production (kt)
Plant throughput (kt)
60 recovery
700
50
31
600 Lead t 15,140 29,201 29,388
40 30 31 30 29 29 29 500
28 28 30
30 400
300
20 15
27 200
10 23 22 23 24 23 23 22 23 23
12 100
- -
2010 2011 2012 2013 2014 2015 2016 2017 2018 2019 H1
2020
Zn production Pb production Throughput
Central Asia Metals PLC 23SASA H1 2020 UNDERGROUND IMPROVEMENTS
New Epiroc mining fleet
- 6 new underground machines on order for 2020
- H1 2020, on site
- 1 boomer drill rig, 3 loaders
- Q3 2020, to be delivered
- 1 boomer drill rig, 1 truck
- Future fleet replacement plans
- additional units in 2021, 2022 and beyond
Newtrax monitoring software
- Installed on 11 machines during H1 2020
- Software produces reports on vehicle utilisation,
availability, number of cycles
‘Line of sight’ loading
- Two loaders fitted with line of sight remote
loading systems
Central Asia Metals PLC 24LIFE OF MINE STUDY – TRANSITION TO CUT AND FILL
Rationale
- Cut and fill generally regarded as a safer mining
method than sub-level caving
- Existing operational team utilising the same equipment
- A more flexible method, better suited to
geometry of orebody - higher recovery and
reduced dilution of ore expected
- Geotechnical studies show increasing stresses at
depth, need for supporting pillars negated in C&F
- >40% tailings can be stored underground
- No more costly TSFs to be built
- Longer term improvements to tailings storage
- Proposed development of new decline
- faster access underground, increased ventilation, easier
access for reticulation, no more ‘double handling’ on
main 830 haulage level
Central Asia Metals PLC 25LIFE OF MINE TAILINGS SOLUTION AT SASA
Downstream tailings facilities
- 5 TSFs at Sasa TSF4
- TSF4 facility in operation
- Leakage incident 14 September 2020, investigation
underway
- Full Church of England Pension Board disclosure
- Sasa team ascertaining workstreams required to
comply with Global Industry Standard on Tailings
Management
Future tailings storage
- Change in mining method to cut and fill, >40%
LoM tailings stored underground as backfill
- 30% LoM tailings to be stored in TSF4
- Remainder, CAML is advancing studies into dry-
stack tailings
- H2 2020 drill programme to identify suitable location Typical backfill plant
Central Asia Metals PLC For more details, see: https://www.centralasiametals.com/sustainability/tailings/ 26LIFE OF MINE STUDY IN NUMBERS
Svinja Reka Ore Reserves (JORC 2012) Production profile
Grades Contained metal - Construction period (2021-2022)
- Production guidance maintained at 825,000t - 850,000t
Mt Pb (%) Zn (%) Ag(g/t) Pb (kt) Zn (kt) Ag(koz)
- Ramp up period (2023-2024)
Probable 10.7 4.0 3.0 22.3 431 320 7,671
- 850,000t - 900,000t
Total 10.7 4.0 3.0 22.3 431 320 7,671 - LoM – (2025 onwards)
Ore Reserve prepared by Sasa technical team as of June 2020, Scott Yelland (COO) as Competent Person
- 900,000t
Operating costs Capital expenditure
- Operating costs set to increase, primarily due to - Sustaining capex, $8-10m/year
paste component and treatment of tailings
- 2021-2022 project capex, c.$18-19m
- 2021 guidance $37-39/t
- $13m paste plant and reticulation
- Includes mining, processing and local G&A - $2.5m decline development
- Site based costs per tonne expected to be c.5% - $3m dry stack tailings related costs
higher than 2019 from ramp up period onwards
- 2021 Sasa capex guidance, $13-14m
Central Asia Metals PLC 27Kounrad
KOUNRAD OVERVIEW

                                                                                                  Eastern
                                                                                                  Dumps
                                                                                      7
                                                                                            6
                                                                  2           5

                                          20        Kounrad
                                                    mine
                                                                                  9-10
                                                                                                SX-EW
                                          13                                                    plant

                                    21a
                Western                        15
                Dumps

                                          1a
                          16                        Kounrad
                                                    village
                                                                                  Remaining recoverable resources

                                                              Eastern Dumps                                 10,000t
                               22                             Western Dumps                              145,000t

                                                              Total                                      155,000t

Central Asia Metals PLC                                                                                               29
KOUNRAD PRODUCTION
In-situ dump leach and SX-EW plant 4.5 120
4.0
Quarterly copper production (kt)
Cumulative copper production (kt)
- On track to meet 2020 guidance 3.5
100
- H1 2020 copper production, 6,607t 3.0 80
2.5
- 2020 guidance, 12,500t-13,500t 2.0
60
- 75% to be leached from Western Dumps 1.5 40
1.0
- Eastern Dumps 0.5
20
- Average dump height 20m 0.0 -
2012 2013 2014 2015 2016 2017 2018 2019 2020
- Average leach time 8 months
- Average copper recovery 45-50%
- Western Dumps 45
40
- Average dump height 40m 35
Recovery of total Cu %
30
- Average leach time 20 months 25
Actual recovery all operating blocks
20
- Average copper recovery 35-42% 15 Forecast leach curve
10
- Western dump preferred leach application rate of c.2.5
5
l/m2/hr leading to slightly longer leach times 0
0 100 200 300 400 500 600 700
- Production targets achieved by increasing area under leach
Leach days
- Expected copper recovery remains the same
Central Asia Metals PLC 30Outlook
DELIVERING VALUE FOR SHAREHOLDERS

                                                 Industry leading EBITDA Margins
                                                     70%
                                                     60%
                                                     50%
                                                     40%
                                                     30%
                                                     20%
                                                     10%
                                                      0%
                                                     -10%

                                                                                       2019   2020                       Source: Thomson Reuters

                                                     Long-term dividend track record
                                                     200                                                                                  98p

                    First quartile cash costs        150

                  Market leading cost
                   structure creating           $m
                                                     100

                  competitive position
                                                      50

                                                       0
                                                            2012   2013   2014         2015          2016         2017      2018         2019
                                                                                 Cumulative shareholder returns

Central Asia Metals PLC                                                                                                                            32
CAPITAL ALLOCATION
Returns to shareholders Deleveraging
- Remains an important component of our capital
allocation philosophy
- CAML was intending to reinstate dividend
- H1 2020 dividend decision deferred pending greater clarity
on TSF4 issue
- Total dividends since 2012, $176m or 98p 99.0
Growth opportunities
- Maintain focus on business development activities
- Size and liquidity becoming more important
considerations
- Looking to acquire with manageable balance sheet
implications
- Attractive commodity exposure (ideally copper)
Central Asia Metals PLC 33OUTLOOK
CAML, a strong and sustainable
Kounrad 2020 copper
business
production guidance
- Strong operational performance
12,500-13,500t during H1 2020
- LoM review identifies most effective
long term approach at Sasa
Sasa 2020 zinc - Low cost production
production guidance
- Producing the metals essential for
23,000-25,000t modern living
(Under review) - Safely
- Sustainably
Sasa 2020 lead - Capital allocation priorities
production guidance
- Interim dividend decision deferred
30,000-32,000t pending greater clarity on TSF4
(Under review) - Deleveraging
- Looking for growth opportunities
- H2 2020 outlook
- TSF4 incident under investigation
- Employee welfare remains top
priority through COVID-19 challenges
- Improving metal price environment
Central Asia Metals PLC 34DIRECTOR OF CORPORATE RELATIONS
CONTACT Louise Wrathall
DETAILS Sackville House
40 Piccadilly
London W1J 0DR
louise.wrathall@centralasiametals.com
+44 (0) 207 898 9001
https://www.centralasiametals.com/
35Appendix
CENTRAL ASIA METALS (CAML) OPERATIONS

                                                                                                                                                 KAZAKHSTAN
                                                                                                                                                 - Population, 18.3 million
                                                                                                                                                 - GDP per capita, $11,165

NORTH MACEDONIA
- Population, 2.1 million
- GDP per capita, $6,143

  SASA (100%)                                                                      KOUNRAD (100%)
  - Underground zinc and lead mine, northeast North Macedonia                      - In-situ dump leach and SX-EW processing facility, central Kazakhstan
  - Production commenced in 1960’s                                                 - In production for 8 years
  - Produces 23,000-25,000t zinc and 29,000-32,000t lead in concentrate annually   - Produces 12,500-14,000t copper, one of the lowest cost producers globally
  - Life of mine to 2038 (reserves and resources)                                  - Life of operation to 2034
  - 2019 production, 23,369t zinc and 29,201t lead                                 - 2019 production, 13,771t copper

Central Asia Metals PLC                                                                                                                                                 37
CAML ACHIEVEMENTS
2012, Kounrad $39m 10kt 2015, completed $13m
SX-EW plant Stage 1 Expansion to
2010 AIM IPO, raised 2012, instigated dividend
commissioned, copper increase annual copper
$60m at 96p policy
production from Eastern production to current
Dumps commenced 13,000-14,000t
2017, completed $13m
2018 results, Sasa 2017, commenced
Stage 2 Expansion to
acquisition accretive successful leaching of
6 Nov 2017, $402.5m extend site
Western Dumps,
65% EBITDA/share acquisition of Sasa infrastructure to enable
recoveries in line with
8% EPS leaching of Western
expectations
Dumps
2018, Established
2019 production April 2020, CAML $176m paid to
Kounrad Foundation
guidance met for all publishes first standalone shareholders in dividends
charity for Kazakhstan
three base metals sustainability report since 2012 (98p)
community support
Central Asia Metals PLC 38SHARE PRICE / SHAREHOLDERS
Share price performance versus peers Shareholder investment styles
160 Directors GARP
2% 0% Growth
3%
140
Corporate
120 3%
Hybrid
13%
100
Index
80
1%
60 Value & Growth
35%
40
Priv Eq/Ven Cap
8%
20
0
Jan 19 Mar 19 May 19 Jul 19 Sep 19 Nov 19 Jan 20 Mar 20 May 20 Jul 20 Sep 20 Value Quant
9% 2%
CAML Antofagasta PLC Atalaya Mining PLC Kaz Minerals PLC Trading Retail
5% 19%
Trevali Mining Corp Teck Resources Ltd FTSE 250 AIM All-share
Share price (AIM:CAML) £1.51* Shareholders No. shares % holding
Total no. voting shares 176,026,619 BlackRock 19,523,375 11.09
Treasury shares 471,647 JO Hambro 15,114,338 8.59
Issued shares 176,498,266 Fidelity International 14,924,172 8.48
Orion Mine Finance 13,305,528 7.56
Market capitalisation £266m
Polar Capital 9,133,331 5.19
Free float 93%
AXA Framlington 7,250,000 4.12
Average daily volume 0.3m Hargreaves Lansdown 5,855,331 3.33
*as closed on 14 September 2020
Central Asia Metals PLC 39BOARD OF DIRECTORS
Nick Clarke Nigel Robinson Gavin Ferrar Roger Davey
Non-Executive Chairman CEO CFO NED
- technical experience
Chair Member
- Nomination Committee - Sustainability Committee Member
- Nomination Committee
- Audit Committee
- Sustainability Committee
Robert Cathery Nigel Hurst-Brown Nurlan Zhakupov Dr Gillian Davidson David Swan
NED NED, Deputy Chairman NED NED NED
- City experience - fund management experience - Kazakhstan experience - sustainability experience - accounting experience
Chair Member Member Chair Chair
- Remuneration Committee - Audit Committee - Nomination Committee - Sustainability Committee - Audit Committee
- Remuneration Committee - Sustainability Committee
Member - Nomination Committee Member Member
- Nomination Committee - Nomination Committee - Nomination Committee
- Remuneration Committee
Central Asia Metals Plc 40OUR PURPOSE, CULTURE AND VALUES
Our purpose Our values
Our purpose is to produce base Health and safety. The safety of our employees is a
metals, which are essential for core value and we are passionate about protecting the
health and wellbeing of our people. We work hard to
modern living, profitably in a monitor, assess and mitigate all the risks that could
safe and sustainable potentially cause harm to our employees. We strive to
environment for all our ensure that every individual within the Company
stakeholders. understands that safety is their responsibility.
Sustainability. Taking responsibility for sustainable
Our culture development is our core objective and its importance
Nigel Robinson, CEO is considered in each decision that we make. We aim
Since inception of the Company, to positively affect our employees and local
communities, while minimising any adverse impacts on
our culture has been to operate the natural environment.
in an open and transparent
manner and develop a long- Efficiency and innovation. We encourage our team to
term and sustainable business. embrace change and commit to continuing to bring
CAML as a business has been technology and innovation together to improve our
built embracing technology and operations. This approach helps us to use our
continues to operate with an resources wisely and efficiently in achieving long-term
sustainable production.
enterprising spirit.
Respect and trust. We encourage open and
constructive communications with team members and
value collaborative working. We accomplish
transparency through honest, fair, and open
communication with all key stakeholders built on
disclosure, clarity, and accuracy. We are open to
recognising our faults and improving practices.
Central Asia Metals PLC 41COPPER – IMPROVING GLOBAL DEMAND AND
CHALLENGES TO CURRENT AND FUTURE SUPPLY
Rapid price recovery, with outperformance 1,000 Copper Market Balance $4.0
expected based on strong demand $3.5
Surplus / (Deficit) (ktpa)
fundamentals and low inventory $3.0
Price (US$/lb)
500
- Rapid recovery from April lows as raw material $2.5
market remains tight following Latin America $2.0
restrictions and a lack of scrap availability (e.g.
$1.5
Peru output down 41% YoY in May) --
$1.0
- Potential long term demand growth of 2.5% CAGR
resulting from energy transition-related demand $0.5
(e.g. renewable energy and EVs) (500) --
Future supply to be lower grade and higher 2010 2015 2020E 2025E
risk 2,000 Global Copper Mine Supply Growth
Year-on-Year Change (ktpa)
- Every incremental supply unit expected to be lower 1,500
grade, higher impurity, and from an area of higher
geopolitical risk, which will provide support for 1,000
incumbent producers with a strong asset base 500
- Whilst the supply-demand balance has tightened
--
owing to COVID-19 related delays to projects, a
medium term surplus is expected which could limit (500)
periods in which copper is above US$3/lb
(1,000)
2010 2015 2020E 2025E
Sources: Bloomberg, ICSG, BMO Capital Markets
Central Asia Metals PLC 42ZINC - 2020 SURPLUS MAGNIFIED BY COVID-19,
HOWEVER A LONGER-TERM MARKET DEFICIT LOOMS
Supply fundamentals support transition to 1,500 Zinc Market Balance $3,500
deficit despite weaker demand
Surplus / (Deficit) (ktpa)
$3,000
1,000
- Zinc set for third consecutive annual demand $2,500
Price (US$/t)
decline in 2020 as thrifting in galvanizing and die- 500
cast alloys continues $2,000
- Zinc miners generally recovering production lost -- $1,500
during pandemic peak as output increases in Bolivia, $1,000
Mexico and Peru, pushing July spot treatment (500)
charges up to US$165-185/t (from US$160-180/t at $500
end June) (1,000) --
- However, limited long term supply growth expected 2010 2015 2020E 2025E
to generate deficit beyond the projects that are 1,000 Global Zinc Mine Supply Growth
currently ramping up
Year-on-Year Change (ktpa)
Environmental policy constraints in China are 500
positive for ex China supply
- Prior to COVID-19, Chinese government continued to --
focus on environmental inspections at domestic
mines
(500)
- Chinese mine supply expected to be at best flat
over the coming years, hence new supply is required
to balance the market (1,000)
2010 2015 2020E 2025E
Sources: ICSG, BMO Capital Markets
Central Asia Metals PLC 43LEAD – DEMAND MAY BENEFIT FROM A H2 RECOVERY
AND BATTERY GROWTH IN THE LONGER TERM
Supply rebound post lockdown $2,500 Lead Price Chart
- Latest ILZSG data shows mined lead recovered
strongly in June and is now close to or at normal $2,250
Price (US$/t)
levels
- Rebound, with output rising +9.4% m/m and +5.7% YoY (in $2,000
June), compared to demand of +2.3% YoY
Demand to increase but downside risks remain $1,750
- Lead demand fell sharply during Q2, with Chinese
lead-based battery output dropping ~10% YoY $1,500
- Potential for a strong hence may potentially see some 2010 2015 2020E 2025E
benefit from a H2 recovery
Chinese Lead Battery Output
- Demand for automotive batteries crucial for 25
consumption with restoration of Chinese demand
resulting in China inventory cover recovering from a 20
low point in early-May
GVAH 15
- Global automotive lead acid battery market forecast
2018
to reach US$37.8bn by 2027, up from an estimated
2019
US$30.6bn in 2020 (ReportLinker, July 2020) 10
2020
5
Mar
Nov
May
Aug
Apr
Sep
Jan
Jun
Oct
Dec
Feb
Jul
Sources: BMO Capital Markets
Central Asia Metals PLC 44KOUNRAD OPERATING STATISTICS
2012 2013 2014 2015 2016 2017 2018 2019 H1 2020
LTI 0 0 1 2 0 0 2 0 0
Cu production, t 6,586 10,509 11,136 12,071 14,020 14,103 14,049 13,771 6,607
Ave. PLS, m3/hr 383 532 771 784 888 921 993 985 983
PLS grade, gpl 3.9 3.0 2.2 2.3 2.4 2.5 2.2 2.2 2.0
Plant availability, % 96.9 99.3 98.7 99.1 98.6 99.5 99.5 99.6 99.6
Irrigation area, ha 15.3 17.2 28.1 33.1 35.9 39.2 54.3 56.2 56.9
Employees 211 224 254 276 300 343 340 336 345
Cathode purity, % 99.997 99.998 99.998 99.998 99.998 99.998 99.998 99.998 99.998
Central Asia Metals PLC 45KOUNRAD RESOURCE AND TECHNOLOGY
Category Quantity, Mt Grade (%) Contained
copper, kt
Eastern Dumps
Indicated 89.7 0.10 85.8
Inferred 79.6 0.10 81.7
Total 169.3 0.10 167.5
Western Dumps
Indicated 296.4 0.10 282.4
Inferred 181.5 0.09 164.3
Total 477.9 446.7
Total East
647.1 614.2
and West
Prepared by Wardell Armstrong in June 2017
+100,000t copper has been extracted from dumps
Central Asia Metals PLC 46KOUNRAD, PLS AND GROUNDWATER MODEL Central Asia Metals PLC 47
SASA RESOURCES AND RESERVES (JORC 2012)

                                                                                                                                                              Pb contained        Zn
                                              Mt                    Pb grade (%)                     Zn grade (%)                   Ag grade (g/t)                                           Ag (koz)
                                                                                                                                                                  (kt)       contained(kt)
Svinja Reka – Ore Reserves

Probable                                    10.7                              4.0                             3.0                            22.3                 431            320          7,671

Total                                       10.7                             4.0                              3.0                            22.3                 431            320          7,671

Svinja Reka – Mineral Resources

Indicated                                   12.7                              4.7                             3.3                            25.7                 588            421         10,463

Inferred                                     2.0                              3.9                             2.0                            22.6                 81              42          1,508

Total                                       14.7                             4.5                              3.1                            24.8                 669            463         11,972

Golema Reka – Mineral Resources

Indicated                                    1.3                              3.8                             1.6                            13.0                 48              20           528

Inferred                                     6.3                              3.5                             1.4                            12.0                 217             86          2,444

Total                                        7.6                             3.5                              1.4                            12.2                 265            106          2,972
Ore Reserve prepared by Sasa technical team as of June 2020, Scott Yelland (CAML COO) as Competent Person
Svinja Reka Mineral Resource Estimate prepared by Sasa technical team as of June 2020, Jordan Angelov (Sasa Technical Services Manager) as Competent Person
Golema Reka Mineral Resource Estimate prepared by SRK Consulting (UK) Ltd as of December 2018, Guy Dishaw, SRK Principal Consultant as Competent Person

Central Asia Metals PLC                                                                                                                                                                                 48
SASA PROCESSING FLOW SHEET Central Asia Metals PLC 49
You can also read