Hand Sanitizer Analysis Using the Agilent 8860 GC Configured with a Flame Ionization Detector
←
→
Page content transcription
If your browser does not render page correctly, please read the page content below

Application Note

                             Hand Sanitizer Analysis Using the
                             Agilent 8860 GC Configured with a
                             Flame Ionization Detector

Author                       Abstract
Jie Zhang
Agilent Technologies, Inc.
                             This application note describes the analysis of ethanol- and isopropanol‑based hand
                             sanitizer. The Agilent J&W DB-WAX column was used to optimize chromatographic
                             resolution and peak shape. Flame ionization detection (FID) was used for
                             detection. Internal calibration standard (IS) was used for quantitation based on
                             US Pharmacopeia (USP)  method recommendation. The instrument suitability
                             was investigated in terms of peak tailing factor, alcohol resolution to internal
                             standard, and quantitation repeatability.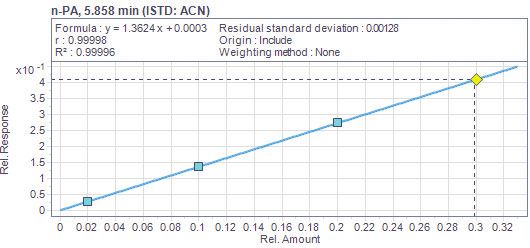
Introduction                                  sample preparation process. In this work,                   were prepared by adding aliquots of
                                              a DB-WAX Ultra Inert column was used                        pure alcohols or its working solution
Ethanol and isopropyl alcohol (IPA) are       on an Agilent 8860 GC in conjunction                        to distilled water with a final volume
the main active components in hand            with FID for alcohol analysis. The                          at 1 mL. Ethanol, IPA, and glycerin are
sanitizer. To maintain effectiveness, the     system performance was evaluated                            in the group 1 calibration solutions.
concentration of ethanol or isopropyl         for retention time repeatability, peak                      The calibration range for ethanol and
alcohol (IPA) should remain in an             resolution, peak tailing factor, and                        IPA are from 1 to 4% (v/v). Glycerin
appropriate range, usually 65 to 75%          quantitation precision. This was done to                    concentration is from 0.01 to 0.18% (v/v).
as labeled on the sanitizer container.        demonstrate the suitability of the 8860                     Methanol and n-propanol (n-PA) were
Because other alcohols can also               GC/FID system coupled with an Agilent                       prepared in group 2 calibration solutions.
be present in sanitizer products as           Ultra Inert column for alcohol analysis in                  The calibration range for methanol was
impurities or improper additions as a         hand sanitizer.                                             from 1 to 4% (v/v), and 0.1 to 1.5% (v/v)
means to make counterfeit products,                                                                       for n-propanol. The internal standard
measuring the correct alcohols at the         Experimental                                                (IS) acetonitrile (ACN) was added to the
proper concentration levels is important.                                                                 calibration solutions at a concentration
Gas chromatography (GC) is one of the         The Agilent 8860 GC is equipped with                        of 5% (v/v). The calibration solutions
techniques recommended by USP for             a split/splitless inlet and an FID. Liquid                  were prepared as shown in Table 2. The
alcohol concentration determination.          sample injection was done using an                          QC sample was prepared by diluting 25
GC can also provide retention time            Agilent 7693A automatic liquid sampler                      µL of ethanol, 25 µL of IPA, and 50 µL of
information to verify the alcohol identity,   (ALS) with a 5 µL syringe. The analytical                   acetonitrile to 1 mL in distilled water.
ensuring that the hand sanitizer has not      parameters are shown in Table 1.
                                                                                                          The hand sanitizer gel sample was too
been contaminated. With the qualitative       Chemicals and standards                                     viscous for direct liquid injection and
and quantitative analysis capability,                                                                     had to be diluted before injection by the
                                              The alcohol solvents and acetonitrile
gas chromatography will continue to                                                                       7693A auto liquid sampler. That is the
                                              (IS) were purchased from ANPEL
play a key role in the quality control of                                                                 reason the real samples and calibration
                                              Scientific Instrument (Shanghai).
hand sanitizer.                                                                                           standards are prepared with solvent
                                              The glycerin working solution was
The methods for alcohol determination,        prepared by weighing 58.4 mg of                             dilution. The hand sanitizer sample of
such as USP 1 and ASTM D3695,2           glycerin (approximately 50 µL) and                          50 µL was dispensed into a flask using
recommend a mid-polar or polar column         diluting it in distilled water to 1 mL.                     a 1 mL gas-tight syringe. Next, 50 µL of
for good separation and response of           The calculated volume concentration                         acetonitrile were added as IS, and the
alcohol components. Based on our              for glycerin working solution was 4.6%                      sample was diluted to 1 mL by distilled
previous work,3 Agilent J&W DB‑Wax or         (v/v). The alcohol calibration standards                    water for later analysis.
Agilent DB-624 Ultra Inert columns can
deliver sharper and more symmetric
                                              Table 1. Analytical parameters of an Agilent 8860 GC-FID on alcohol standards.
peak shapes for alcohols. An FID is
recommended for alcohol detection                                                  Agilent 8860 GC parameters

because it is easy to use and can              S/SL Inlet           250 °C, split ratio 20:1

generate a stable and adequate response        Injection Volume     0.2 µL

within the tested concentration range          Carrier Gas          He

after alcohols are diluted during the          Column Flow Rate     7 mL/min, constant flow mode

                                               Oven                 50 °C (5 min), 30 °C/min to 230 °C (3 min)

                                               FID                  250 °C, air: 400 mL/min, fuel gas (H2): 30 mL/min, constant make up (N2): 18 mL/min

                                               Column               Agilent J&W DB-WAX UI, 30 m, 530 µm, 1 µm (p/n 125-7032UI)

                                               Inlet Liner          Agilent Ultra Inert, low pressure drop with glass wool (p/n 5190-2295)

   2
Results and discussion                                           Table 2. Alcohol calibration standards preparation.

                                                                                    Group One Calibration Standards             Group Two Calibration Standards
This application note focused on the                              Level                                     Glycerin Working
analysis of the main alcohol components                            No.      Ethanol (µL)        IPA (µL)      Solution (µL)     Methanol (µL)           n-Propanol (µL)
and possible methanol contamination                                1            40 (4.0%)       10 (1.0%)      2 (0.0092%)           49 (4.9%)             1 (0.1%)
in hand sanitizer. Five types of alcohols                          2            35 (3.5%)       15 (1.5%)      5 (0.023%)            45 (4.5%)             5 (0.5%)
were included in the calibration                                   3            30 (3.0%)       20 (2.0%)      10 (0.046%)           40 (4.0%)             10 (1.0%)
standard. They were methanol, ethanol,                             4            25 (2.5%)       25 (2.5%)      20 (0.092%)           35 (3.5%)             15 (1.5%)
IPA, n-propanol, and glycerin. Among                               5            20 (2.0%)       30 (3.0%)      40 (0.184%)           30 (3.0%)
them, the concentrations of ethanol,                               6            15 (1.5%)       35 (3.5%)                            25 (2.5%)
IPA, and n-propanol are usually labeled                            7            10 (1.0%)       40 (4.0%)                            20 (2.0%)                  NA
because they are closely related with                              8
                                                                                                                   NA
                                                                                                                                     15 (1.5%)
the effectiveness of eliminating viruses.                          9
                                                                                   NA              NA
                                                                                                                                     10 (1.0%)
Glycerin and other types of alcohols can
                                                                 The final volume of calibration solution at different levels is 1 mL. The alcohol concentrations
be detected in real samples, but there                           at different levels are shown as the values in the parentheses.
is no specific concentration labeled by
producers for these alcohols. To include
glycerin in the calibration standard aims                        group 1 and group 2 with glycerin                              shape achieved on the 8860 GC, with the
to show how the described system                                 working standard. As shown in the                              flow path starting from the S/SL inlet,
can generate a decent peak and give                              chromatogram (Figure 1) and Table 3,                           passing through the analytical column,
adequate detection of late-eluting and                           the tailing factors of all peaks were less                     and ending at the FID, proved that the
sticky alcohols such as glycerin.                                than 1.2. Methanol and IPA eluted before                       system was suitable for the targeted
The separation of five alcohols and one                          ethanol. The resolution of n-propanol to                       alcohol analysis.
internal standard in aqueous solution                            acetonitrile (IS) was 9, and the resolution                    The resolution of ethanol and IPA was
with component concentration varying                             of ethanol to acetonitrile was 12. The                         1.31. It is not a baseline separation
from 1.0 to 4% (v/v), was performed                              USP  standard requires alcohol                            but usually does not impact the
on the Ultra Inert DB-WAX column.                                peak tailing factors of less than 2.0 and                      accurate quantitation of ethanol or IPA
This sample was a mixture of the                                 peak resolutions to internal standard                          considering they do not co-exist in the
middle‑level calibration standard of                             more than 4.0. The resolution and peak                         same hand sanitizer in most cases. Even

                ×102                                                                                                                                            1.   Methanol
                                                             4
                 5.5                                                                                                                                            2.   Isopropanol
                                                                                                                                                                3.   Ethanol
                 5.0                                                                                                                                            4.   Acetonitrile (IS)
                                                                                                                                                                5.   n-Propanol
                 4.5
                                                                                                                                                                6.   Glycerin
                 4.0
Response (pA)

                 3.5

                 3.0
                                                                                                                                                                                          6
                 2.5                1
                 2.0
                                         23                            5
                 1.5

                 1.0

                 0.5

                   0

                       2.0   2.5   3.0   3.5   4.0   4.5   5.0   5.5      6.0     6.5       7.0    7.5     8.0   8.5    9.0    9.5     10.0      10.5    11.0    11.5      12.0    12.5   13.0
                                                                                            Retention time (min)

Figure 1. Chromatogram overlay of alcohol standards analyzed on an Agilent 8860 GC-FID installed with an Agilent DB-WAX Ultra Inert column.

                                                                                                                                                                                          3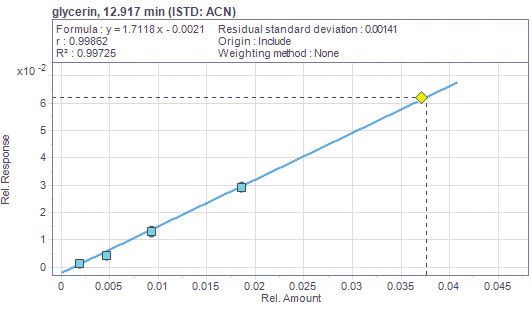
if they are co-existent, the resolution       A
of 1.31 is sufficient to give an accurate
quantitation on the principal alcohol,
which can be shown in the following
analysis result on a hand sanitizer
gel sample.
The alcohol calibration curves were
developed using an internal standard
calibration method. As shown in Figure 2
and Table 3, the correlation coefficients
(R2) for the alcohols across their
calibration range are from 0.997 to 0.999.
The quantitation precision was
evaluated by seven injections of alcohol
                                              B
mixture with each alcohol ranging
from 1 to 2% (v/v). Their overlaid
chromatograms are shown in Figure 1.
The quantitation precisions were
assessed based on the relative standard
deviation (RSD) of the response ratio of
alcohols to acetonitrile during the seven
injections. Most of the quantitation
precision was better than 1%, except
glycerin, with RSD% at 1.7%. The
USP  standard requires an RSD
of no more than 4.0% in the ratio of the
peak of alcohol to the peak of the internal
standard. The precision performance
on the tested platform exceeded the
                                              C
USP  requirement.
The alcohol analysis in two hand
sanitizer gels and in one sanitizer spray
from different vendors was performed.
The chromatograms of the three
products are shown in Figure 3. The
test results of the main alcohols in each
sample are tabulated in the inset table.
For sanitizer gel sample 1, ethanol,
n-propanol, and glycerin are identified.
The tested concentrations of ethanol,
n-propanol, and glycerin are 61.0% (v/v),
10.4% (v/v), and 0.3% (v/v). The ethanol
and n-propanol concentration labeled          Figure 2A,B,C. Calibration curves of IPA (A), ethanol (B), and n-propanol (C), with correlation coefficients
by the producer was 54 to 66% (v/v)           more than 0.999.
and 9 to 11% (v/v). The concentration
measured and labeled for gel sample 1
matched quite well with each other.

   4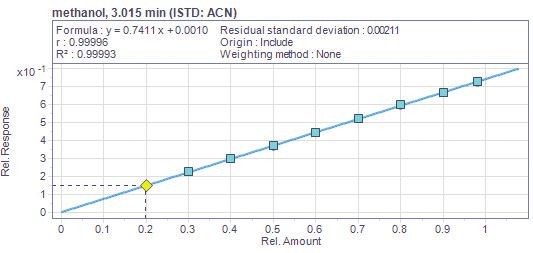
D

E

Figure 2D,E. Calibration curves of glycerin (D) and methanol (E), with correlation coefficients more than 0.995.

Table 3. Demonstration of system suitability for alcohol analysis.

                                                          Calibration
                 Average RT     RT       Quantitation     Correlation   Calibration Range Peak Tailing   Resolution
    Compound       (min)       RSD%      Precision (%)    Coefficient          (v/v)        Factor        with IS
    Methanol        3.015       0.025         0.3           0.9999          1 to 4.9%          1.2          >15

    IPA             3.488       0.028        0.41           0.9999           1 to 4%           1.1          >15

    Ethanol         3.618       0.026        0.16           0.9999           1 to 4%           1.0           15

    n-Propanol      5.858       0.008        0.29           0.9999         0.1 to 1.5%         1.1           9

    Glycerin       12.917       0.006        1.67           0.9970      0.0092 to 0.184%       1.0           >9

                                                                                                                      5
ACN Hand Sanitizer Gel Sample 1
×102
5.110
8.0 Component Measured Labeled
7.5 Ethanol 61.0% 54 to 66%
7.0 n-Propanol 10.38% 9 to 11%
6.5
Ethanol Glycerin 0.30% NA
6.0 3.630
5.5
Response (pA)
5.0
4.5
4.0
3.5
3.0
2.5 n-PA
5.865
Isopropanol
2.0
Methanol
1.5 12.922
1.0 Glycerin
0.5
0
0 0.5 1.0 1.5 2.0 2.5 3.0 3.5 4.0 4.5 5.0 5.5 6.0 6.5 7.0 7.5 8.0 8.5 9.0 9.5 10.0 10.5 11.0 11.5 12.0 12.5 13.0 13.5
Retention time (min)
ACN
×102 5.111
Hand Sanitizer Gel Sample 2
7.5
Component Measured Labeled
7.0
6.5 Ethanol Ethanol 70.4% 70%
3.631
6.0 IPA 3.6% NA
5.5
Response (pA)
Glycerin 0.2% NA
5.0
4.5
4.0
3.5
3.0
2.5
2.0
1.5 Glycerin
Isopropanol
1.0 11.372 11.708 12.921
3.500
0.5 7.598
0
3.5 4.0 4.5 5.0 5.5 6.0 6.5 7.0 7.5 8.0 8.5 9.0 9.5 10.0 10.5 11.0 11.5 12.0 12.5 13.0
ACN Retention time (min)
×102 5.097
8.0 Hand Spray
7.5 Ethanol
Component Measured Labeled
7.0 3.616
6.5 Ethanol 75.61% 75%
6.0 IPA and Others NA NA
5.5
5.0
Response (pA)
4.5
4.0
3.5
3.0
2.5
2.0
1.5
1.0 Glycerin
0.5 Isopropanol
0
2.0 2.5 3.0 3.5 4.0 4.5 5.0 5.5 6.0 6.5 7.0 7.5 8.0 8.5 9.0 9.5 10.0 10.5 11.0 11.5 12.0 12.5 13.0
Retention time (min)
Figure 3. Chromatograms of hand sanitizer gels and spray and their identification results.
6Gel sample 2 was identified with the sanitizer as antimicrobial ingredient and 10 real sample injections, ending
70.4% (v/v) ethanol, 3.6% (v/v) IPA and or humectant, etc. Their concentration with a fifth injection of QC sample. The
0.2% (v/v) glycerin. It was labeled with was estimated less than 1% (v/v) by nominal concentration of ethanol and
ethanol concentration at 70% (v/v), using the relative response factor of IPA in the QC sample was 50.0% (v/v).
another good match with the test glycerin. There is no methanol detected The overlaid chromatograms of five QC
results. For gel sample 2, IPA and ethanol in the three hand sanitizers samples. samples are shown in Figure 4. RT
did not separate at the baseline level, A long sequence was run to test the and quantitation results for the five QC
but the quantitation of ethanol is still stability of the system. A total of samples are listed in Table 4. The
accurate. The ethanol concentration 40 injections of hand sanitizer gel average measured concentration for
in alcohol spray is labeled at 75% (v/v) samples and five QC samples were run. ethanol and IPA were 50.2% (v/v) and
and determined at 75.6%. No glycerin The sequence started from a QC sample, 51.2% (v/v). The quantitation accuracy
was detected in the alcohol spray. There followed by five injections of sanitizer of QC samples was 101% and 102%.
are other peaks detected in sanitizer gel sample 1 and five injections of gel The quantitation precision for IPA and
gel sample 2, which eluted at 7.6, 11.4, sample 2. This was followed by another ethanol were 0.715% and 1.11%. The RT
and 11.7 minutes. It is likely that these three rounds of one QC sample injection repeatabilities were 0.03% and 0.04%.
components are added by producers to
×102 ACN
8.5
8.0
7.5
7.0
6.5
6.0
5.5
Response (pA)
5.0 Isopropanol Ethanol
4.5
4.0
3.5
3.0
2.5
2.0
1.5
1.0
0.5
0
2.9 3.0 3.1 3.2 3.3 3.4 3.5 3.6 3.7 3.8 3.9 4.0 4.1 4.2 4.3 4.4 4.5 4.6 4.7 4.8 4.9 5.0 5.1 5.2 5.3 5.4 5.5 5.6 5.7 5.8 5.9 6.0 6.1 6.2 6.3 6.3
Retention time (min)
Figure 4. The overlaid chromatograms of five QC samples.
Table 4. Quantitation and RT precision of five QC samples during 40 runs of real sample analysis.
Quantitation (Vol%) QC1 QC2 QC3 QC4 QC5 Quan. RSD%
IPA 50.363 50.038 49.958 50.045 50.821 0.71%
Ethanol 50.544 51.061 52.067 51.473 51.051 1.11%
Retention Time (min) QC1 QC2 QC3 QC4 QC5 RT RSD%
IPA 3.487 3.488 3.488 3.486 3.486 0.03%
Ethanol 3.617 3.618 3.618 3.616 3.615 0.04%
7The result summary for 20 injections Table 5. The result summary of sanitizer gel samples during stability test.
of gel samples 1 and 2 is tabulated in
Gel 1 Gel 2
Table 5. The concentration measured
RT Quan. RT Quan. RT Quan. RT Quan.
for the 40 injections of real hand Injection Injection
(min) (Vol%) (min) (Vol%) (min) (Vol%) (min) (Vol%)
No. No.
sanitizer samples matched well with Ethanol n-Propanol IPA Ethanol
the labelled concentration range. The 2 3.618 61.59 5.858 10.48 7 3.49 3.63 3.62 69.93
quantitation precision for ethanol and 3 3.62 61.55 5.856 10.48 8 3.491 3.63 3.621 70.39
n-propanol in sample 1 was 0.45% and 4 3.618 61.54 5.858 10.49 9 3.49 3.65 3.619 70.38
0.38%, respectively, and the quantitation 5 3.618 61.02 5.857 10.41 10 3.491 3.65 3.623 70.45
precision for IPA and ethanol in 6 3.619 61.56 5.856 10.48 11 3.493 3.63 3.623 70.40
sample 2 was 0.55% and 0.31%. The
13 3.62 61.59 5.856 10.48 18 3.49 3.65 3.621 70.02
RT repeatability for ethanol, IPA and
14 3.618 61.57 5.856 10.48 19 3.492 3.61 3.622 70.29
n-propanol during 20 injections ranged
15 3.62 61.85 5.858 10.53 20 3.492 3.62 3.623 70.39
from 0.02 to 0.04%, comparable to the
16 3.619 61.73 5.857 10.51 21 3.492 3.65 3.622 70.56
RT RSD% of 0.01 to 0.03% generated in
17 3.618 61.75 5.856 10.52 22 3.492 3.63 3.622 70.30
seven consecutive injections shown in
24 3.619 61.42 5.856 10.47 29 3.491 3.65 3.622 70.40
Table 3. The quantitation accuracy and
25 3.617 61.76 5.855 10.51 30 3.49 3.61 3.621 70.34
precision of the QC and real samples
26 3.619 61.74 5.857 10.51 31 3.49 3.62 3.62 70.41
demonstrated that the 8860 GC-FID
27 3.619 61.89 5.856 10.53 32 3.49 3.63 3.62 70.36
system, coupled with the Ultra Inert
28 3.619 61.80 5.856 10.53 33 3.491 3.66 3.622 70.60
DB‑WAX column, can provide reliable and
accurate alcohol analysis. 35 3.618 61.93 5.856 10.55 40 3.489 3.64 3.619 70.97
36 3.617 62.02 5.855 10.55 41 3.49 3.64 3.62 70.49
Conclusion 37 3.618 62.28 5.857 10.60 42 3.49 3.64 3.62 70.58
38 3.619 62.09 5.857 10.55 43 3.487 3.70 3.617 70.52
This work used the 8860 GC system in 39 3.617 62.07 5.856 10.55 44 3.488 3.61 3.619 70.71
conjunction with FID and an Ultra Inert Mean 3.62 61.74 5.86 10.51 3.49 3.64 3.62 70.42
DB-WAX column for alcohol analysis RSD% 0.03% 0.45% 0.02% 0.38% 0.04% 0.55% 0.04% 0.31%
in hand sanitizers. The inert gas flow
path contributed by the Ultra Inert liner
and Ultra Inert column helped generate The system performance demonstrated 3. Abercrombie, V. et al. Analysis of
a sharp and symmetrical peak for the how the 8860 GC/FID with the Ultra Inert Ethanol and Isopropyl Alcohol in
targeted alcohols, with peak tailing column system is useful for alcohol Alcohol-Based Hand Sanitizers
factors less than 1.2. The resolution of analysis in hand sanitizers. by Direct Injection GC/FID,
alcohol to internal standard exceeded the Agilent Technologies application
requirement in the USP method. References note, publication number
The average quantitation precision on 5994‑1923EN.
the volatile alcohols are lower than 1. USP Alcohol Determination,
1%. The calibration performance for Monograph US Pharmacopeia, 2020.
all five alcohols are excellent with 2. ASTM D3695-95(2013), Standard
linearity correlation coefficients better Test Method for Volatile Alcohols in
than 0.995. The analysis on the real Water by Direct Aqueous-Injection
hand sanitizer gels and sanitizer spray Gas Chromatography, ASTM
delivered accurate quantitation results. International, West Conshohocken,
PA, 2013.
www.agilent.com/chem
DE.5224768519
This information is subject to change without notice.
© Agilent Technologies, Inc. 2020
Printed in the USA, June 29, 2020
5994-2089ENYou can also read