Hangover Research Needs: Proceedings of the 5th Alcohol Hangover Research Group Meeting
←
→
Page content transcription
If your browser does not render page correctly, please read the page content below
Send Orders for Reprints to reprints@benthamscience.net

                                                 Current Drug Abuse Reviews, 2013, 6, 000-0000                                           1
                                                                                                   th
Hangover Research Needs: Proceedings of the 5                                                            Alcohol Hangover
Research Group Meeting
Joris C. Verster*,1,2, Chris Alford3, Adriana C. Bervoets1, Suzanne de Klerk1, James A. Grange4,
Anna Hogewoning1, Kate Jones5, Darren L. Kruisselbrink6, Lauren Owen4, Thomas M. Piasecki7,
Senta Jorinde Raasveld1, Sam Royle4, Wendy S. Slutske7, Gordon S. Smith8, Richard Stephens4
and the Alcohol Hangover Research Group

1
    Utrecht University, Utrecht Institute for Pharmaceutical Sciences, Division of Pharmacology, Utrecht, The Netherlands
2
    Centre for Human Psychopharmacology, Swinburne University, Melbourne, Australia
3
    University of the West of England, Bristol, UK
4
    School of Psychology, Keele University, Keele, Staffordshire, UK
5
    Health & Safety Laboratory, Buxton, UK
6
    School of Recreation Management and Kinesiology, Acadia University, Wolfville, Nova Scotia, Canada
7
Midwest Alcoholism Research Center and Department of Psychological Sciences, University of Missouri, Columbia,
MO, USA
8
    University of Maryland, School of Medicine, Baltimore, Maryland, USA

INTRODUCTION                                                              executive functioning, is required [2]. It is also important to
                                                                          investigate to what extent performance impairment observed
    Hangover is the most commonly reported negative                       with cognitive tasks in clinical experiments translates to
consequence of heavy alcohol consumption. A large variety                 academic performance or real life activities such as driving a
of symptoms have been reported the day after heavy                        car. When designing hangover trials, it is important to take
drinking, which together are called the alcohol hangover.                 current research guidelines into account, by taking notice of
Frequently reported hangover symptoms include thirst,                     the methodological issues discussed in the 2010 consensus
headache, drowsiness, and reduced alertness [1]. Although                 paper of the Alcohol Hangover Research Group [3].
hangover is a common phenomenon in society and has
serious socioeconomic consequences, it has received                           Lauren Owen (Keele University, UK) presented
relatively little research attention. To increase research and            preliminary findings of hangover research funded by an EU
international collaboration to examine the alcohol hangover,              Marie Curie Research Fellowship. In this on-going
in 2010 the Alcohol Hangover Research Group (AHRG) was                    randomized, crossover trial, neurocognitive effects of
founded. This paper covers the research topics discussed at               alcohol hangover are examined in a sample of 200 students.
the 5th Alcohol Hangover Research Group meeting, held                     Cognitive domains assessed include immediate and delayed
August 1-2, 2013 in Keele, UK.                                            declarative memory, working memory, attention and
                                                                          executive function, and mood. Participants are tested on 2
                                                                          occasions following both an evening of alcohol consumption
HANGOVER     EFFECTS    ON                           COGNITIVE            and abstention. Preliminary analyses revealed significantly
FUNCTIONING AND DRIVING
                                                                          reduced feelings of alertness, contentment and a trend for
   The hangover state may impair cognitive performance                    reduced feelings of calmness during hangover. Alcohol
which in turn may have a negative impact on daily activities              hangover also resulted in impaired performance on working
such as driving a car and on-the-job performance. However,                memory tasks as well as slower reaction times and greater
the currently available research often suffers from                       number of errors, and impaired response inhibition. These
methodological shortcomings, differences in design which                  findings support the existing literature that alcohol hangover
make direct comparisons difficult, and, as a result,                      affects cognitive and psychomotor functioning [2,4].
inconclusive outcomes. Attention and memory appear to be                      Since there are currently no effective hangover cures
broadly affected by alcohol hangover, but more research                   [5,6], it is likely that impaired cognitive and psychomotor
examining these effects in greater detail, together with                  functioning observed in experimental studies is reflected in
                                                                          daily activities. It is also likely that drinkers have to attend
                                                                          school or work the following day and thus risk that hangover
*Address correspondence to this author at the Utrecht Institute for
Pharmaceutical Sciences, Division of Pharmacology, Utrecht University,    affects their planned activities and performance. This has
Universiteitsweg 99, 3584 CG, Utrecht, The Netherlands;                   been confirmed by studies reporting on absenteeism and
Tel: +31 30 253 6909; Fax: +31 30 253 7900; E-mail: j.c.verster@uu.nl     reduced productivity across various different groups of
                                                                          workers [7]. A recent study interviewing Dutch professional

                                             1874-4737/13 $58.00+.00      © 2013 Bentham Science Publishers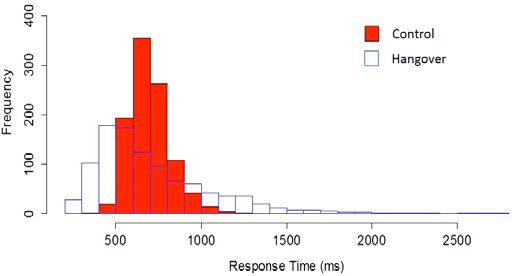
2 Current Drug Abuse Reviews, 2013, Vol. 6, No. 2 Verster et al.
truck drivers revealed that in addition to causing significant further showed that during alcohol hangover, subjects
socio-economic consequences, the alcohol hangover may reported that their driving quality was significantly poorer,
also put those experiencing this post-intoxication state at and less safe, considerate, predictable, relaxed, and
increased traffic accident risk. This study showed that more responsible. Also, significantly more effort was needed to
than half of the professional drivers who consume alcohol perform the driving test during hangover. To illustrate the
and occasionally have hangovers report that they have driven relevance of the magnitude of driving impairment during
while having a hangover during the past year, both private hangover it was compared to impairment observed in another
and professionally [8]. While most drivers admit to driving study that tested the acute effects of alcohol using the same
in the hangover state ‘sometimes’, about 10% of them state driving simulator test [9]. The effects on driving during
driving ‘often’ or ‘always’. They acknowledge that during hangover were greater than those seen with a BAC of 0.05
hangover their driving is impaired when compared to other g%, i.e. the legal limit for driving a car in many countries. It
(alcohol free) days. This study confirms that driving during was therefore concluded that highway driving is significantly
hangover is a common phenomenon, and justifies further impaired during alcohol hangover. Additional analyses
research to examine the impact of alcohol hangover on revealed a significant moderating effect of total sleep time.
driving, and develop quick, on-road measurement methods This finding underlines the unique strength of a naturalistic
of biomarkers of the alcohol hangover state. design, in which these moderating factors become visible. In
Adriana Bervoets and Suzanne de Klerk (Utrecht contrast, in controlled experiments, drinking time and sleep
duration are usually controlled, masking their impact on
University, The Netherlands) presented the results of a
next-day consequences of heavy alcohol consumption.
naturalistic study (using normal drinking episodes rather
than experimental dosing) examining the effects of alcohol Chris Alford (University of the West of England, UK)
hangover on simulated highway driving performance. examined the effects of alcohol hangover on a typical
Driving performance was tested the morning following an ‘commute’ or drive to work in a demanding driving
evening of consuming on average 10.2 alcoholic drinks environment, together with assessing subjective workload.
(alcohol hangover) and on a control day (no alcohol Perceived workload has been largely ignored in relation to
consumed). In The Netherlands, a standard alcoholic drink hangover, although Liu and Ho reported increased mental
contains 10 g alcohol. Social drinkers (N=42) performed a effort whilst driving under the influence of alcohol [12].
standardized 100-km highway driving test in the STISIM Thirteen female and six male drivers attended two
driving simulator [9]. It takes about 1 hour to complete the experimental sessions, once the day following a night of
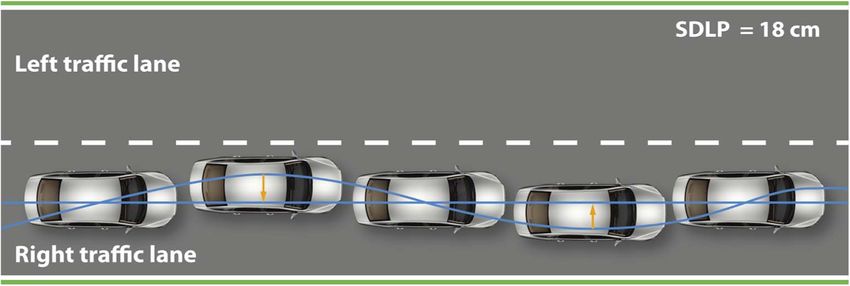
test. Standard Deviation of Lateral Position (SDLP, i.e. the drinking and once after no alcohol consumption in a
weaving of the car) and lapses of attention were examined counterbalanced design. They undertook a 20 minute drive
[10,11]. An explanation of SDLP measurement is given in in a mixed urban and rural environment with speed limit set
Fig. (1). to 50mph and hazards (e.g. pedestrians stepping into the
road), as well as a divided attention task in the STISIM
A lapse was defined as a continuous change of lateral
position of >100 cm for at least 8 seconds. Self-reported driving simulator. General impairment in the form of
increased reaction time and SD speed (speed variability)
driving quality, driving style, mental effort, and sleepiness
were found during hangover when compared to the control
before and after driving, and hangover severity were
condition, whilst more errors were seen with increased
assessed. SDLP (hangover – control) and lapses were
lateral position deviation, reflecting possible lapses. Even
related to the subjective outcome measures.
when knowingly impaired, participants can often maintain a
Driving performance was significantly impaired during good level of driving performance similar to an unimpaired
alcohol hangover as expressed by a significant increase in state for a short time duration [13]. The current findings
SDLP and number of lapses relative to the control day, and suggest that even shorter driving periods are detrimentally
significantly increased total lapse duration. The analyses affected when in a demanding driving environment. The
Fig. (1). Standard Deviation of Lateral Position (SDLP). SDLP, the weaving index, is the standard deviation computed relative to the
mean lateral position of the car over the entire 100-km drive. Higher SDLP values indicate less vehicle control, i.e. impaired driving.Hangover Research Needs Current Drug Abuse Reviews, 2013, Vol. 6, No. 2 3
increased subjective workload reflects the increased effort that with increasing peak BAC the percentage of people who
participants made in the hangover condition, but were unable claim not to have a hangover decreases dramatically. The
to compensate for the resulting level of impairment. data from Acadia University show that for a substantial
number of subjects total alcohol consumption in real life
The results of these two driving studies add to the
growing body of evidence showing that alcohol hangover leads to a BAC greater than 0.10 g%, but within this group,
the number of hangover immune drinkers seems much
can significantly impair driving. Creating awareness of this
smaller than the percentage of 23% found in experimental
problem may help reduce the total number of road traffic
studies with peak BAC levels around 0.10 g% [19].
accidents which are predicted to become the fifth leading
cause of deaths worldwide by 2030 [14]. Richard Stephens (Keele University, UK) discussed the
results of age differences on experiencing a hangover.
HANGOVER SEVERITY, RESISTANCE, AND AGE Examining a Danish dataset of over 50.000 adults revealed
that experiencing hangover after binge drinking is much
The presence of hangovers and their severity differ more common in young adults compared to older adults [20].
significantly between and within subjects, and previous Unfortunately, the dataset provided no information on the
research showed that there is a poor correlation between total amount of alcohol consumed that resulted in a
hangover severity, total alcohol consumption, and hangover. Previous research has shown that the amount of
(estimated) BAC [15,16]. alcohol consumed during binge drinking episodes reduces
There is debate about the BAC level that should be across the adult age span [21]. In this study, a reduction of
reached to provoke a hangover. Previously, it was suggested about one third was seen in alcohol consumption of elderly
that a peak BAC of at least 0.10 g% should be reached to (65+ years) when compared to those aged 18-24 years old.
provoke a hangover [17]. As a result, study participants that The latter may explain the finding of the reduced incidence
do not reach this BAC are typically excluded from further of having hangovers in the elderly. Hence, more research is
analysis. It can be questioned if this is correct. First, the peak needed to confirm if there is an actual reduction in sensitivity
BAC of 0.10 g% is not supported by scientific research, but to having hangovers in the elderly, or if they are simply
based on consensus and the usual permissible limit in consuming less alcohol while binge drinking and therefore
experimental dosing studies. Human subjects concerns have less hangovers.
commonly restrict the dose of alcohol consumed in
experiments to BACs of only about 0.10%, while “normal” STATISTICAL AND METHODOLOGICAL CONSI-
binge drinking occasions may result in BACs two or three DERATIONS OF HANGOVER RESEARCH
times this level.
Response times (RTs)—the time elapsing between the
Second, it can be argued that everybody who reports a appearance of experimental stimuli and the execution of an
hangover should be included in the analysis. Alternatively, a overt response from participants—are a popular and
peak BAC corresponding to drinking to intoxication (e.g. powerful measure for assessing cognitive functioning. As
0.05 g% or 0.08 g%) could be used as cut-off to define such, they are a promising avenue with which to explore
having a hangover. However, several naturalistic studies and putative effects of alcohol hangover on cognition. Typical
surveys reveal that people who do not achieve a peak BAC RT analysis examines group/condition differences on
of 0.10 g% or 0.08 g% also report having a hangover and measures of central tendency, typically the arithmetic mean.
suffer from a variety of hangover symptoms [1]. Excluding
In his presentation, James A. Grange (Keele University,
these participants from statistical analyses does not seem
UK) discussed some limitations of examining mean RTs. It
warranted. Future analysis of combined large datasets should
was argued that when only looking at means, a lot of
determine if a peak BAC cut-off value is necessary to
important information is simply ignored. In addition,
provoke a hangover, or whether every drinker who reports a
hangover should be included in the analyses irrespective of differences between means—if found—provide limited
insight, as RTs are not a measure of a unitary process. Also,
their peak BAC. It is also not clear if it is the peak BAC that
true differences in groups can become null at the mean level.
is important or the total dose of alcohol (which if consumed
This latter point is important for hangover research, as group
over a period of time may not result in really high BACs).
differences for RT are often negligible.
Darren Kruisselbrink (Acadia University, Canada)
examined the proportion of students who report not To illustrate some limitations of looking simply at mean
RTs, Fig. (2) summarizes hypothetical data from an RT
experiencing a hangover, the frequency distribution of
experiment collected during hangover and a control day.
students across each rating score of the Acute Hangover
Scale (AHS) single-item hangover question [18], as well as Statistical analysis comparing the average RT reveals no
estimated BAC distribution quartiles for each hangover significant difference between the hangover and control
severity rating score. Students who rated their hangover after conditions, as the mean is 700 milliseconds for both.
their heaviest drinking episode as ‘absent’ and who also did However, there are clear group differences at the level of the
not indicate experiencing a hangover in the past month were RT distribution between conditions, with hangover condition
considered ‘hangover immune’ (HOI); those who indicated producing more variable responding, which goes unnoticed
experiencing a hangover in the past month, but not following when only comparing the means with a traditional paired-
their heaviest drinking episode were considered ‘hangover samples t-test.
resistant’ (HOR). For those claiming hangover immunity, the Two recommendations for researchers to examine and
majority of their BAC’s (~75%) clustered below a BAC of
statistically analyze RT data were discussed. First, analysis
0.10 g%. Comparing different peak BAC groupings revealed4 Current Drug Abuse Reviews, 2013, Vol. 6, No. 2 Verster et al.
of group differences across whole-RT distributions was Blood alcohol concentration (BAC) is an excellent
suggested, which requires estimating parameters for a biomarker of alcohol intoxication, and its relationship with
mathematical function that fits the shape of RT distributions performance impairment has been established. For example,
(specifically, the ex-Gaussian distribution). The resulting there is a clear relationship between BAC and driving
parameter estimates describe the shape and spread of RT impairment [22] and the chances of having a traffic accident
distributions for each participant, and as such are more [23]. Unfortunately, BAC is not a useful biomarker of
sensitive to potential group differences at the distribution alcohol hangover, since hangovers develop the following day
level. Secondly, fitting computational/process models to RT after an evening of drinking when BAC recordings are
data was recommended. Process models have parameters usually zero. There are a number of indirect markers of
that reflect psychologically meaningful processes. For tissue damage (e.g. liver function tests such as GGT, AST,
example, the Ratcliff Diffusion model of RT data allows the ALT), mean corpuscular volume(MCV), and carbohydrate
researcher to estimate the potential impact of alcohol deficient transferrin (CDT)), that are indicators of heavy
hangover on several important RT processes: drift rate, alcohol use. However these are generally long-term markers
which reflects the strength of evidence accumulation towards (requiring heavy alcohol consumption for at least two weeks
the correct response during response decision; response before showing an effect) and several are non-specific [24].
boundary, which reflects how much evidence is required Some, such as CDT, are sensitive and specific and may have
before a response is executed (a higher response boundary a role in studies where long-term alcohol habits, or the effect
parameter estimate reflects a more cautious responder, of such habits on hangover propensity/symptoms, are being
leading to slow but accurate responses); and non-decisional investigated. Direct, oxidative biomarkers of alcohol include
processes, such as perceptual encoding of the stimulus and acetic acid and acetaldehyde. Acetaldehyde has been
time for motor responses. Examination of the potential proposed as a relevant biomarker because it is responsible
effects of hangover on these different parameters provides for many of the pathological effects of alcohol. Free
researchers with a more sensitive, and more psychologically acetaldehyde levels in blood are very rapidly eliminated
informative, examination of RT data. (half-life less than 30 minutes) and so are therefore
unsuitable. However, acetaldehyde can bind to proteins and
so haemoglobin-bound acetaldehyde has been proposed as a
long-term marker but due to the persistence (2-3 months) can
only be used for assessing long-term alcohol habits (like
CDT).
Several direct, non-oxidative, biomarkers of alcohol
consumption are available including fatty acid ethyl esters
(FAEE), phosphatidylethanol (PEth), ethyl glucuronide
(EtG) and ethyl sulphate (EtS). All are sensitive and specific
biomarkers of alcohol consumption although FAEE and
PEth reflect chronic heavy drinking rather than short-term
consumption [25]. EtG and EtS are complementary markers
Fig. (2). Hypothetical data from a reaction time experiment. and are often measured together. They are short-term
The participant performed the test on a hangover and control day. markers and are detectable for about 5 days after alcohol
The mean of both conditions is 700 milliseconds. consumption. They are also measurable in a number of body
fluids, including hair, meaning that longer-term consumption
can also be assessed. Because of the high sensitivity,
BIOMARKERS OF THE ALCOHOL HANGOVER
‘unintentional’ exposures such as using alcoholic
STATE
mouthwashes will be detectable. The value of a marker such
Alcohol biomarkers have a potential role in providing an as EtG is that its elimination reflects that of alcohol (peak
objective measure of alcohol consumption in alcohol excretion is about 3 hours after that of alcohol) and that it
hangover research studies. This is desirable for a number of has limited inter-individual variation in metabolism due to
reasons – it can counter recall issues of the participants in factors such as age, gender, ethnicity – this allows a more
terms of how much alcohol they have consumed, it can reliable reconstruction of dose. Although EtG is widely
prevent bias by allowing naturalistic studies to be designed reported in the scientific literature with regard to alcohol
where the role of alcohol consumption is not overtly stated. research, this is mostly focused on workplace alcohol testing
Kate Jones (Health & Safety Laboratory, Buxton, UK) and and abstinence programs. Lewis et al. [26] reported that
Gordon Smith (University of Maryland, USA) discussed ethyl glucuronide can cause TLR4-dependent pain and that
potential biomarkers of the alcohol hangover state, and this could have implications for human conditions such as
methodological issues in collecting and storing blood, urine hangover headache. There are several studies underway
and saliva samples. examining the relationship of EtG concentration and
hangover severity and to what extent EtG measurement is
There are a number of potential biomarkers arising from
useful to predict performance impairment during alcohol
both the main and alternate pathways of ethanol metabolism
- oxidative and non-oxidative direct biomarkers and products hangover.
of tissue damage resulting from alcohol consumption. Jorinde Raasveld and Anna Hogewoning (Utrecht
Ideally, biomarkers should correlate with the dose of alcohol, University, Netherlands) discussed the design of a new study
the severity of the hangover, and corresponding performance to determine if people who claim to have no hangovers differ
impairment. from those who do have hangovers after an evening of heavyHangover Research Needs Current Drug Abuse Reviews, 2013, Vol. 6, No. 2 5
alcohol consumption. To this extent, the two groups of social differences in hangover, and provides novel insights into the
drinkers will be compared on cognitive performance etiologic structure of different hangover phenotypes.
measures during a hangover and control day (no alcohol
Sam Royle (Keele University, UK) discussed psycho-
consumed). In addition, urine and saliva samples will be
social correlates of the alcohol hangover. Evidence for
taken to determine EtG and cytokine concentrations as cultural, temporal and contextual differences in the effects
biomarkers of the hangover state.
and definitions of alcohol and alcohol related experiences
Two possible outcome scenarios of the study were [29,30] highlight the importance of non-biological factors in
discussed. First, the data may reveal that people who claim alcohol research. Relatively few studies have examined the
to have no hangover do not show performance decrement relationships between alcohol hangover, mood, personality,
and no changes in EtG and cytokine concentrations. This and other psychosocial correlates such as guilt about
would then suggest that these subjects are different from drinking, however the small body of available evidence
‘normal’ drinkers in that they are not developing the supports the idea of relationships between these variables
unpleasant after effects of alcohol. Alternatively, the study [31,32]. There are issues to be contended with regarding
may show that those who claim no hangover do show previous research. Harburg et al.’s [31] work has become
performance impairment and EtG and cytokine changes. outdated, with more comprehensive, validated measures now
This outcome would suggest that these subjects may not be available for measurement of mood, personality and guilt.
aware of having a hangover. A possible reason for this lack Hesse [32] does not directly address issues of mood and
of awareness may be that these subjects in general have a personality in relation to alcohol hangover, but does relate a
mental state comparable to the hangover state and therefore number of statements representing guilt and regret to the
do not notice the difference with a hangover day. severity of alcohol hangover, however, this study was carried
out with students on holiday, and as such may not represent a
DETERMINANTS OF HANGOVER SEVERITY wider population, with drinking behavior changing while on
holiday. Such evidence does however suggest that an
Besides total alcohol consumption, many factors may understanding of the mood and personality effects in relation
influence hangover severity. These factors may be genetic, to alcohol hangover severity is required to account for
psycho-social and personality differences between individual individual variation in the phenomenon. To achieve this end,
drinkers, but also include beverage type and their congener a proposed naturalistic, correlational study was discussed,
content. designed to look for correlations between measures of mood,
Wendy Slutske (University of Missouri, USA) presented personality, and guilt about drinking, with alcohol hangover
preliminary results from a study with the aims of examining: severity.
(1) sex differences in the occurrence of hangover, (2) the role Besides the total amount of alcohol consumed, it has
of genetic factors in explaining individual differences in been argued that congener content also has an impact on
alcohol-related hangover, and (3) potential sex differences in hangover severity. In addition to anecdotic evidence (i.e.
the genetic contribution to hangover. Participants were high congener drinks such as tequila produce worse
drawn from a large interview survey of 4764 adult hangovers), some experimental studies confirmed than
Australian twins. Analyses were restricted to the 94% of congener-rich beverages produce more severe hangovers
participants who had consumed alcohol in the past year. The [33]. Joris Verster (Utrecht University, The Netherlands)
focus was on four different hangover indices that have been presented the results of a study that aimed to (1) develop a
previously described in the literature: frequency [27,28], ‘congener-index’ of most commonly consumed beverages,
severity [1], susceptibility [27,28], and insensitivity [19]. and (2) examine how congener content and other factors
Frequency of hangover reflected the number of hangovers relate to hangover severity. A survey was conducted among
experienced in the past year. Severity of hangover was Dutch students examining their drinking behavior and latest
defined as the number of hangover symptoms that were alcohol hangover [1]. About half of the participants (n =
experienced during the worst hangover suffered in the past 791) reported having had a hangover during the past month.
year. Hangover susceptibility was quantified as the variance For their last drinking session that resulted in a hangover,
in hangover that remained after statistically controlling for data was collected on the type and number of alcoholic and
the level of alcohol intake in the past year. Hangover non-alcoholic beverages that were consumed. A literature
insensitivity was defined as an individual who had been search was conducted to determine the specific congener
intoxicated at least once in the past year but had not content of each beverage. The amount of carbohydrates,
experienced any hangovers (versus an individual who had proteins, fats, ethanol, methanol, propanol-1, butanol-2,
been intoxicated and had experienced a hangover). isobutanol, butanol-1, 2-methyl-butanol-1 and 3-methyl-
About half of the participants had experienced at least butanol-1 was determined. Hangover severity was assessed
one hangover in the past year; the mean number of with the Alcohol Hangover Severity Scale, AHSS [34], and a
hangovers was six. There were differences between men and 1-item hangover score. The analyses showed that hangover
women in hangover frequency, but not severity, severity scores correlated significantly with the amount of
susceptibility, or insensitivity. There were important genetic carbohydrates, proteins, fats, ethanol, and congeners.
contributions for all four indices of hangover, and this could Regression analyses revealed that 12.6% of the variance of
not be completely explained by differences in the amount of the AHSS could be explained by a model including ‘ethanol
alcohol consumed. This study provides much-needed amount’, ‘butanol-2 amount’, ‘monthly number of
evidence for important genetic underpinnings of individual hangovers’, ‘number of cigarettes smoked’, and ‘gender’.
Separate regression analyses were also performed for men6 Current Drug Abuse Reviews, 2013, Vol. 6, No. 2 Verster et al.
and women. For women, 10.4% of the variance of the AHSS sessions. If hangovers do not modulate near-term drinking,
could be explained by ‘ethanol amount’, ‘butanol-2 amount’, how should we understand the prospective associations
and ‘monthly number of hangovers’. For men, 16.3% of the between hangover measures and later alcohol problems? One
variance of the AHSS could be explained by ‘weekly alcohol possibility is that hangover measures are markers of a
consumption’, ‘butanol-1 amount’, and ‘number of cigarettes broader underlying risk process. This idea is supported by
smoked’. The results confirm that many other factors besides recently published findings from the same sample
total ethanol content contribute to hangover severity, documenting that a low sensitivity to acute alcohol effects is
including congener content, smoking, gender, weekly associated with both frequent hangover and hangover
alcohol consumption, and previously experienced hangovers. insensitivity [28].
Future research should examine these factors, using larger
cohorts to also investigate potential gender differences. Learning Objectives:
• Driving is significantly impaired during alcohol hangover
• Most people who claim hangover immunity do not achieve a
DOES HANGOVER SEVERITY INFLUENCE TIME BAC>0.10 g%
TO NEXT DRINK?
• EtG (ethyl glucuronide) is a promising biomarker of the alcohol
It has been suggested that having a hangover serves as a hangover state
punishment for drinkers that will limit future alcohol • Genetic differences are likely to be an important determinant of
consumption. Advocates of this hypothesis argue it is unwise experiencing hangovers
to develop effective hangover cures since this may lead to • Congeners significantly increase hangover severity
increased alcohol consumption. There is however limited • Having a hangover does not reliably speed or delay the time to the
scientific evidence to support this hypothesis and other next drinking episode.
studies have shown that students do not adapt their drinking
behavior despite having hangovers [35].
Future Research:
Prospective studies have established that frequent • Further examine the genetic influences on alcohol hangover
hangover [36] and an insensitivity to hangover after a • Research into psycho-social and personality correlates of the
challenge dose of alcohol [17] in young adulthood forecast hangover
problematic alcohol involvement and alcohol use disorder • Examine gender and age differences
(AUD) diagnoses years later. To better understand these • Research into hangover resistance and immunity
effects, investigations of the influence of hangover events on
• Examine the effectiveness of biomarkers of the hangover state
near-term drinking behaviors are needed. One possibility is
• Explore the effects of hangover events on other aspects of
that hangover could accelerate drinking if sufferers pursue subsequent drinking behavior, such as amount consumed or time
“hair of the dog” drinking to alleviate hangover symptoms to next binge drinking episode.
[37,38]. This might explain why frequent hangover would
forecast later AUD. A second possibility is that hangovers
serve to punish heavy drinking, delaying or constraining DISCLOSURE OF INTERESTS
future alcohol use [27,38]. If this is the case, drinkers who Joris Verster has received grants / research support from
are insensitive to hangover effects might be at risk because The Dutch Ministry of Infrastructure & the Environment,
they lack this inhibitory mechanism. In this scenario, the Takeda and Red Bull; and has acted as a consultant for
association between frequent hangover and AUD could be a Canadian Beverage Association, Centraal Bureau
marker of a distinct risk process, such as deficiency in the Drogisterijbedrijven, Coleman Frost, Deenox, Red Bull,
ability to learn from punishment. Sanofi-Aventis, Sepracor, Takeda, Transcept, and Trimbos
To explore these questions, Thomas Piasecki (University Institute. Chris Alford has received funding/research support
of Missouri, USA) conducted survival analyses using data from the UK Ministry of Defence, Red Bull, and Sanofi-
from 386 frequent drinkers who participated in a 21-day Aventis. Lauren Owen received funding from the European
Ecological Momentary Assessment investigation. The Union 7th Framework Marie Curie Research Fellowship
analyses involved 2,276 index drinking episodes, of which scheme, Glaxosmithkline, Cultech LTD, Naturex, Danone,
463 (20%) were followed by hangover. Results revealed Dairy Health Innovations, and Kraft Foods. James A.
modest and inconsistent effects of hangover events on time Grange, and Richard Stephens received funding from the
to the next drink. It is possible that hangover truly has little European Union 7th Framework Marie Curie Research
impact on drinking decisions or that the absence of strong Fellowship scheme. Gordon Smith was supported by a grant
effects arises because hangover has heterogeneous effects from the U.S. National Institute on Alcohol Abuse and
across drinkers. An important caveat is that the findings were Alcoholism (1R01AA018313). The other authors have
obtained in a naturalistic study and thus examined the impact nothing to disclose.
of hangovers among individuals who actually experience
them in daily life. Individuals who find hangovers punishing ACKNOWLEDGEMENTS
may regulate consumption, avoiding hangovers, and
therefore not contributing information to the modeled risk The 5th meeting of the Alcohol Hangover Research
set. Additionally, the analyses did not address whether Group was hosted by Keele University, U.K. More
hangover influences other important aspects of drinking, information on the Alcohol Hangover Research Group can
such as the amount of alcohol consumed in subsequent be found at www.alcoholhangover.comHangover Research Needs Current Drug Abuse Reviews, 2013, Vol. 6, No. 2 7
REFERENCES [19] Howland J, Rohsenow DJ, Edwards EM. Are some drinkers
resistant to hangover: A literature review. Curr Drug Abuse Rev
[1] Penning R, McKinney A, Verster JC. Alcohol hangover symptoms 2008, 1: 42-46.
and their contribution to overall hangover severity. Alcohol [20] Tolstrup, J, Stephens, R, Grønbæk, M. Does the severity of
Alcohol 2012, 47: 248-252 hangovers decline with age? Survey of the prevalence of severe
[2] Ling J, Stephens R, Heffernan TM. Cognitive and psychomotor hangover in different age groups. Alcoholism: Clin Exp Res. DOI:
performance during alcohol hangover. Curr Drug Abuse Rev 2010, 10.1111/acer.12238
3:80–87 [21] Kanny D, Liu Y, Brewer RD. Binge drinking – United States,
[3] Verster JC, Stephens R, Penning R, Rohsenow D, McGeary J, Levy 2009. MMWR Surveill Summ 2011, 60 (supplement): 101-104.
D, McKinney A, Finnigan F, Piasecki TM, Adan A, Batty GD, [22] Louwerens JW, Gloerich ABM, De Vries G, Brookhuis KA,
Fliervoet LAL, Heffernan T, Howland J, Kim D-J, Kruisselbrink O’Hanlon JF. The relationship between drivers’ blood alcohol
LD, Ling J, McGregor n, Murphy RJL, van Nuland M, Oudelaar concentration (BAC) and actual driving performance during high
AM, Parkes A, Prat G, Reed N, Slutske WS, Smith G, Young M, speed travel. In: Noordzij, P.C. and Roszbach R. (Eds), Alcohol,
on behalf of the Alcohol Hangover Research Group. The Alcohol Drugs and Traffic Safety. 1987. Amsterdam: Excerpta Medica.
Hangover Research Group consensus statement on best practice in p.183-192.
alcohol hangover research. Curr Drug Abuse Rev 2010, 3:116-127. [23] Borkenstein RF, Crowther RP, Shumate RP, Ziel HB, Zylman R.
[4] Stephens R, Ling J, Heffernan TM, Heather N, Jones K. A review The role of the drinking driver in traffic accidents. 1964. Dept. of
of the literature on the cognitive effects of alcohol hangover. Police Administration, Indiana University, Bloomington, Indiana
Alcohol Alcohol 2008, 43:163–170 [24] Substance Abuse and Mental Health Services Administration.
[5] Pittler MH, Verster JC, Ernst E. Interventions for preventing or (2012). The Role of Biomarkers in the Treatment of Alcohol Use
treating alcohol hangover: systematic review of randomized Disorders, 2012 Revision. Advisory, Volume 11, Issue 2.
controlled trials. BMJ 2005, 331(7531): 1515-1518. [25] Helander A, Péter O, Zheng Y. Monitoring of the alcohol
[6] Verster JC, Penning R. Treatment and prevention of alcohol biomarkers PEth, CDT and EtG/EtS in an outpatient treatment
hangover. Curr Drug Abuse Rev 2010, 3: 103-109. setting. Alcohol Alcohol 2012, 47: 552-557.
[7] Gjerde H, Christophersen AS, Moan IS, Yttredal B, Walsh JM, [26] Lewis SS, Hutchinson MR, Zhang Y, Hund DK, Maier SF, Rice
Normann PT, Mørland J. Use of alcohol and drugs by Norwegian KC, Watkins LR. Glucuronic acid and the ethanol metabolite ethyl-
employees: A pilot study using questionnaires and analysis of oral glucuronide cause toll-like receptor 4 activation and enhanced pain.
fluid. J Occup Med Toxicol 2010, 15:13. Brain Behav Immun 2013, 30 :24-32.
[8] Verster JC, van der Maarel M, McKinney A, Olivier B, de Haan L. [27] Piasecki TM, Robertson BM, Epler AJ. Hangover and alcohol use
Driving during alcohol hangover among Dutch professional truck disorders: Existing evidence and potential mechanisms. Curr Drug
drivers. Traffic Injury Prevention, in press Abuse Rev 2010, 3: 92-102.
[9] Mets MAJ, Kuipers E, de Senerpont Domis LM, Leenders M, [28] Piasecki TM, Alley KJ, Slutske WS, Wood PK, Sher KJ, Shiffman
Volkerts ER, Olivier B, Verster JC. Effects of alcohol highway S, Heath AC. Low sensitivity to alcohol: Relations with hangover
driving in the STISIM driving simulator. Human Psychopharmacol occurrence and susceptibility in an Ecological Momentary
2011,26: 434-439 Assessment investigation. J Studies Alcohol Drugs 2012, 73: 925-
[10] Verster JC, Roth T. Standard Operation Procedures for conducting 932.
the on-the-road driving test, and measurement of the Standard [29] MacAndrew G, Edgerton RB. Drunken Comportment. Percheron
Deviation of Lateral Position (SDLP). Int J Gen Med 2011, 4: 359- Press, New York, 1969
371. [30] Kuendig H, Plant MA, Plant ML, Miller P, Kuntsche S, Gmel G.
[11] Verster JC, Bervoets AC, de Klerk S, Roth T. Lapses of attention Alcohol related adverse consequences: cross-cultural variations in
as outcome measure of the on-the-road driving test. attribution process among young adults. Eur J Public Health 2008,
Psychopharmacology, in press. 18, 4: 386-391
[12] Liu YC, Ho CH. Effects of different breath alcohol concentration [31] Harburg E, Gunn R, Gleiberman L, DiFranceisco w, Schork A.
and post alcohol impairment on driving behavior and task Psychosocial factors, alcohol use, and hangover signs among social
performance, Traffic Injury Prev 2010, 4: 334-341. drinkers: a reappraisal. J Clin Epidemiol 1993, 46, 5: 413-422.
[13] Verster JC, Roth T. Vigilance decrement during the on-the-road
driving tests: The importance of time-on-task in [32] Hesse M, Tutenges S. Evening experiences versus drinking
psychopharmacological research. Accid Anal Prev 2013, 58: 244- indicators as predictors of hangover on a summer holiday. Am J
248. Addictions 2009, 18: 130-134.
[14] Global status report on road safety: time for action. Geneva, World [33] Rohsenow DJ, Howland J. The role of beverage congeners in
Health Organization, 2009 hangover and other residual effects of alcohol intoxication: a
(www.who.int/violence_injury_prevention/road_safety_status/2009 review. Curr Drug Abuse Rev 2010, 3: 76-79.
). [34] Penning R, McKinney A, Bus LD, Olivier B, Slot K, Verster JC.
[15] Ylikahri RH, Pösö AR, Huttunen MMO, Hillbom ME. Alcohol Measurement of alcohol hangover severity: development of the
intoxication and hangover: effects on plasma electrolyte Alcohol Hangover Severity Scale (AHSS). Psychopharmacology
concentrations and acid-base balance. Scan J Clin Lab Invest 1974, 2013, 225: 803-810.
34: 327-336. [35] Mallett KA, Lee CM, Neighbors C, Larimer ME, Turrisi R. Do we
[16] Penning R, van Nuland M, Fliervoet LAL, Olivier B, Verster JC. learn from our mistakes? An examination of the impact of negative
The pathology of alcohol hangover. Curr Drug Abuse Rev 2010, 3: alcohol-related consequences on college students’ drinking patterns
68-75. and perceptions. J Stud Alcohol 2006, 67: 269-276.
[17] Rohsenow DJ, Howland J, Winter M, Bliss CA, Littlefield CA, [36] Piasecki TM, Sher KJ, Slutske WS, Jackson KM. Hangover
Heeren TC, Calise TV. Hangover sensitivity after controlled frequency and risk for alcohol use disorders: Evidence from a
alcohol administration as predictor of post-college drinking. J longitudinal high-risk study. J Abnormal Psychol 2005, 114: 223-
Abnormal Psychol 2012, 121: 270–275. 234.
[18] Rohsenow DJ, Howland J, Minsky SJ, Greece J, Almeida A, [37] Newlin DB, Pretorious MB. Sons of alcoholics report greater
Roehrs TA. The Acute Hangover Scale: A new measure of hangover symptoms than sons of nonalcoholics: A pilot study.
immediate hangover symptoms. Addictive Behav 2007, 32: 1314- Alcoholism Clin Exp Res 1990, 14: 713–716.
1320. [38] Span SA, Earleywine M. Familial risk for alcoholism and hangover
symptoms. Addictive Behav 1999, 24: 121-125.
Received: August 13, 2012 Revised: May 24, 2013 Accepted: May 29, 2013You can also read