HealtH effects of particulate matter - Policy implications for countries in eastern Europe, Caucasus and central Asia - WHO/Europe
←
→
Page content transcription
If your browser does not render page correctly, please read the page content below
Health effects   Policy implications for
                        countries in eastern Europe,
of particulate matter   Caucasus and central Asia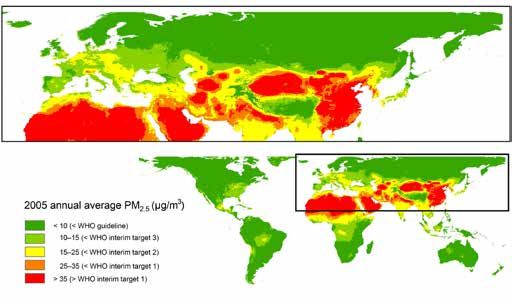
Abstract

This paper summarizes the evidence about the health effects of air pollution from particulate matter and their
implications for policy-makers, with the aim of stimulating the development of more effective strategies to reduce
air pollution and its health effects in the countries of eastern Europe, the Caucasus and central Asia.

Keywords
AIR POLLUTION - adverse effects
ENVIRONMENT AND PUBLIC HEALTH
ENVIRONMENTAL POLLUTANTS
HEALTH POLICY
PARTICULATE MATTER - analysis
POLICY MAKING

  Address requests about publications of the WHO Regional Office for Europe to:

           Publications
           WHO Regional Office for Europe
           UN City, Marmorvej 51
           DK-2100 Copenhagen Ø, Denmark

   Alternatively, complete an online request form for documentation, health information, or for permission
   to quote or translate, on the Regional Office web site (http://www.euro.who.int/pubrequest).

ISBN 978 92 890 0001 7

© World Health Organization 2013
All rights reserved. The Regional Office for Europe of the World Health Organization welcomes requests for
permission to reproduce or translate its publications, in part or in full.

The designations employed and the presentation of the material in this publication do not imply the expression of
any opinion whatsoever on the part of the World Health Organization concerning the legal status of any country,
territory, city or area or of its authorities, or concerning the delimitation of its frontiers or boundaries. Dotted lines
on maps represent approximate border lines for which there may not yet be full agreement.

The mention of specific companies or of certain manufacturers’ products does not imply that they are endorsed or
recommended by the World Health Organization in preference to others of a similar nature that are not mentioned.
Errors and omissions excepted, the names of proprietary products are distinguished by initial capital letters.

All reasonable precautions have been taken by the World Health Organization to verify the information contained in
this publication. However, the published material is being distributed without warranty of any kind, either express
or implied. The responsibility for the interpretation and use of the material lies with the reader. In no event shall
the World Health Organization be liable for damages arising from its use. The views expressed by authors, editors,
or expert groups do not necessarily represent the decisions or the stated policy of the World Health Organization.

Cover photo: © gnubier - pixelio.de
Contents

Acknowledgements . . . . . . . . . . . . . . . . . . . . . . . . . . . . . . . . . . . . . . . . . . . . . . . . . . . . . . . . . . II

Abbreviations . . . . . . . . . . . . . . . . . . . . . . . . . . . . . . . . . . . . . . . . . . . . . . . . . . . . . . . . . . . . . . . . II

Introduction and context . . . . . . . . . . . . . . . . . . . . . . . . . . . . . . . . . . . . . . . . . . . . . . . . . . . . . 2

What is particulate matter? . . . . . . . . . . . . . . . . . . . . . . . . . . . . . . . . . . . . . . . . . . . . . . . . . . . 2

Where does PM come from? . . . . . . . . . . . . . . . . . . . . . . . . . . . . . . . . . . . . . . . . . . . . . . . . . . 3

What are the levels of and trends in PM in the WHO European Region ? . . . . . . . 4

What are the health effects of PM? . . . . . . . . . . . . . . . . . . . . . . . . . . . . . . . . . . . . . . . . . . . 6

What is the burden of disease related to exposure to PM? . . . . . . . . . . . . . . . . . . . . 7

WHO AQGs  . . . . . . . . . . . . . . . . . . . . . . . . . . . . . . . . . . . . . . . . . . . . . . . . . . . . . . . . . . . . . . . . . . 8

Evidence on effects of air quality improvements . . . . . . . . . . . . . . . . . . . . . . . . . . . . . . 9

                Follow-up to the Harvard Six Cities Study, United States . . . . . . . . . . . . . . . . . . . . . . 9

                Short-term decrease in industrial emissions, United States  . . . . . . . . . . . . . . . . . . . 9

                Respiratory health studies and air pollution abatement measures,
                Switzerland . . . . . . . . . . . . . . . . . . . . . . . . . . . . . . . . . . . . . . . . . . . . . . . . . . . . . . . . . . . . . . .  10

Air quality management and policy  . . . . . . . . . . . . . . . . . . . . . . . . . . . . . . . . . . . . . . . .  11

Conclusions  . . . . . . . . . . . . . . . . . . . . . . . . . . . . . . . . . . . . . . . . . . . . . . . . . . . . . . . . . . . . . . . .  12

References  . . . . . . . . . . . . . . . . . . . . . . . . . . . . . . . . . . . . . . . . . . . . . . . . . . . . . . . . . . . . . . . . .  13
Acknowledgements

     This publication was prepared by the Joint WHO/Convention Task Force on Health Aspects of
     Air Pollution according to the Memorandum of Understanding between the United Nations
     Economic Commission for Europe and the WHO Regional Office for Europe. The Regional
     Office thanks the Swiss Federal Office for the Environment for its financial support of the
     work of the Task Force. The Task Force on Health work is coordinated by the WHO Regional
     Office’s European Centre for Environment and Health, Bonn.

     Convention on Long-Range Transboundary Air Pollution

     Abbreviations

     AQG     air quality guidelines
     EECCA   eastern Europe, the Caucasus and central Asia
     PAH     polycyclic aromatic hydrocarbon
     PM      particulate matter
     UNECE   United Nations Economic Commission for Europe

II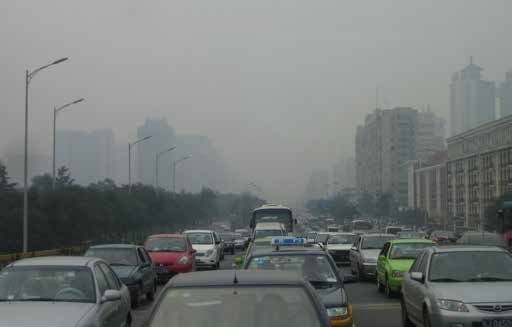
III
Introduction and context

    In most countries in the region covered by the United Nations Economic Commission for
    Europe (UNECE), ambient air quality has improved considerably in the last few decades. This
    has been achieved by a range of measures to reduce harmful air emissions, including those
    stipulated by the various protocols under the Convention on Long-range Transboundary
    Air Pollution (1). There is, however, convincing evidence that current levels of air pollution
    still pose a considerable risk to the environment and to human health.

    Recently, the Executive Body of the Convention has adopted amendments to the
    Convention’s 1999 Gothenburg Protocol to Abate Acidification, Eutrophication and Ground-
    level Ozone. Following years of negotiations, the approved revised text of the Protocol now
    specifies national emission reduction commitments for main air pollutants to be achieved
    by the UNECE Parties by 2020 and beyond. The revised Protocol includes, for the first time,
    commitments to reduce the emission of fine particulate matter (PM2.5). Furthermore, black
    carbon or soot is now included in the revision as an important component of PM2.5. Black
    carbon is an air pollutant which both affects health and contributes to climate change (2).

    What is particulate matter?

    PM is a widespread air pollutant, consisting of a mixture of solid and liquid particles
    suspended in the air.

    Commonly used indicators describing PM that are relevant to health refer to the mass
    concentration of particles with a diameter of less than 10 µm (PM10) and of particles with
    a diameter of less than 2.5 µm (PM2.5). PM2.5, often called fine PM, also comprises ultrafine
    particles having a diameter of less than 0.1 µm. In most locations in Europe, PM2.5 constitutes
    50–70% of PM10.

    PM between 0.1 µm and 1 µm in diameter can remain in the atmosphere for days or weeks
    and thus be subject to long-range transboundary transport in the air.

    PM is a mixture with physical and chemical characteristics varying by location. Common
    chemical constituents of PM include sulfates, nitrates, ammonium, other inorganic ions such
    as ions of sodium, potassium, calcium, magnesium and chloride, organic and elemental
    carbon, crustal material, particle-bound water, metals (including cadmium, copper, nickel,
    vanadium and zinc) and polycyclic aromatic hydrocarbons (PAH). In addition, biological
    components such as allergens and microbial compounds are found in PM.
2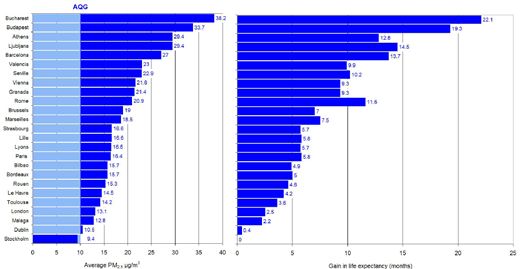
Where does PM come from?

Particles can either be directly emitted into the air (primary PM) or be formed in the
atmosphere from gaseous precursors such as sulfur dioxide, oxides of nitrogen, ammonia
and non-methane volatile organic compounds (secondary particles).

Primary PM and the precursor gases can have both man-made (anthropogenic) and natural
(non-anthropogenic) sources.

Anthropogenic sources include combustion engines (both diesel and petrol), solid-fuel
(coal, lignite, heavy oil and biomass) combustion for energy production in households and
industry, other industrial activities (building, mining, manufacture of cement, ceramic and
bricks, and smelting), and erosion of the pavement by road traffic and abrasion of brakes
and tyres. Agriculture is the main source of ammonium.

Secondary particles are formed in the air through chemical reactions of gaseous pollutants.
They are products of atmospheric transformation of nitrogen oxides (mainly emitted by
traffic and some industrial processes) and sulfur dioxide resulting from the combustion of
sulfur-containing fuels. Secondary particles are mostly found in fine PM.

Soil and dust re-suspension is also a contributing source of PM, particularly in arid areas or
during episodes of long-range transport of dust, for example from the Sahara to southern
Europe.

                                                                                             Photo: © Martina Böhner - pixelio.de

                                                                                                                                    3
What are the levels of and trends in PM
in the WHO European Region1 ?
The WHO Environment and Health Information System (ENHIS), which is based to a
large extent on data submitted by European Union (EU) member states to the European
Environment Agency AirBase (3), includes PM10 monitoring data from urban and suburban
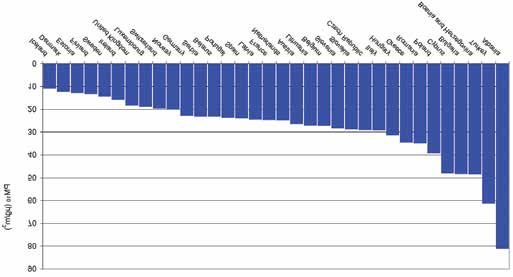
background locations. Fig. 1 presents the population exposure, expressed as annual mean
concentration of PM10, weighted by the population in cities with data, in 403 cities in 34
WHO European Member States for 2010. In only 9 of these 34 Member States, PM10 levels
in at least some cities are below the annual WHO air quality guideline (AQG) level of 20
µg/m3. Almost 83% of the population of the cities for which PM data exist is exposed
to, PM10 levels exceeding the AQG levels. Although this proportion remains high, it is an
improvement compared to previous years, with average PM10 levels slowly decreasing in
most countries in the last decade.
Fig. 1.
Population-weighted annual mean PM10 in cities by WHO European Member State, 2010
Source: WHO Regional Office for Europe (4).
On the other hand, monitoring of PM10 and PM2.5 is very limited in countries in eastern
Europe, the Caucasus and central Asia (EECCA), with only a small number of monitoring
4
1 The WHO European Region includes 53 countries stretching from the Atlantic Ocean to the Pacific Ocean, with
a population of almost 900 million people.stations in Belarus, the Russian Federation (Moscow) and Uzbekistan (one in Tashkent and
one in Nukus). Initial data from the two Uzbek cities indicate that PM10 and PM2.5 levels are
high in comparison with most of the other cities with PM monitoring in the Region. While
the levels in Nukus may be affected by dust storms (which are frequent in that area), various
combustion sources may be predominant in Tashkent.
The proper assessment of levels of and trends in PM in EECCA countries requires PM10 and/or
PM2.5 monitoring in more locations in those countries. The assessment of PM concentrations
requires continuous monitoring conducted for 24 hours daily for 365 days a year, with
standardized methods or methods equivalent to the standard. Quantitative knowledge
about sources and levels of and trends in emissions of primary particles and precursor gases
plays an important role in finding the best control strategy for reducing risks.
In view of the scarcity of ground-level data for PM, remote (satellite) sensing combined with
modelling and existing surface measurements has recently been used for the assessment
of population exposure at country level. Recent estimates have been published for PM2.5
concentrations using this technology as part of the Global Burden of Diseases, Injuries
and Risk Factors Project (5) (see Fig. 2). Further development of these methods and their
precision depends to a large extent on the availability of surface measurements in all regions
of the world.
Fig. 2.
Estimated 2005 annual average PM2.5 concentrations (µg/m3), presented according to the
WHO AQG and interim target values
Source: Michael Brauer, personal communication based on (5).
5What are the health effects of PM?
PM10 and PM2.5 include inhalable particles that are small enough to penetrate the thoracic
region of the respiratory system. The health effects of inhalable PM are well documented.
They are due to exposure over both the short term (hours, days) and long term (months,
years) and include:
• respiratory and cardiovascular morbidity, such as aggravation of asthma, respiratory
symptoms and an increase in hospital admissions;
• mortality from cardiovascular and respiratory diseases and from lung cancer.
There is good evidence of the effects of short-term exposure to PM10 on respiratory health,
but for mortality, and especially as a consequence of long-term exposure, PM2.5 is a stronger
risk factor than the coarse part of PM10 (particles in the 2.5–10 µm range). All-cause daily
mortality is estimated to increase by 0.2–0.6% per 10 µg/m3 of PM10 (6,7). Long-term
exposure to PM2.5 is associated with an increase in the long-term risk of cardiopulmonary
mortality by 6–13% per 10 µg/m3 of PM2.5 (8–10).
Susceptible groups with pre-existing lung or heart disease, as well as elderly people and
children, are particularly vulnerable. For example, exposure to PM affects lung development
in children, including reversible deficits in lung function as well as chronically reduced lung
growth rate and a deficit in long-term lung function (4). There is no evidence of a safe level
of exposure or a threshold below which no adverse health effects occur. The exposure is
ubiquitous and involuntary, increasing the significance of this determinant of health.
At present, at the population level, there is not enough evidence to identify differences in
the effects of particles with different chemical compositions or emanating from various
sources (11). It should be noted, however, that the evidence for the hazardous nature of
combustion-related PM (from both mobile and stationary sources) is more consistent than
that for PM from other sources (12). The black carbon part of PM2.5, which results from
incomplete combustion, has attracted the attention of the air quality community owing to
the evidence for its contribution to detrimental effects on health as well as on climate. Many
components of PM attached to black carbon are currently seen as responsible for health
effects, for instance organics such as PAHs that are known carcinogens and directly toxic
to the cells, as well as metals and inorganic salts. Recently, the exhaust from diesel engines
(consisting mostly of particles) was classified by the International Agency for Research on
Cancer as carcinogenic (Group 1) to humans (13). This list also includes some PAHs and
related exposures, as well as the household use of solid fuels (14,15).
6What is the burden of disease
related to exposure to PM?
It is estimated that approximately 3% of cardiopulmonary and 5% of lung cancer deaths
are attributable to PM globally. In the European Region, this proportion is 1–3% and 2–5%,
respectively, in various subregions (16). Results emerging from a recent study indicate
that the burden of disease related to ambient air pollution may be even higher. This study
estimates that in 2010, ambient air pollution, as annual PM2.5, accounted for 3.1 million
deaths and around 3.1% of global disability-adjusted life years (17).
Exposure to PM2.5 reduces the life expectancy of the population of the Region by about
8.6 months on average. Results from the scientific project Improving Knowledge and
Communication for Decision-making on Air Pollution and Health in Europe (Aphekom),
which uses traditional health impact assessment methods, indicate that average life
expectancy in the most polluted cities could be increased by approximately 20 months
if the long-term PM2.5 concentration was reduced to the WHO (AQG) annual level (Fig. 3).
Fig. 3.
Predicted average gain in life expectancy (months) for people aged 30 years for a reduction
in average annual levels of PM2.5 down to the WHO AQG annual mean level of 10µg/m3 in
25 European cities participating in the Aphekom project
Source: based on Medina (18).
7WHO AQGs
WHO last revised its AQG values for PM in 2005, as follows:
• for PM2.5: 10 µg/m3 for the annual average and 25 µg/m3 for the 24-hour mean (not to be
exceeded for more than 3 days/year);
• for PM10: 20 μg/m3 for the annual average and 50 μg/m3 for the 24-hour mean.
In addition to these guideline values, the AQGs provide interim targets for each air pollutant,
aimed at promoting a gradual shift to lower concentrations in highly polluted locations.
If these targets were to be achieved, significant reductions in risks for acute and chronic
health effects from air pollution could be expected. Progress towards the guideline values
should, however, be the ultimate objective. As no threshold for PM has been identified below
which no damage to health is observed, the recommended values should be regarded as
representing acceptable and achievable objectives to minimize health effects in the context
of local constraints, capabilities and public health priorities.
WHO is currently developing indoor air guidelines for household combustion of fuels for
cooking, heating and lighting. These will provide recommendations for household fuels
and technologies that will enable progress towards the AQGs.
Photo: © Dieter Schütz - pixelio.de
8Evidence on effects of
air quality improvements
There is consistent evidence that lower air pollution levels following a sustained, long-term
intervention result in health benefits for the population, with improvements in population
health occurring soon (a few years) after the reduction in pollution. Several successful
interventions and accountability studies have been evaluated (19,20). A few examples are
summarized below.
Follow-up to the Harvard Six Cities Study, United States
A group of adults living in six cities in the United States was followed from 1974 to 2009 in
order to estimate the effects of air pollution on mortality. Overall, PM2.5 concentrations had
decreased to below 15 µg/m3 by 2000 (except in one city where levels were below 18 µg/
m3). The main finding was that a 2.5 µg/m3 decrease in the annual average level of PM2.5 was
associated with a 3.5% reduction in all-cause mortality (21–23). Results show associations
between chronic exposure to PM2.5 and all-cause, cardiovascular and lung cancer mortality,
with health effects seen at any PM concentration. Results suggest that the critical period
of exposure to PM2.5 for the associated health effects is one year for all-cause mortality,
implying that health improvements can be expected to start almost immediately after a
reduction in air pollution. In a related study, but using different data, it was demonstrated
that the reduction in fine particulate air pollution in the United States in the 1980s and
1990s accounted for as much as 15% of the 2.7-year overall increase in life expectancy that
had occurred in that period (24).
Short-term decrease in industrial emissions, United States
A copper smelter strike in 1967–1968 in four states, and the closure and reopening of a
steel mill in Utah Valley in 1986–1987, are two examples of unplanned events which had
a positive impact on health by decreasing air pollution concentrations in specific areas.
The copper smelter strike led to a 60% drop in regional sulfur dioxide concentrations over
eight months and was associated with a 2.5% decrease in mortality (25). In the Utah Valley,
the closure of the steel mill, which was the primary source of PM10 in the area, lasted for 13
months and led to a decrease in PM10 levels of approximately 50% during the closure in
winter compared to the previous winter when the mill was operating. Hospital admissions
for children were approximately three times lower and bronchitis and asthma admissions
were halved when the mill was closed (26). Furthermore, the reported 3.2% drop in daily
numbers of deaths was associated with a simultaneous fall in PM10 levels of approximately
15 μg/m3 while the steel mill was closed, the strongest association being with respiratory
deaths (27).
9Respiratory health studies and air pollution abatement
measures, Switzerland
The Swiss Study on Air Pollution and Lung Diseases in Adults assessed lung diseases in
adults from eight Swiss communities in 1991 and again in 2002. Overall exposure to outdoor
PM10 estimated at each individual’s residence fell by an average of 6.2 µg/m3 over the
study period, to reach a range of approximately 5 µg/m3 to 35 µg/m3 in 2002, depending
on the community. This reduction in particle levels was associated with attenuated age-
related annual declines in various lung function parameters. The falling PM10 levels were also
associated with fewer reports of respiratory symptoms such as regular cough, chronic cough
or phlegm, and wheezing and breathlessness (28,29). As part of a separate investigation,
children from nine Swiss communities were followed between 1992 and 2001 as part
of the Swiss Study on Childhood Allergy and Respiratory Symptoms with respect to Air
Pollution, Climate and Pollen. Falling levels of regional PM10 were associated with a declining
prevalence of various respiratory symptoms, including chronic cough, bronchitis, common
cold, nocturnal dry cough and conjunctivitis symptoms (30). These findings suggest that
modest as well as drastic improvements in ambient air quality are beneficial for respiratory
health in both children and adults.
These examples of successful interventions show that decreased levels of particulate
air pollution can substantially diminish total, respiratory and cardiovascular death rates.
Benefits can be expected at almost any reduction in levels of air pollution, which suggests
that further policy efforts that reduce fine PM air pollution are likely to have continuing
favourable effects on public health.
Photo: © Uwe R. Dietz - pixelio.de
10Air quality management and policy
Up to 80% of particulate air pollution in EECCA countries can be reduced with currently
available technologies (31). The reduction of outdoor air pollutants in general, and PM
in particular, requires concerted action by public authorities, industry and individuals at
national, regional and even international levels. Responsible authorities with a vested
interest in air pollution management include the environment, transport, land planning,
public health, housing and energy sectors. Since the burden of air pollution on health is
significant at even relatively low concentrations, the effective management of air quality
is necessary to reduce health risks to a minimum.
The development and exchange of information on policies, strategies and technical
measures to reduce emissions are part of the fundamental principles of the Convention
on Long-range Transboundary Air Pollution. The Working Group on Strategies and Reviews
of the Convention, and in particular its Expert Group on Techno-economic Issues (32),
maintains the database of information on control technologies for air pollution abatement
and their costs. An example of its work is provided by the Group’s 2010 report summarizing
progress in work to reduce dust emissions from small combustion installations (33).
There are co-benefits to addressing particulate air pollution that go beyond just the positive
impact on health. For example, reductions in black carbon emissions from the strategic
mitigation of combustion sources will also simultaneously reduce global warming (34).
Finally, integrated policies on urban planning and transport can encourage the use of
cleaner modes of transport and lead to changes in individual behaviour by promoting
walking, cycling and increased commuting by public transport. These policies contribute
to cleaner air while promoting physical activity and largely benefiting public health.
11Conclusions
PM is a widespread air pollutant, present wherever people live.
The health effects of PM10 and PM2.5 are well documented. There is no evidence of a safe
level of exposure or a threshold below which no adverse health effects occur.
Since even at relatively low concentrations the burden of air pollution on health is significant,
effective management of air quality aiming to achieve WHO AQG levels is necessary to
reduce health risks to a minimum.
Monitoring of PM10 and/or PM2.5 needs to be improved in many countries to assess
population exposure and to assist local authorities in establishing plans for improving air
quality.
There is evidence that decreased levels of particulate air pollution following a sustained
intervention result in health benefits for the population assessed. These benefits can be
seen with almost any decrease in level of PM. The health and economic impacts of inaction
should be assessed.
Particulate air pollution can be reduced using current technologies.
Interventions resulting in a reduction in the health effects of air pollution range from
regulatory measures (stricter air quality standards, limits for emissions from various
sources), structural changes (such as reducing energy consumption, especially that based on
combustion sources, changing modes of transport, land use planning) as well as behavioural
changes by individuals by, for example, using cleaner modes of transport or household
energy sources.
There are important potential co-benefits of integrating climate change and air pollution
management strategies, as evidenced by the importance of the PM indicator and climate
change contributor black carbon.
Photo: © Klaus Steves - pixelio.de
12References
1. Convention on Long-range Transboundary Air Pollution [web site]. Geneva, United
Nations Economic Commission for Europe, 2012 (http://www.unece.org/env/lrtap/,
accessed 27 October 2012).
2. Janssen NAH et al. Health effects of black carbon. Copenhagen, WHO Regional Office for
Europe, 2012 (http://www.euro.who.int/en/what-we-do/health-topics/environment-
and-health/air-quality/publications/2012/health-effects-of-black-carbon, accessed 28
October 2012).
3. AirBase: public air quality database [online database]. Copenhagen, European Environ-
ment Agency, 2012 (http://www.eea.europa.eu/themes/air/airbase, accessed 27 October
2012).
4. Exposure to air pollution (particulate matter) in outdoor air. Copenhagen, WHO Regional
Office for Europe, 2011 (ENHIS Factsheet 3.3) (http://www.euro.who.int/__data/assets/
pdf_file/0018/97002/ENHIS_Factsheet_3.3_July_2011.pdf, accessed 28 October 2012).
5. Brauer M et al. Exposure assessment for estimation of the global burden of disease
attributable to outdoor air pollution. Environmental Science and Technology, 2012, 46:
652–660.
6. Air quality guidelines: global update 2005. Particulate matter, ozone, nitrogen dioxide and
sulfur dioxide. Copenhagen, WHO Regional Office for Europe, 2006 (http://www.euro.
who.int/en/what-we-do/health-topics/environment-and-health/air-quality/publica-
tions/ pre2009/air-quality-guidelines.-global-update-2005.-particulate-matter,-ozone,-
nitrogen-dioxide-and-sulfur-dioxide, accessed 28 October 2012).
7. Samoli E et al. Acute effects of ambient particulate matter on mortality in Europe and
North America: results from the APHENA Study. Environmental Health Perspectives, 2008,
116(11):1480–1486.
8. Beelen R et al. Long-term effects of traffic-related air pollution on mortality in a Dutch
cohort (NLCS-AIR Study). Environmental Health Perspectives, 2008, 116(2):196–202.
9. Krewski D et al. Extended follow-up and spatial analysis of the American Cancer Society
linking particulate air pollution and mortality. Boston, MA, Health Effects Institute, 2009
(HEI Research Report 140).
10. Pope CA III et al. Lung cancer, cardiopulmonary mortality, and long-term exposure to
fine particulate air pollution. Journal of the American Medical Association, 2002, 287(9):
1132–1141.
11. Stanek LW et al. Attributing health effects to apportioned components and sources of
particulate matter: an evaluation of collective results. Atmospheric Environment, 2011,
45:5655–5663.
12. Health relevance of particulate matter from various sources. Report of a WHO Workshop.
Copenhagen, WHO Regional Office for Europe, 2007 (www.euro.who.int/document/
E90672.pdf, accessed 28 October 2012).
13. IARC: diesel engine exhaust carcinogenic. Lyons, International Agency for Research on
Cancer, 2012 (Press release No. 213) (http://www.iarc.fr/en/media-centre/iarcnews/2012/
mono105-info.php, accessed 28 October 2012). 1314. Some non-heterocyclic polycyclic aromatic hydrocarbons and some related exposures.
Lyons, International Agency for Research on Cancer, 2010 (IARC Monographs on the
Evaluation of Carcinogenic Risks to Humans, Vol. 92) (http://monographs.iarc.fr/ENG/
Monographs/vol92/mono92.pdf, accessed 27 October 2012).
15. Household use of solid fuels and high-temperature frying. Lyons, International Agency for
Research on Cancer, 2010 (IARC Monographs on the Evaluation of Carcinogenic Risks
to Humans, Vol. 95) (http://monographs.iarc.fr/ENG/Monographs/vol95/mono95.pdf,
accessed 28 October 2012).
16. Cohen AJ et al. Urban air pollution. In: Ezzati M et al., eds. Comparative quantification of
health risks. Global and regional burden of disease attributable to selected major factors.
Geneva, World Health Organization, 2004, 2(17):1354–1433 (http://www.who.int/health
info/global_burden_disease/cra/en/index.html, accessed 28 October 2012).
17. Lim SS et al. A comparative risk assessment of burden of disease and injury attributable
to 67 risk factors and risk factor clusters in 21 regions, 1990–2010: a systematic analysis
for the Global Burden of Disease Study 2010. Lancet, 2012, 380: 2224-2260.
18. Medina S. Summary report of the APHEKOM project 2008–2011. Saint-Maurice Cedex,
Institut de Veille Sanitaire, 2012 (www.endseurope.com/docs/110302b.pdf, accessed
28 October 2012).
19. Henschel S et al. Air pollution interventions and their impact on public health. Interna-
tional Journal of Public Health, 2012, 57(5):757–768 (DOI 10.1007/s00038-012-0369-6,
accessed 28 October 2012).
20. Van Erp AM et al. Progress in research to assess the effectiveness of air quality inter-
ventions towards improving public health. Air Quality and Atmospheric Health, 2012,
5:217–230.
21. Dockery DW et al. An association between air pollution and mortality in six U.S. cities.
The New England Journal of Medicine, 1993, 329(24):1753–1759.
22. Laden F et al. Reduction in fine particulate air pollution and mortality: extended follow-
up of the Harvard Six Cities Study. American Journal for Respiratory Critical Care Medicine,
2006, 173(6):667–672.
23. Lepeule J et al. Chronic exposure to fine particles and mortality: an extended follow-up
of the Harvard Six Cities Study from 1974 to 2009. Environmental Health Perspectives,
2012, 120:965–970.
24. Pope CA III et al. Fine-particulate air pollution and life expectancy in the United States.
The New England Journal of Medicine, 2009, 360:376–386.
25. Pope CA III et al. Mortality effects of a copper smelter strike and reduced ambient sulfate
particulate matter air pollution. Environmental Health Perspectives, 2007, 115(5):679–683.
26. Pope CA III. Respiratory disease associated with community air pollution and a steel mill,
Utah Valley. American Journal of Public Health, 1989, 79(5):623–628.
27. Pope CA III et al. Daily mortality and PM10 pollution in Utah Valley. Archives of Environ-
mental Health, 1992, 47(3):211–217.
28. Downs SH et al. Reduced exposure to PM10 and attenuated age-related decline in lung
function. The New England Journal of Medicine, 2007, 357:2338–2347.
29. Schindler C et al. Improvements in PM10 exposure and reduced rates of respiratory
symptoms in a cohort of Swiss adults (SAPALDIA). American Journal for Respiratory and
Critical Care Medicine, 2009, 179:1–9.
1430. Bayer-Oglesby L et al. Decline of ambient air pollution levels and improved respiratory
health in Swiss children. Environmental Health Perspectives, 2005, 113:1632–1637.
31. Health risks of particulate matter from long-range transboundary air pollution. Copen-
hagen, WHO Regional Office for Europe, 2006 (www.euro.who.int/document/ e88189.
pdf, accessed 28 October 2012).
32. EGTEI Expert Group on Techno-Economic Issues [web site]. Geneva, United Nations
Economic Commission for Europe, 2012 (http://citepaax.alias.domicile.fr/forums/egtei/
egtei_index.htm, accessed 28 October 2012).
33. Economic and Social Council. Techno-Economic issues. Report by the Co-Chairs of the
Expert Group on Techno-economic Issues. Geneva, United Nations Economic Commis-
sion for Europe, 2010 (ECE/EB.AIR/WG.5/2010/15) (http://www.unece.org/fileadmin/
DAM/ env/documents/2010/eb/wg5/wg47/ECE.EB.AIR.WG.5.2010.15_e.pdf, accessed
27 October 2012).
34. Schindell D et al. Simultaneously mitigating near-term climate change and improving
human health and food security. Science, 2012, 335(6065):183–189.
15Member States The WHO Regional Office for Europe
Albania The World Health Organization (WHO)
Andorra is a specialized agency of the United
Armenia Nations created in 1948 with the primary
Austria responsibility for international health
Azerbaijan matters and public health. The WHO
Belarus Regional Office for Europe is one of six
Belgium regional offices throughout the world,
Bosnia and Herzegovina each with its own programme geared to
Bulgaria the particular health conditions of the
Croatia countries it serves.
Cyprus
Czech Republic
Denmark
Estonia
Finland
France
Georgia
Germany
Greece
Hungary
Iceland
Ireland
Israel
Italy
Kazakhstan
Kyrgyzstan
Latvia
Lithuania
Luxembourg
Malta
Monaco
Montenegro
Netherlands
Norway
Poland
Portugal
Republic of Moldova
Romania
Russian Federation
San Marino
Serbia
Slovakia
Slovenia
Spain
Sweden
Switzerland
Tajikistan
The former Yugoslav
World Health Organization
Republic of Macedonia
Turkey Regional Office for Europe
Turkmenistan UN City, Marmorvej 51, DK-2100 Copenhagen Ø, Denmark
Ukraine Tel.: +45 39 17 17 17. Fax: +45 39 17 18 18.
United Kingdom
Uzbekistan
E-mail: contact@euro.who.int
Web site: www.euro.who.intYou can also read


