HIGH SPEED RAIL FAST TRACK TO SUSTAINABLE MOBILITY - UIC
←
→
Page content transcription
If your browser does not render page correctly, please read the page content below
HIGH
SPEED
RAIL
FA ST T R AC K TO S U STA I N A B L E M O B I L I T Y

SUMM ARY

     3                    FOREWORD

    4-5                    HIGH SPEED RAIL PRINCIPLES AND DEFINITION

    6-7                    HISTORY OF HIGH SPEED RAIL

    8-15                    HIGH SPEED RAIL TODAY

    16-22                    THE COMMERCIAL APPEAL OF HIGH SPEED RAIL

     23-27                   FAST TRACK TO SUSTAINABLE MOBILITY

      28-31                   HIGH SPEED RAIL AND TERRITORY MANAGEMENT

      32-40                    HIGH SPEED STATIONS

          41-45                 INFRASTRUCTURE

          46-51                 ROLLING STOCK

           52-57                 OPERATIONS

           58-59                  ECONOMICS OF HIGH SPEED RAIL

                  60               HIGH SPEED RAIL FINANCES

              61-63                TRACK ACCESS CHARGES

              64-65                  COMPREHENSIVE PROTECTION

              66-68                  STANDARDS FOR HIGH SPEED RAIL SYSTEMS

                  69-71               RESEARCH AND DEVELOPMENT

                   72-74               HIGH SPEED RAIL AT UIC
FOREWORD
High speed rail (HSR) encompasses a
complex reality involving many technical
aspects, such as infrastructure, rolling
stock and operations, as well as strategic
and cross-sector issues including human,
financial, commercial and managerial
factors.

High speed has proven to be a very flexible and attractive
system that can be developed under various circumstances
and in different contexts and cultures. This is the result of four
main and very important characteristics offered to customers
and society: safety, velocity, capacity and sustainability. As a
result, HSR is a rapidly expanding new transport mode, often
described as the “transport mode of the future”.

This brochure aims to communicate and disseminate high
speed characteristics, performances, improvements, inno-
vations and potential applications.

This brochure is published regularly (approximately every
two years) on the occasion of the World Congress on High
Speed by UIC, with contributions from its national high speed
members which are received with thanks.

                                       Jean-Pierre Loubinoux
                                       Director General of UIC

                                                                     U IC 2018
4

                                                 HIGH SPEED RAIL :
                                                 PRINCIPLES AND DEFINITION

                                                 Rail is a grounded, guided, low grip
                                                 transport system

                                                     It needs specific ground infrastructure which is costly                TH E LIMITS
                                                     to implement and maintain but contributes greatly to effi-             OF CLASSICAL RAIL
                                                     cient land use.
                                                                                                                             The speed increases of conventional lines is limited
                                                     The rails provide the guiding system. By controlling the direc-         by several factors :
                                                     tion of the train, they allow it to go very fast. However, this
                                                     means that trains cannot overtake one another.                              The mix of traffic and particularly of speeds be-
                                                                                                                               cause the bigger the difference between the fastest
                                                     Low grip refers to the contact of a steel wheel on a steel rail.           and the slowest trains the smaller de capacity of
HIGH SPEED RAIL PRINCIPLES AND DEFINICTION

                                                     As the train glides on the track, it is easy to carry very heavy           the line,
                                                     loads with a low environmental footprint, but very difficult                  The constraints due to the route and particularly
                                                     to brake and stop, or to accommodate steep gradients.                       the radius of the curves and the human density of
                                                                                                                                  the surroundings,
                                                     Because of the huge investment required, rail can only                          The cost of the investiments for the upgrading,
                                                     be commercially attractive and financially acceptable
                                                                                                                                      The necessity to adapt all the rolling stock fleets
                                                     as a mass transport system. This is just as well, as it is typically
                                                                                                                                    using the infrastructure,
                                                     a heavy haul system.
                                                                                                                                        The difficulty to upgrade while operating

                                                 Classical rail

                                                     Classical rail networks are largely spread worldwide. They
                                                     comply with various gauge standards, but the best perfor-
                                                     mance is achieved using the 1.435 m track width.

                                                     Most of these networks are made up of mixed-traffic tracks.
                                                     The maximum speed never exceeds 200 km/h (exceptionally
                                                     220 km/h). Built during the 19th century, many stations are
                                                     now located in the centres of large cities where most urban
                                                     transport lines converge, facilitating door-to-door trips.

                                                     When compared to other transport modes, classical rail has
                                                     proven to be very safe and environmentally efficient. Howe-
                                                     ver, the aviation and automotive sectors have introduced
                                                     many improvements and are still introducing innovations
                                                     in their respective systems. This has had a strong negative
                                                     impact on rail market shares for medium- and long-distance
                                                     trips.

                                                     More than 50 years ago, Japan, followed by France and many
                                                     other countries, decided to stop the decline of classical rail
                                                     in this market segment by introducing brand new concepts
                                                     for the rail mode rather than upgrading existing structures.
                                                     This represented the birth of high speed rail.
The definition
of high speed rail

    HSR is still a grounded, guided and low grip transport system :
                                                                               Commercial speeds and speed records
    it could be considered to be a railway subsystem. The most
    important change comes from the speed. As travel times
    had to be reduced for commercial purposes, speed emerged
    as the main factor. HSR means a jump in commercial speed          km/h
                                                                      km/h
    and this is why UIC considers a commercial speed of 250
    km/h to be the principal criterion for the definition of HSR.     400
                                                                      400

    However, a secondary criterion is admitted on average dis-
    tances without air competition, where it may not be relevant      200

                                                                                                                                                HIGH SPEED RAIL PRINCIPLES AND DEFINICTION
                                                                      200
    to run at 250 km/h, since a lower speed of 230 or 220 km/h
    or at least above 200 km/h (since under this speed conventio-                                                                  année
                                                                        0                                                          année
    nal trains can do) is enough to catch as many market shares         0 1940          1958          1976          1994              2018
    as a collective mode of transport can do. This also applies           1940          1958          1976          1994              2018
    in very long tunnels whose construction cost depends on the
                                                                                 world records
    diameter linked to the square of the speed, at least.                        world records
                                                                                 maximum  commercial speed
                                                                                 maximum commercial speed
    For such speeds above 200 km/h, the infrastructure can be
    categorized in “High-Speed” if the system in operations,
    complies with :

      track equipment,
      rolling stock (generalisation of trainsets),                    High speed rail requirements
      signalling systems (abandonment of trackside signals),
      operations (long-range control centres),
       the geographical or temporal separation of freight                    Although increasing the speed has entailed many technical
                                                                             and operational changes, HSR still fulfils the same quanti-
    and passenger traffics,
                                                                             tative and qualitative requirements as classical rail :
      and more globaly with the standards for High Speed.
    This definition is coherent with the definition of High Speed              Ability to accommodate various contexts and cultures
    Rail given by 96/48/EC European directive                                  Interoperability,
                                                                               Capacity,
                                                                               Reliability
                                                                               Safety and security
                                                                               Sustainability

                                                                             This evolution has also made it possible to benefit from
                                                                             many other innovations beyond those simply enabling
                                                                             higher speeds, as there is no point improving one aspect
                                                                             of a journey chain (travel time) if the other links in the chain
                                                                             remain weak.

                                                                             In addition, a thorough review of all the interfaces between
                                                                             the system components and of all the operating and main-
                                                                             tenance procedures is necessary, as time gained for the
                                                                             passenger by the increased speed can be cancelled out
                                                                             by an unacceptably high ticket price.

                                                                                                                                  U IC 2018
6

                                                                                                                Since the origins of rail in Europe, during

                                 H I STO RY                                                                     the Industrial Revolution at the beginning
                                                                                                                of the 19th century, the speed of passenger trains was
                                                                                                                of the essence for competition – not necessarily with

                                 OF HIGH
                                                                                                                other transport modes, but with other rail companies.
                                                                                                                It also provided concrete evidence of technological
                                                                                                                development in the most advanced countries at that time.
                                                                                                                If, in 1829, the 50 km/h reached by the impressive “Rocket”

                                 SPEED RAIL                                                                     locomotive from George Stephenson was understandably
                                                                                                                regarded as high speed rail, it did not take long to achieve
                                                                                                                even more impressive performances: 100 km/h before 1850,
                                                                                                                130 km/h in 1854, and even 200 km/h at the beginning

                                 19th – 20th century :
                                                                                                                of the 20th century. However, these are just rail speed re-
                                                                                                                cords. The maximum speed in revenue operation was much
                                 From the birth of the railway to HSR                                           more modest but nevertheless important. In the 1930s,
                                                                                                                the top and the average speeds between two cities using
                                                                                                                steam, electric or diesel power were 180 km/h and 135 km/h
                                      Because the rail mode is a guided and low                                 respectively. However, the emergence of other transport
                                      grip transportation system, the history of                                modes, such as aviation (faster) and private cars (point-to-
                                      the railway is an endless history of speed.                               point private travel at any time), prompted railways to take
                                                                                                                further steps to keep up with competition.
HISTORY OF HIGH SPEED RAIL

                                  1830             1903                1964                  1981            1988                1989               1992                 1997
                                 “Rocket”      Siemens &              1 October,          The TGV,        Pendolinoin        The Atlantic       AVE in Spain       HSR in Belgium
                                locomotive         AEG                    the       the first European   Italy and ICE     TGVoperates
                                 by George   Electric railcar       SHINKANSEN,           HS train,        in Germany         at 300 km/h
                               Stephenson     reaches 210         first HSR system, operates in France
                             reaches 50 km/h      km/h              starts in Japan    at 260 km/h

                                 1964 :The birth of Shinkansen

                                      After some significant speed records in Europe (in Germany,
                                      Italy, UK and particularly in France – 331 km/h in 1955), the
                                      world was surprised when, on 1 October 1964, the Japanese
                                      National Railways began operation of a brand new, 515-km,
                                      standard gauge line (1 435 mm, unlike the conventional
                                      metre-gauge lines previously built in Japan) : the Tokaido
                                      Shinkansen, from Tokyo Central to Shin Osaka. This line aimed
                                      to provide the transport system with a capacity commen-
                                      surate with the impressively rapid growth of the Japanese
                                      economy. JNR promoted the concept of not only a new line,
                                      but a new transport system, which was later extended to the
                                      rest of the country and became the backbone of passenger
                                      transport for future generations in Japan. Tokaido Shinkansen
                                      was conceived to operate at 210 km/h (this was later in-
                                      creased), with a broad loading gauge, electric motor units
                                      powered at 25 kV AC, Automatic Train Control (ATC), Centra-
                                      lised Traffic Control (CTC) and other modern improvements.
                                      High speed rail was born.
1964 – 1981 :
The advent of TGV

    After the huge technical and commercial success
    of Shinkansen, several European countries, particularly
    France, Germany, and Italy, developed new technologies
    and innovations aimed at overcoming the decline of rail
    market shares. Despite an uncertain future (introduction
    of Concorde, political opposition, the first petrol crisis
    in 1973, etc.), SNCF, the French national railway com-
    pany, began operation of the first high speed line
    between Paris and Lyon on 27 September 1981,
    at a maximum speed of 260 km/h.

    The new European HSR rapidly
    proliferated and expanded its services,
    thanks to its interoperability with
    the existing rail network.

                                                                                                                                                  HISTORY OF HIGH SPEED RAIL
         2003                2004                2007                 2007               2008                2009                2018
       HS1 in UK            KTX in          574.8 km/h               Taiwan              CHR             HSR in the             HSR in
                          South-Korea      New HSR record             HS Rail           in China        Netherlands and      Morocco and
                                              in France             Corporation                            in Turkey          Saudi Arabia

1981 – 2018 :
HSR services spreading                                                    such as China in 2003, South Korea in 2004, Taiwan in 2007
throughout the world                                                      and Turkey in 2009. After the 120-km high speed line from
                                                                          Beijing to Tianjin was commissioned in August 2008, China
                                                                          changed scale and moved towards a much wider strategy
                                                                          by implementing more than 20 000 km of new high speed
    Encouraged by these French and Japanese success stories,              lines and acquiring more than 1 200 trainsets, eventually
    several European countries began looking to establish                 taking the global HSR lead.
    a new generation of competitive long- and medium-distance
    passenger rail services, either by developing their own tech-         Following the example of China, many new high speed
    nology or by importing it. Italy and Germany in 1988, Spain           systems are now under development, under construction
    in 1992, Belgium in 1997, the United Kingdom in 2003 and              or just starting operation (Morocco, Saudi Arabia, USA, etc.),
    the Netherlands in 2009 joined the club of countries offering         demonstrating that HSR can operate worldwide regardless
    high speed rail services in Europe. In the meantime, some             of the geography, the demography, the climate, the economic
    similar cases began appear in other countries and regions,            and political context, and the culture of the country.

                                                                                                                                      U IC 2018
8

                            HIGH
                            SPEED
                            RAIL
                            T O D AY
                            The high speed network
                                                                                                             Asia

                                The high speed network began its development
                                in 1964 in Japan. Its extension, mainly driven
                                by Japan, France, Spain, Italy and Germany, was
                                slow until 2000. At this point an acceleration could
                                be felt, but it was only in 2008 that, thanks to
                                heavy investment by China, the scale of the whole
                                network changed dimension. Today more than half
HIGH SPEED RAIL TODAY

                                of all high speed lines are in Asia.

                                Some countries or regions, such as Belgium, the Netherlands and             Ürümqi
                                Taiwan, have completely finished building the extent of their high
                                speed network. Some countries are continuing development but have
                                already carried out the bulk of it, such as Spain, Italy, France, Germany
                                and Japan. Some countries are still planning significant extensions,
                                such as UK, South Korea and China. Some countries have just started
                                developing and implementing HSR, such as Saudi Arabia, Morocco,
                                USA and Russia. Finally, some countries plan to implement high speed
                                rail in the future, such as several Eastern European and Asian states.

                                It is worth noting that not all high speed lines are run at the same
                                speed. Several factors come into the explanation. Firstly, there is the
                                distinction between the design speed and the operational speed. The
                                most recent lines are designed to run at 350 km/h (and even 400
                                km/h), i.e. the infrastructure and the superstructure can withstand
                                this speed. However, the maximum commercial speed (operational
                                speed) may be lower than the design speed because the rolling
                                stock is not suitable for it. The operational speed is determined
                                by the certification process during which evidence must be provided
                                that the rolling stock can successfully run on the line at the targeted
                                speed plus 10%.

                                Secondly, some so-called high speed lines are designed for speeds
                                lower than 250 km/h. This can be due the mix of traffic or the network
                                consistency. If the infrastructure is to be run by freight and passen-
                                ger trains or by long-distance and regional trains, the line capacity                              Dali
                                is increased by reducing the maximum speed. In addition, some
                                lines are sometimes built predominantly to provide networks with
                                consistency by, for example, linking different sections. In this case
                                the maximum speed may be lower.

                                The outcome of this is that the global high speed network is not
                                homogeneous in terms of speed.

                                                                                                             © Input UIC members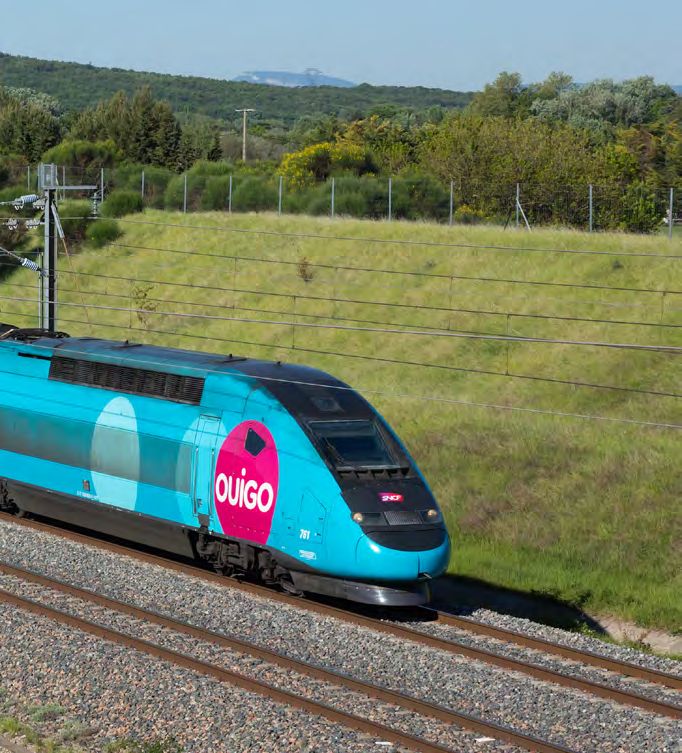
Sapporo

                                                                                                                                       Shin Hakodate
                                                                             Harbin                                                      Shin Aomori

                                                                     Changchun
                                                                                                                                                 Fukushima

                                                                          Shenyang                                           Nagano
                                                                                                                                                  Tokyo

                                           Chengde                                                     Gangneung
                                                                                                                                     Shin Ōsaka
                       Hohhot                   Beijing                            Seoul
                                                     Tianjin
                                                                                                                         Hiroshima
                                                                                                             Busan
                                            Shijiazhuang
                                                                                      Gwangju
                                                        Jinan            Qingdao                           Nagasaki
                                                                                                                        Kagoshima

          Lanzhou                                          Xuzhou
                                    Zhengzhou

                         Xian                                                      Shanghai
                                                                 Hefei
                                                                                        Ningbo
                                              Wuhan

    Chengdu
                     Chongqing
                                                 Zhuzhou                                                                KEYS
                                                                                              Taipei                        C A P I TA L
                                                                                                                            H IGH SPEED LI N ES ABOVE 250 KM/H
                    Guiyang                                                Xiamen
                                                                                                                            HIGH SPEED BETWEEN 220 AND 249 KM/H
                                                                                                                            HIGH SPEED LINES UNDER 220 KM/H
i                                                                                          Kaohsiung                        H IGH SPEED LI N ES U N DER CONSTRUCTION
         Kunming                                                                                                            PLANNED HIGH SPEED LINES
                                       Guangzhou
                                                               Shenzhen
                                 Nanning

                                                                                                       0          250      500             750       1000 km
                                            Haikou

                                                                                                                                                        U IC 2018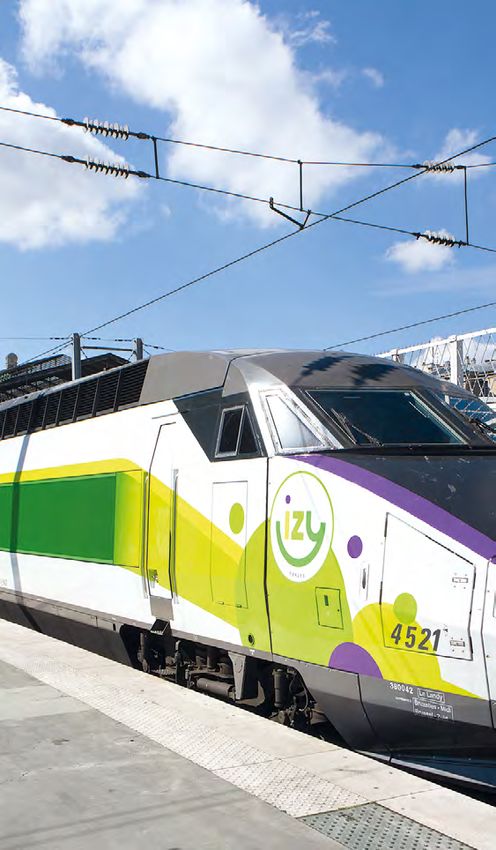
10

          Europe                                                                                                                                        Lillehammer

                                                                                                                                                     Oslo

                                                                                                                                                Gothenburg                  Jö

                                                                                                                                                Copenhagen              Malmö
                                                                                                                                                            Ringsted

                                                                     Manchester        Leeds
                                                                                                                                                 Hamburg

                                                                                    Birmingham
                                                                                                                Amsterdam                       Hannover
                                                                                                                                                                       Berlin
                                                                                             London
                                                                                                               Antwerpen                                        Leipzig

                                                                                                    Lille            Brüssel          Cologne

                                                                                                                                                Frankfurt
                                                                                                                                                                           Plze
                                                                                                                                                Nürnberg
                                                                                                       Paris
                                                                             Rennes                                                               Stuttgart
                                                                                                                          Strasbourg
                                                                                                                                                                 Munich
                                                                                                                                       Basel
                                                                                                        Besançon
                                                                                                                                       Bern

                                                                                                                    Lyon                        Milan
                                                                                  Bordeaux
              A Coruña                      Gijòn                                                                             Turin
                                                         Santander                                                                              Genoa
                        Vigo                                                                                Montpellier
                                                                               Toulouse
                                                                                                                                                                Florence
                                                                                                                      Marseille
                       Porto
                                                    Valladolid

                                                                      Zaragoza
                                                                                               Barcelona
                                                                                                                                                                          Rom
                                                         Madrid
            Lisbon
                        Badajoz
                                                                           Valencia
                                                      Albacete

                              Seville                                    Alicante
                                                           Murcia
                                        Granada                                       0                 250                   500                  750 km
                      Càdiz
                                        Màlaga             Almería
© Input UIC members
© Input UIC members
Hanoi South East Asia
Chiang Mai
Nong Khai
Tallinn Ubon Ratchathani
Stockholm
Bangkok
Ho Chi Minh City
Linköping
Kangar
önköping Kuala Lumpur
Riga
Singapore
Jakarta
Surabaya
Vilnius
0 1500 km
© Input UIC members
Saint Petersburg Eurasia
Poznań Moscow
Warsaw Kazan
Lódź
HIGH SPEED RAIL TODAY
Astana
Katowice Sotchi Almaty
Prague 0 2000 km
en © Input UIC members
Brno
© Input UIC members
India
Vienna
Amritsar
New Delhi
Jodhpur
Patna
Ahmedabad Kolkata
Mumbai
Pune
Hyderabad
Chennai
0 750 km
me Thiruvananthapuram
Naples
KEYS
C A P I TA L
H IGH SPEED LI N ES ABOVE 250 KM/H
HIGH SPEED BETWEEN 220 AND 249 KM/H
HIGH SPEED LINES UNDER 220 KM/H
H IGH SPEED LI N ES U N DER CONSTRUCTION
PLANNED HIGH SPEED LINES
U IC 201812
Edirne
Samsun
Istanbul
Kars
Bursa Kirikkale
Ankara Sivas
Polatli Yerköy Erzincan
Çandarli Afyon Keyseri Malatya
Izmir Tabriz
Konya Diyarbakir
Ulukişla Cizre
Antalya Karaman Mürsitpinar
Osmaniye
Halep
Hamadan
Arak
Alexandria
Cairo
Hurghada
Luxor
Medina
Riyadh
Jeddah
Mecca
0 250 500 750 1000 km
© Input UIC membersAustralia Brisbane
Middle East Gold Coast
Newcastle
Sydney
Canberra
Mashhad Melbourne
0 400 km
Tehran © Input UIC members
Qom
Brazil
Campinas
HIGH SPEED RAIL TODAY
Isfahan
Rio de Janeiro
Yazd : Nextstation Conf 2019 São Paulo
0 100 km
Shiraz © Input UIC members
Morocco Tanger
Oujda
Kenitra
Rabat Fez
Manama Casablanca
Doha © Input UIC members
Marrakesh
Agadir
Musina
Pretoria 0 400 km
Johannesburg © Input UIC members
Bloemfontein KEYS
Durban
C A P I TA L
H IGH SPEED LI N ES ABOVE 250 KM/H
Cape Town HIGH SPEED BETWEEN 220 AND 249 KM/H
HIGH SPEED LINES UNDER 220 KM/H
0 300 km
South Africa H IGH SPEED LI N ES U N DER CONSTRUCTION
© Input UIC members PLANNED HIGH SPEED LINES
U IC 201814
North America
Edmonton
Calgary
0 100 200 km
Toronto
Ottawa
Sacramento London
Windsor
San Francisco
0 100 200 km
San José
Boston
Merced 0 50 100 150 200 km
Fresno 0 100 200 km
New York
Bakersfield
Palmdale
Burbank Dallas
Los Angeles San Bernardino Washington D.C.
Anaheim
0 100 200 km San Diego
0 100 200 km
Houston
Querétaro
0 500 1000 km Mexico City
0 100 200 km
© Input UIC members
KEYS
C A P I TA L
H IGH SPEED LI N ES ABOVE 250 KM/H
HIGH SPEED BETWEEN 220 AND 249 KM/H
HIGH SPEED LINES UNDER 220 KM/H
H IGH SPEED LI N ES U N DER CONSTRUCTION
PLANNED HIGH SPEED LINESHigh speed rail network
km
14000
12000
10000
8000
6000
4000
2000
0
km/h
70
110
130
160
200
230
240
250
260
270
280
285
300
320
350
360
400
KEYS
HIGH SPEED RAIL TODAY
KM U N DER CONSTRUCTION
K M I N O P E R AT I O N S
KM PLANNED
High speed rail network length
km
50 000
45 000
40 000
35 000
30 000
25 000
20 000
15 000
10 000
5 000
1965
1970
1975
1980
1985
1990
1995
2000
2005
2010
2015
1964-2018
KEYS
T O TA L
ASIA
EUROPE
OTH E R S
U IC 201816
COMMERCIAL APPEAL
OF HIGH SPEED RAIL
HSR market shares in 2016 The only objective when building a high
( PA S S E N G E R S . K I L O M E T E R )
speed rail network is to attract enough
2% 3% customers to break even in socio-economic
2% terms and not be too much of a burden for
4%
the taxpayers who may not use it.
So, the issue of the number of users is
1% 7% crucial. It is excellent if these users come
2% from other transport modes, as high speed
rail is environmentally friendlier than
14% other modes, but a portion of the traffic
65% will also come from an increase in mobility,
i.e. people will consume fewer goods or
save less money in order to travel more.
This means that high speed rail has to be
COMMERCIAL APPEAL OF HIGH SPEED RAIL
O T H E R E U R O P E A N C O M PA N I E S 3 % more attractive than the other transport
C H I N A ( C H I N A R A I L W AY ) 6 5 %
modes for some segments of the market
J A PA N ( J R G R O U P ) 1 4 %
and has to create its own demand. As a high
KO R E A ( KO R A I L ) 2%
TA I W A N ( T H S R C ) 1 %
speed line is usually built to last at least
FRANCE (THSRC) 7% a century, these two characteristics
GERMANY (DBAG) 4% (be attractive and generate mobility)
S PA I N ( R E N F E O P E R A D O R A ) 2 % must be perennial.
I TA LY ( T R E N I TA L I A ) 2 %
The commercial appeal
In traffic terms, high speed rail has proven to be very
successful, as passenger growth is faster than the
network extension, when normally the opposite evo-
lution would be expected, as once the best are built
the latest ones will have a lower marginal appeal.
The countervailing facts are grounded on two aspects,
insufficiently highlighted :
The latest huge network development is taking place
in China which is the most populated country in the world;
Elsewhere, as in China, the network effect works to provide
customers with more travelling possibilities.
China has taken the global lead in passenger traffic volumes.
This completely refutes the long-standing prejudice according
to which high speed rail is only for rich people.
If China is factored out, a steady traffic growth between
2010 and 2018 demonstrates the appeal of high speed rail
in every geographic, demographic, economic, political and
cultural context; in other words, it is universally appealing.High speed rail
versus air transport
The competition between high speed rail and air trans- Of course, this traffic split can be affected by other parame-
port has been tested in many places, all over the world and ters, such as the location of stations and airports, ticket prices
around the clock. The major outcome is that, regardless and service frequency. This is particularly the case when
of the rail and air companies involved, modal shares are high speed lines first open to revenue services, as air ope-
driven by the relationship between the respective door- rators try to react and resist. However, in the long term the
to-door travel times. market stabilises around the previous ratios because rail
is always cheaper than air, as demonstrated by recent European
Furthermore, on most Origin-Destination (OD) pairs, the research carried out by UIC, even when considering low-
rail and air market shares can be accurately predicted using cost air companies and tour operators who sell complete
just the high speed train travel time : packages (including accommodation and visits, shows
or fairs) better than trips.
Where rail travel time is less than 2h, HSR completely
dominates the market and air companies often give up com-
peting. A good example of this is the Paris-Brussels route;
Where rail travel time is between 2h and 3h30 minutes,
rail is the dominant mode;
Where rail travel time is between 3h30 and 5h, air is the
COMMERCIAL APPEAL OF HIGH SPEED RAIL
dominant mode;
Where rail travel time is more than 5h, rail becomes
a marginal actor compared to air.
100% Rail market share on the rail + air market in France
( PA S S E N G E R S )
% RAIL / RAIL + AIR
100%
80%
80%
60%
60%
40%
40%
20%
20%
0%
0,0 2,0 4,0 6,0 8,0 10,0
0%
0,0 2,0 4,0 6,0 8,0 10,0
HOURS
=
= origin/destination
O R I G I N - D E S T I N AT I N ATpair
ION PA I R BY TRAIN
= origin/destination pair
U IC 201818
COMMERCIAL APPEAL OF HIGH SPEED RAIL
High speed rail versus buses
Nowadays, competition from bus operators is widespread
in all countries. In many cases, it existed before high speed rail
services were commissioned.
Bus travel is characteristically cheap and able to serve several
stops within a city, consequently reducing access or egress
times.
Generally, when high speed services start operation, the bus
offer changes and develops into a low-cost offer, based on
economic competitiveness and better on-board services, e.g.
free WiFi. This kind of competition can prove quite aggressive
towards high speed rail and can give rise to a response in the
form of a similar low-cost service. This is the case in France,
where SNCF has created Ouigo, a special low-cost TGV service
which offers very low-price tickets and also targets families
by offering €5 tickets for children, whatever the destination.High speed rail versus the private car
Competition with the car is much more complex than with
other public transport modes because the private car has
assets that no public transport mode has. Privacy is the
primary asset, together with the ability to offer a full
door-to-door trip, the choice of the departure date and hour
(full availability), the choice of the route, the ease of hand-
ling luggage, the absence of any constraints linked to ticket
distribution and reservation, etc.
In addition, car transport is rapidly evolving due to two
nascent possibilities enabled by the collaborative eco-
nomy : car-pooling and car-sharing. These two new uses
of the car strike a balance between the fully private system,
in which the driver is the owner, and public transport with
its constraints (meeting places, contracts replacing ticketing
and timetables, etc.).
In the face of this ever-moving competition, high speed rail
remains very efficient over long distances. Over shorter
distances, HSR needs to be very inventive but has proven
capable of this, with fares based on the phone system (unli-
mited subscription) or on-demand trains. The market is pro-
COMMERCIAL APPEAL OF HIGH SPEED RAIL
gressively moving toward a digital-oriented and multimodal
market, particularly for the younger generation.
Global market shares
The respective market shares of rail, air and road depend High speed rail retains some assets that distinguish it from
on many parameters, such as geographic context, national other public transport modes, including :
regulations, etc. However, in most European countries where
HSR is in operation, the car is still the main transport mode ground speed,
for short and medium distances and air is the most popular access to city centres,
mode for very long distances. Rail and bus have many as- freedom of passengers on-board trains (possibility
sets over medium distances. The following graph illustrates of standing and walking during travel),
the situation in France, as an example of a relatively large passenger comfort.
European country.
MILLIONS OF Modal shares
J O U Million
R N E Y S of journeys
120
100 KEYS
80 AIR
RAIL
BUS
60 P R I V AT E C A R ,
TWO-WHEELS
40
20
0
100 - 300 km 300 - 600 km 600 - 1000 km 1000 km and more
TRIP
D I S TA N C E
Distance
U IC 201820
Criteria chosen in the modal choice (percentage)
On behalf of UIC, surveys have
been conducted and focus groups have been
consulted in three European countries (France,
Spain and UK) in order to identify the main
parameters that drive the modal choice of
travellers.
This process encompassed :
A sample of 2 000 respondents per country,
representative of the national population;
A focus group in each country.
The statistical requirements have indeed been fulfilled with
2,000 valid questionnaires filled for each country. Statistical
adjustment has been performed so that the final data set
is representative of the national population in each country
COMMERCIAL APPEAL OF HIGH SPEED RAIL
in terms of gender, age, social grade, region of residence
and car possession. One of the numerous outcomes of this
survey is about the criteria driving the modal choice in three
different European countries which look very similar. The
following graph illustrates one aspect of the survey in which
each respondent selects 5 criteria at the most among 14.
In the case of UK for example, the “price” criterion
is selected by 77% of the respondents, but the “luggage”
criterion by 4% of them only. The lesson drawn from this poll
is that time (“travel time” + “wasted time “ + “reliability” and
“accessibility” to a lesser extend + “timetable” as a marker
of frequency) and price govern the modal choice.
Travel time,
Wasted time,
Reliability (to a smaller extend),
And timetable (as a marker for frequency and waiting time).
AS internal rail competition is going to be enforced in Europe,
incumbent operators and new comers will struggle to offer
better on-board services for the upper market segments
and lower costs for the lower market segments. In any case
the norm will be to allow the client to be self-autonomous
by providing him with electric plugs to fill up on energy his
own devices.
In first class the on-board catering will remain as distingui-
shing feature.
For customers privileging the price and for families low cost
services is the best asset of rail against the ever-changing
competition from all forms of car uses: private car, carpoo-
ling, car sharing and autonomous car in the future. Ouigo
in France, Izy by Thalys and Eva in Spain are pioneering this
kind of low cost services.Internal high speed
rail competition
Following the change in the transport regulation, internal rail
competition is emerging in Europe. It already exists in Italy
where the incumbent high speed rail company (TRENITALIA)
faces a newcomer NTV (Nuovo Trasporto Viaggiatori), which
started from scratch by acquiring a fleet of high speed trainsets
and creating a new depot (near Naples). This competition
is now well installed and has had some important effects on
both competitors because of the war on prices it has triggered
(about minus 30%), with a resulting rise of traffic of similar
magnitude. The consumer is not the only winner (cheaper
trips, higher service frequency, better on-board service, newer
rolling stock, etc.), in socio-economic terms, this opening
of competition is beneficial for all because the infrastructure
is more intensely used.
Similar competition is also being experienced in South Korea,
between the incumbent company (KNR) and a new public
company in which KNR holds shares. A particular feature
of this market is that each competitor has their own terminal
COMMERCIAL APPEAL OF HIGH SPEED RAIL
station in the Seoul area.
In South Korea, internal rail competition has been introduced
between the incumbent rail operator, KORAIL, and a new public
company whose shares are partly (41%) owned by KORAIL, for
high speed trips. The particularity of this competition is that
KORAIL with its KTX serves the Seoul central station while SRT
(the competitor) uses the Suseo station newly linked to the
high speed network by a very long tunnel. In 2017, Korail and
SRT have transported respectively around 60 and 19 million
passengers in high speed trains.
Of course, competition, whether internal Level of liberalisation by country and
(within the rail mode) or external (with mode in March 2016
other transport modes), relies heavily on the
regulation and degree of freedom allowed. GREAT BRITAIN SPAIN FRANCE
Things are rapidly evolving. In Asia, China
and Japan do not allow internal competition
BUS AND RECENT
LIBERALISED LIBERALISED
COACHES LIBERALISATION
and South Korea is only now opening
GRADUAL GRADUAL
the door. In Europe, the unbundling of RAIL LIBERALISED
LIBERALISATION LIBERALISATION
infrastructure from operation is leading
to competition on or for the market.
AIR LIBERALISED LIBERALISED LIBERALISED
Korean KTX versus SRT Seoul
Yongsan Suseo
Dongtan
Jije
Cheonan
Ansan
Gongju Osong
Daejeon
Gimcheon (Gumi)
Dong-
Iksan Daegu Singyeongju
Jeongeup Ulsan
Gwangju-
songjeong Busan
Naju
Mokpo
U IC 201822
Nascent competition
with new business
models
The digital revolution trip comparison sites and provide
COMMERCIAL APPEAL OF HIGH SPEED RAIL
is transforming the passenger customers with information
transport market into a perfect on trip alternatives and the
market, with a multiplicity environmental footprint of trips.
of service providers together
with the total transparency and
More aggressive competition is provided by the
immediate availability
big data actors who have made some people
of information. It has also led addicted to their search engines. These com-
to unexpected new business panies try to intervene between the customer
models. Among these, new and the rail companies and sell tickets through
web actors are trying to carve their own channels, just like web operators
out a place in the field of train who reserve hotel rooms. Naturally, they act
ticket distribution. Through for commission, which may reduce profitability
various channels, they take the for the rail operators who have invested in the
opportunities provided by the assets for the physical transport.
marketing policies of incumbent
The changes in regulation may also allow the
rail companies or by their yield
introduction onto the market of actors like
management systems. Some
ROSCOS, as in aviation where some companies
of these new players also act as
do their business by simply renting aeroplanes.FA S T T R A C K T O
S U S TA I N A B L E
MOBILITY
Strategies for reducing
the environmental footprint
Three strategies can be implemented in this context:
Avoid
Shift
FAST TRACK TO SUSTAINABLE MOBILITY
Limiting the transport demand can be
obtained by enforcing quota systems,
by creating transport alternatives or Improve
by reducing the transport needs. The advantages of HSR in terms of en-
ergy consumption and Green House
The first lever is mainly in the hands of Gas (GHG) emissions, compared to its
national governments. However, HSLs competitors, are one of the main dri- Since 1964, HSR has constantly
are sometimes shorter than conven- vers for reducing the carbon footprint introduced improvements and in-
tional lines and consequently shorten of the transport sector. A UIC study on novations aimed at reducing high
rail trips. HSR in France and China concluded speed rail externalities: vibrations,
that the carbon footprint of HSR can noise, CO2 emissions, etc. Much has
The second lever is already largely en- be up to 14 times less carbon inten- also been done to recycle infrastruc-
hanced by the digital revolution which sive than car travel and up to 15 times ture and rolling stock components.
has allowed people to communicate less than aviation travel, even when Energy efficiency is at the heart of the
without having to move. measured over the full life cycles of problem. Numerous measures have
planning, construction and operation been taken to :
High speed rail forms part of the third of the different transport modes.
lever when implementation of the build lighter vehicles;
HS network boosts better land use As a result, shifting passengers to high streamline trains;
through the relocation of housing, speed rail from air and road transport increase on-board seat capacity;
commercial and industrial real estate, reduces CO2 emissions. Expectations use more efficient engines;
the reorganisation of the local urban of a modal shift to rail regarding the introduce energy regenerative
transports, or the promotion of new corresponding CO2 reductions have
systems;
ways of life. The creation of co-wor- been proven by experience across a
king spaces in new stations illustrates very large number of corridors. increase the share of renewable
this last aspect, while also providing energies;
access to a wide range of services and In Europe, the Transport White Paper improve all ancillary systems such
shop facilities. stipulates that most medium-distance as air conditioning or lighting;
passenger traffic should be carried by etc.
rail by 2050.
Paradoxically, the energy consump-
tion per passenger of high speed
trains is usually lower than that
of conventional trains running
between the same stations, according
to several parameters such as a more
homogeneous speed profile.
U IC 201824
Carbon balance of a high speed line
High speed projects are usually appraised
by means of two important balances :
economic and environmental.
The environmental balance spans the life cycle of the in- Calculation of the CO2 emissions for a high speed project
frastructure from the very first design to final recycling of
its components, through the construction and operation
periods.
This means that the footprint includes
the carbon emissions when :
Design & Construction &
designing the line, because the engineers and draftsmen Procedure Manufacturing
will need buildings and devices to shelter them and provide
comfort and heating or air conditioning, fuel for going in the
field or to meetings, etc.; Life
constructing the line, the stations and the rolling stock, cycle
Traffic
including the emissions for extracting and shaping materials shifts
from air
(e.g. steel or cement), and for their transport (e.g. moving
the earth or transporting the rails);
FAST TRACK TO SUSTAINABLE MOBILITY
operating trains and stations;
maintaining the infrastructure and the rolling stock;
distributing tickets; Recycling Traffic shifts Operation
from road
recycling the components of the infrastructure and the
rolling stock.
For a 300 kilometers HSL : It is clear that all these emissions lead to a substantial foot-
CO2 emmission for the construction print spread along the life of the project (from 50 to 100
Thousand tons
years), but this is strongly concentrated at the beginning of
500
450 the period due to the impact of construction. In the case of
400 a 300-km long HS line (such as the Oceane Line in France),
350 the CO2 emissions amount to 1.5 million tonnes.
300
250
200
However, these emissions are offset during the revenue
150 period because of the CO2 savings due to the traffic shift
100 from road (50 000 tonnes per year) and air (80 000 tonnes
50 per year) to rail. This means that the carbon balance, which is
0
heavily negative at the end of the construction period, impro-
ilit ood ay
(b and
ng rin th s)
rin uc s
As tru es
iss res
ba ov ing
ad an s
Ra nts
nd te ck
ib s
Sig tion
ng
t
ui ort
s,
er tio igh orks
ee str rk
en
ro st tr ent
str ie
t e ee ar ng
of ecr th ry wdie
g s tur
g a Ca tra
ves year on year of operation. In the previous example, the
gf f w w
lli
di nar
sa ctu
en g wo
eq sp
e
Ro and imp enc
em
ldi
l
u
an lla em
pm
na
in n o t of
to tu
il
ui
F
ra n s
in
carbon emission break-even (carbon neutrality) will be achie-
r
Fr epa sig
ies
E
op ea e r
pr f, de
ac
e
lla cap
ved in 2029, i.e. 12 years after the line was commissioned.
R ng
af
en en
d
in
St
i
rr ng
ee
Ba nds
ly
at
st
Cu al e
pp
ad
La
su
i
ec
gy
Sp
on
er
Therefore, a high speed line project is only environmentally
cti
En
tru
ns
feasible if there is a strong certainty that the traffic diversion
Co
Cumulated CO2 emmissions volumes will be significant. This is even more important
Thousand tons
where there are predictions of changes to the technology
1500
of all transport modes, such as cars, and even aeroplanes,
1000 powered by electricity.
500
0
2020 2024 2028 2032 2036
-500
-1000
-1500
-2000Protection of the environment
during the design and
construction phases
A second study evaluates when and in what proportions the
project contributes to the protection of the environment
and in particular, the climate. As most of the CO2 emissions
relating to a high speed line are released during the construc-
tion of the infrastructure, new methods are now employed
to reduce the corresponding carbon footprint of railway
infrastructure. When different technical solutions can be
envisaged for earthworks or engineering works (bridges
and tunnels), the decision-making process now takes the
volume of GHG emissions into consideration.
One typical example of the reduction of greenhouse gas
emissions is the laying of an asphalt concrete finishing layer.
This innovative solution has already been used in the design
and the construction of the railway platform. It consists of
replacing the conventional solution of a foundation layer of
“as dug” gravel (GNT) with a solution that includes a road
FAST TRACK TO SUSTAINABLE MOBILITY
base asphalt (GB). Not only is the environmental balance
better than with the previous thick layer of materials, but
durability is also improved. In addition, this asphalt layer
makes it possible to reduce the thickness of the ballast be-
neath the rail.
This also applies to the environmental
optimisation of the components of the
rail platform and superstructure.
Combining carbon offset and modal
shift on the California high speed line
A carbon-free project has been designed on the new high speed line
in California. The project will intrinsically emit 170 000 CO2 tonnes of
GHG. However, these emissions will be offset by 520 000 tonnes due
to a commitment to plant 4 600 trees and to grant $20 million for the
replacement of old school buses.
In addition, modal shift will help reduce the carbon footprint of the cor-
ridor, as planes produce 57 times and cars 43 times more GHG pollution
than high speed trains.
The calculations of the California High-Speed Rail Authority show that
when all the carbon corrective measures envisaged so far are considered,
the high speed line will be globally carbon positive.
U IC 201826
A good example of friendship
between HSR and environment
Some HSR infrastructure and services produce and consume
their own renewable energy. An innovative example is the
Schoten Rail Tunnel in Belgium, primarily designed for the
protection of wildlife in a forest area and to reduce noise
from the rail and highway. Here, the infrastructure manager
Infrabel has installed 16 000 solar panels on the roof of the
railway tunnel of the high speed Antwerp-Amsterdam, line.
This covers a total length of 3.4 km and an overall surface
area of 50 000 m² (approximately 8 football pitches), has a
total installed power of nearly 4 MW, and generates 3.3 GWh
of electricity each year.
The energy is used to provide both power to fixed infrastruc-
ture (e.g. railway stations, lighting, heating and signalling)
and traction to trains. The electricity produced by the solar
panels powers about 4 000 trains per year. This means that
the equivalent of a full day’s worth of Belgian rail traffic is able
to run entirely on solar power generated by the equipment.
FAST TRACK TO SUSTAINABLE MOBILITY
Renewable energy in high
speed rail operation
HSR, as a 100% electrified system, is compatible with
renewable energy without the need for further technological
improvements. Nowadays, HSR is the only transport mode
to consume significant proportions of renewable energy in
the intercity and long-distance transport market.
Decarbonised electricity mix is the main driver of reducing
CO2 emissions: the higher the percentage of electricity
from renewable sources used for traction, the lower the
CO2 emissions.
One of the advantages of being electrically powered is that,
unlike other transport modes, high speed undertakings can
easily utilise the main forms of renewable energy (such
as on-site renewable power plants) or can purchase Green
Certificates through the procurement of Renewable Energy
Certificates (GO or REC – market tools defined by European
Directives to promote investment in green energy power
plants).
In this context, some rail companies have recently initiated
“green electricity” procurement as they aim to increase their
share of renewable electricity. For example, in Scandinavia,
Switzerland and Austria there are entire rail networks which
run on electricity that is completely carbon free. Similarly,
the Dutch railways have signed a contract to purchase all
their energy requirements from newly built renewable en-
ergy sources.Environmental information Equivalent consumption and CO2 emission
for a 600 km trip
43,1 LITERS
Many high speed operators provide environmental
information on their website and tickets. In Italy, 93,0 KG O F CO 2
FS Trenitalia provides a comparison of average CO2
emissions for the same journey by train, car and
aeroplane on its long-distance tickets. 31,5 LITERS
The UIC EcoPassenger website provides potential 6 7, 4 KG O F CO 2
travellers with an environmental footprint calcu-
lation for international rail journeys throughout
Europe (www.ecopassenger.org). It compares the 6 LITERS
main competing modes (aeroplane and car) and
demonstrates the advantages of rail when it comes 8,1 KG O F CO 2
to minimising CO2 emissions.
KEYS
PRIMARY EN ERGY CONSUMPTION
CAR B ON DIOXI DE EMISSION
FAST TRACK TO SUSTAINABLE MOBILITY
Average external cost (€ per 1,000 passengers*km)
70
60
50
40
30
20
10
0
ACCI DENTS NOISE AIR C L I M AT E UP & DOWN OTH E R S T O TA L
POLLUTION STR EA M
CHANGE
PROCESS
KEYS
RAIL
BUS
AIR
CAR
U IC 201828
HIGH SPEED RAIL
A N D TE R R ITO RY
MANAGEMENT
Much has been said on the subject of HSR and territory management, but the logic of
their relationship is rarely explained. Failure to understand this relationship may lead to
overestimating or underestimating the real effects of HSR on the served territory.
Going fast means saving time. What do people do with this Several factors explain this behavioural change :
saved time? Surveys have shown that the time gained is
access to a wider employment area,
HIGH SPEED RAIL AND TERRITORY MANAGEMENT
generally spent in travelling more. Scrutiny at the sources
of HSR traffic regularly shows that, for typical HS lines, new benefiting more often from a natural zone or a touristic
rail traffic is made up of three main parts: shifts from road, zone,
shifts from air and induced traffic. Induced traffic corresponds more frequent visits to family members and friends.
to people who would not have travelled or would have tra-
velled less frequently if the HS line had not been created. These advantages may cause people to move into the cor-
In other words, induced traffic comes from an increase in responding corridor. Similarly, companies may consider
mobility. The two pie charts below show that the volume of transferring some of their activities towards the corridor
new traffic depends on the travel time saved and illustrate or establishing new production locations in the corridor to
the respective shares for road and air diversions and induced benefit from the employment basin. Regions and cities, as
traffic. They also show that induced traffic is often the main well as hotels and holiday resorts, may also try to attract
source of new traffic. tourists and clients by investing in the corridor, as the flows
of people are greater.
The increase in mobility means that people find it advan-
tageous to travel more along the corridor served by the HS So, the logical relationship between speed and territory evo-
line. Why is there more travel along the corridor ? lution is a consequence of the mobility increase which is itself
a consequence of the time saved by the speed.
Rail travel time reduced from 4h to 3h Rail travel time reduced from 4h to 2h
Rail travel time reduced from 4h to 3h Rail travel time reduced from 4h to 2h
10%
25%
40% 50%
40%
35%
D I V Diversion
E R S I O N Ffrom
ROM ROAD
road D I V EDiversion
R S I O N Ffrom
R O Mroad
ROAD
D I V EDiversion
R S I O N Ffrom
ROMairA I R D I V EDiversion
R S I O N Ffrom
R O MairA I R
INDUCED TRAFFIC INDUCED TRAFFIC
Induced traffic Induced trafficA very explicit representation of the territory shrinking due One lesson to be drawn from such maps is that it is easier and
to faster travel is given by anamorphous maps. Such maps quicker to travel through regions benefiting from HS corridors
have been drawn for France for 1980, the year before the than it is to travel through non-equipped regions. Naturally, the
first HS line between Paris and Lyon was commissioned, and latter are unhappy with their situation and put a lot of pressure
2018, after 2 700 km of HS lines have been commissioned. on the national government for HS investment in their area.
They show that the physical geography of the country and This is probably the main reason for the progressive extension
its travelling geography do not coincide. The physical map of the HS network north and south, west and east, once a
is implicitly based on the assumption that the time spent to country has built its first successful HS line. The Japanese,
travel x km from any point in any direction is always the same. Spanish and Chinese examples all support this theory.
The anamorphous maps reduce the distance between points
if the travelling speed is higher and reciprocally increase the
distance between points if the travelling speed is slow.
Anamorphosis map of France
and China Brest
Cherbourg
Strasbourg
Le Havre Mulhouse
HIGH SPEED RAIL AND TERRITORY MANAGEMENT
Saint-Malo
Nancy Chaumont
Caen
Lorient
Rouen Besançon
Rennes Amiens Troyes
Lille
Nantes Le Mans
Dijon
An anamorphous map shows how a territory changes when Angers
Tours Paris
distances are replaced by travel times. If the global shape re- Orleans
Poitiers Annecy
La Rochelle Moulins Lyon
mains the same, as if through an homothetic transformation Angoulême Valence
Grenoble
Gan
had been made, it means that every part of the country draws Bordeaux
Clermont
Avignon
Marseille
the same benefit from the new network. If some parts of the Toulon
Limoges Montpellier
map shrink while others remain constant, it means that the Biarritz Brive
Nice
Agen
network effects do not have the same impact on the various Beziers
Pau
areas. Here, we can see that having built a grid of high speed Toulouse Perpignan
lines China has preserved its relative geography whereas in
France the West- Southern end of country is still missing high Foix
speed infrastructures.
Harbin
Changchun
Shenyang
Tianjin
Beijing Tangshan
Urumqi
Jinan
Hohhot Shijiazhuang
Taiyuan
Zhengzhou Nanjing
Yinchuan Shanghai
Lanzhou Xian Hefei
Hangzhou
Wuhan
Nanchang
Lanzhou Chengdu Chongqing Changsha
Fuzhou
Guiyang
KEYS
Kunming Guangzhou Shenzhen
Nanning
1980
2018
U IC 201830
1992 Spain Development
KEYS
C A P I TA L
HIGH SPEED LINES - ≥ 250 KM/H
HIGH SPEED LINES - < 220 KM/H
PLANNED & LONG TERM
PLANNING HIGH SPEED LINES
0 100 200 km
2010 2018 After 2018
HIGH SPEED RAIL AND TERRITORY MANAGEMENT
0 100 200 km 0 100 200 km 0 100 200 km
Japan Development
1964
KEYS
C A P I TA L
HIGH SPEED LINES - ≥ 250 KM/H
H I G H S P E E D L I N E S - 220 K M /H TO 249 K M /H
HIGH SPEED LINES - < 220 KM/H
U N DER CONSTRUCTION H IGH SPEED LI N ES
PLANNED & LONG TERM
PLANNING HIGH SPEED LINES
0 200 400 km
2000 2020 After 2020
0 200 400 km 0 200 400 km 0 200 400 kmOf course, the territorial impact is most visible around sta-
tions served by HS trains. There are multiple examples of huge
changes in districts around stations, as the increase in traffic
requires the adaptation of the station and its surroundings.
In many cases, the territorial impact is planned well in advance
to ensure it is maximised, as in China-Taiwan (where huge
areas have been reserved around new stations for real estate
development) and in Birmingham, waiting for HS2.
The most spectacular case comes from China where new cities
are planned to emerge from scratch around new HS stations.
HIGH SPEED RAIL AND TERRITORY MANAGEMENT
U IC 201832
HIGH SPEED
S TAT I O N S
HIGH SPEED STATIONS
Strategic location of stations
The location of high speed stations is strategic for the success High speed lines are normally implemented on heavy passen-
of the system because travellers like to optimise their door- ger traffic corridors where high speed trains are not only com-
to-door trip. Environmentally and economically, a high speed peting against other public transport modes (air and buses)
line only makes sense with very high traffic volumes (to offset and private cars, but also against car-pooling or car-sharing
the GHG emissions and the initial financial investment for the schemes, which provide a combination of private and public
construction) and few intermediate stops to provide fast trips transport. The following graphs portray the different door-
to customers. As a result, high speed stations are necessarily to-door timings for a passenger using the different transport
few and in general, relatively infrequent. Consequently, it is modes for a typical trip from one town A to another town
not possible for most passengers to walk to these stations B, about 250/400 km far away. They include access (from
and their location must be optimised to take advantage of the origin of the trip to the main means of transport) and
urban and regional complementarity and to enable conve- egress (from the arrival point of the main means of trans-
nient access for cars and buses. Stations may also be well port to the ultimate destination). These examples highlight
connected to airports. In other words, the accessibility of the significance of access and egress for high speed rail and
stations is key. In view of this, most high speed stations are consequently the importance of the location of stations.
constructed in city centres or consist of old stations that have
been revamped and adapted for high speed traffic. As access
and egress times form part of the door-to-door trip, these
need to be reduced to a minimum. Sometimes, in very large
urban areas, it can be worth having more than one station.Example of door-to-door travel
Transfer to Transfer Final
Starting main means of Main means to final destination Total
location transport of transport destination Total Time (hr) cost Summary
A
B €
0 min 5 min 25 min 5 min 2h10 5 min 25 min 5 min 3h40 55€ ++ -
0 min 5 min 25 min 5 min 5h15 5 min 25 min 5 min 6h35 10€ -- -
0 min 0 min 7,5 min 3h30 65€ ++ -
0 min 7,5 min 0 min 0 min 5h15
0 min 7,5 min 0 min 15 min 3h15 15 min 0 min 7,5 min 4h00 25€
+ +
0 min 5 min 25 min 10 min 3h15 5 min 25 min 5 min 4h30 20€
0 min 5 min 50 min 45 min 1h05 30 min 50 min 5 min 4h10 120€ + -
0 min 5 min 5 min 5 min 1h25 5 min 25 min 5 min 2h55 55€ ++ -
HIGH SPEED STATIONS
before Brittany HSL
KEYS
after Brittany HSL
WITHOUT HSL
WITH HSL
U IC 201834
Strategic governance of stations
Stations are the intersection point for four
major groups of actors :
Local governments for whom the station is an emblematic The following graph show the intricacies of the relationships
totem in the city with many interfaces with the surrounding between these actors. The station governance plays a crucial
districts, and local authorities who may be in charge of urban role in organising and managing the function of all these
and regional public transport; actors, including high speed rail operators who share the
station with all the other actors and have to fulfil their
The infrastructure manager whose main concern is to own specific needs and constraints to successfully attract
optimise the network capacity and who sees the station long-distance travellers.
simply as a nodal point;
The railway undertakings (train operators) who take care
that passengers can easily access their trains;
The customers and the general public who want to find out
all the required information and seek an easy way through
the station, whatever their reason for being there.
HIGH SPEED STATIONS
High speed rail stations - Relationships between station's stakeholdersStrategic location of stations
Infrastructure managers, or station managers, and cities have
followed several strategies for the locations of large stations.
In most cases, there is one large through station in the city
centre and all urban and regional transports means are
spread around the station star-style, or they go from north
to south or from west to east, serving the station in the
middle of the line.
The first one consists of transforming the two dead-end
In very large cities, there are sometimes several large dead- stations of the city into through stations by linking them,
end stations that are very well served by the urban and re- usually by means of a tunnel. Madrid is a typical illustration
gional network. In this situation, each station is oriented of this principle and this gives customers arriving on high
toward one or two points of the compass. In such situations, speeds trains from the south the option to alight in either
although the city is equipped with two or more stations, Attocha or Chamartin, depending on their final destination.
customers are only interested in one of them at any time : Antwerp provides another good example of a main dead-end
the station which serves the destination chosen for each station that has been transformed into a through station to
particular trip. For example, passengers wanting to go north provide access in the opposite direction.
will necessarily go to the Northern station because there
are no high speed trains heading north from the Southern Paris and Seoul have followed the second strategy, according
station. This example shows that having several stations to which new stations are located in areas poorly served
in the city does not actually help with station access as, from by railway. In the French capital, three high speed stations
the traveller’s point of view, there is essentially only one have been created on a rail ring around the eastern end
HIGH SPEED STATIONS
station in the city. Two strategies have been developed to of the capital.
improve this situation of providing customers with just one
access point to catch a high speed train heading towards Seoul has chosen to bore a very long tunnel giving access
a given destination. to a new dead-end station.
High speed rail nodes
Barcelona Berlin London Madrid
Spandau Gesundsbrünnen
HS2 Old Oak Possible
Common HS2-HS1 Stratford
Sagrera rail link Chamartin
Ebbsfleet
Ostbähnhof
Heathrow
Sants Haupt Euston St Pancras
Atocha
HS1
Südkreuz
Prat
New York Paris Roma Ankara
Stamford ( con )
Mantes LJ Conflans
CDG
New Rochelle
Triburtina
E Sincan Ankara
Penn N
Termini
L Marne
Newark
M
Newark Airport Versailles Austerlitz
Iselin Metropark Orly
Massy
Trenton NJ
Juvisy
Beijing Seoul Taipei Tokyo
Takasaki
Itsunomiya K Depot
EYS
Nankang Honjo-Waseda Oyama
Kumagaya Omiva
Seoul Hsichih In Operation
Ueno D E POT
Taipei Under
South Yi Zhuang Tokyo Consutruction
Yongsah I N O P E R AT I O N
Shinagawa UNDER
Planned
Gwangmyenong Baciao
Shin-Yokohama CONSTRUCTION
Odawara
Atami
PLANNED
U IC 2018You can also read


