Hipster Wars: Discovering Elements of Fashion Styles
←
→
Page content transcription
If your browser does not render page correctly, please read the page content below
Hipster Wars: Discovering Elements of Fashion
                    Styles

M. Hadi Kiapour1       Kota Yamaguchi2      Alexander C. Berg1        Tamara L. Berg1
              1
                  University of North Carolina at Chapel Hill, NC, USA
                           {hadi,aberg,tlberg}@cs.unc.edu
                              2
                                 Tohoku University, Japan
                           kyamagu@vision.is.tohoku.ac.jp

      Abstract. The clothing we wear and our identities are closely tied,
      revealing to the world clues about our wealth, occupation, and socio-
      identity. In this paper we examine questions related to what our clothing
      reveals about our personal style. We first design an online competitive
      Style Rating Game called Hipster Wars to crowd source reliable human
      judgments of style. We use this game to collect a new dataset of cloth-
      ing outfits with associated style ratings for 5 style categories: hipster,
      bohemian, pinup, preppy, and goth. Next, we train models for between-
      class and within-class classification of styles. Finally, we explore methods
      to identify clothing elements that are generally discriminative for a style,
      and methods for identifying items in a particular outfit that may indicate
      a style.

1   Introduction

To me, clothing is a form of self-expression - there are hints about who you are
in what you wear. – Marc Jacobs, fashion designer.
    Clothing reveals information about its wearer’s socio-identity, including hints
about their wealth, occupation, religion, location, and social status. In this pa-
per, we consider what clothing reveals about personal style, in particular focusing
on recognizing styles of dress such as hipster, goth, or preppy. Personal style is
closely tied to both how you perceive yourself, and how your identity is perceived
by other people. At a broader level it even reflects and/or influences the peo-
ple with whom you tend to interact and associate. We believe this makes it an
important problem for consideration because it relates to improving our under-
standing and knowledge of human socio-identity. And, because clothing styles
are generally composed of visual elements, computational vision techniques are
the best avenue for automated exploration at a large scale.
    Additionally, there are many potential research and commercial applications
of style recognition. Imagine a billboard that could tailor which advertisements
to show you as you walk by, based on what you’re wearing. Another obvious
application is personalized online shopping suggestions for clothing or other
products. The annual revenue for online shopping alone totals over $200 Billion
2 M. Hadi Kiapour, Kota Yamaguchi, Alexander C. Berg, and Tamara L. Berg
dollars annually [33], making this a growing industry for automatic applications
of computer vision. At a higher level, recognizing aspects of identity could be
used in recommendation systems for compatible matches on dating and other
social networks.
Toward efforts on style recognition, we first collect a new style dataset. The
dataset consists of 1893 images depicting five different fashion styles – bohemian,
goth, hipster, pinup, and preppy. For each image we want to identify not only
which style is reflected, but also how strongly the style is displayed, e.g. is this
person an uber hipster or only somewhat hipster. Since direct rating based mea-
sures (e.g. asking a person to rate the style from 1 to 10) often produce unstable
scores (see Fig. 4), we designed Hipster Wars (www.hipsterwars.com), a new
tournament based rating game to crowd source reliable style ratings across a
large number of people. Hipster Wars presents a user with two images and asks,
for example, which image is more hipster? A ranking algorithm is used to pro-
gressively determine style ratings based on user clicks, and to match up images
with similar ratings to produce more accurate and fine-detailed scores efficiently.
Our game was released to great success, attracting over 1700 users who provided
over 30,000 votes at the time of submission. The number of users is growing every
day.
Next, we perform a number of experiments on our new dataset related to style
recognition. The first set of experiments explore multi-class classification between
styles, e.g. which style does an image depict, hipster, goth, pinup, preppy, or
bohemian (Sec 5.1). Next we look at within class classification (Sec 5.2). Here
we want to identify the degree to which a style is exhibited, the main motivation
for collecting the pairwise comparisons using Hipster Wars.
We also attempt to automatically identify which elements of clothing are
associated with each style (Sec 6). This goal involves both exploring methods
to identify clothing elements that are generally discriminative for a style, and
methods for identifying items in a particular outfit that may indicate a style.
Though an exciting problem, style recognition has not been explored much
to date in the computer vision community. Problems related to style in general
have been explored in recent work on recognizing distinctive visual elements of
cities [7] or cars [20]. More closely related to this paper, some work attempts rec-
ognizing urban tribes in group photos of people at different social events [25, 17].
In that work, style recognition is treated as a multi-class classification problem
where the goal is to predict which of k styles is depicted by a group of people.
We take these efforts in a new direction by making use of state-of-the-art meth-
ods for clothing recognition to recognize style based only on the clothing that
an individual person is wearing. Additionally, we examine two new problems:
recognizing the strength of style depicted (e.g. how hipster is this person?), and
recognizing which elements of clothing influence perception of style (e.g. which
outfit items indicate that this person is a hipster?).
In summary, the main contributions of our paper are:
1. An online competitive Rating Game to collectively compute style ratings
based on human judgments.Hipster Wars: Discovering Elements of Fashion Styles 3
2. A new style dataset depicting different fashion styles with associated crowd
sourced style ratings.
3. Between-Class classification of styles, i.e. differentiating between the different
style categories.
4. Within-Class classification of styles, i.e. differentiating between high and low
ranked images within a style category.
5. Experiments to identify the outfit elements that are most predictive for each
style (what makes a hipster hip) or within an image (what makes this par-
ticular person so hipster).
2 Related Work
Clothing Recognition: Identifying clothing in images has drawn recent atten-
tion in the computer vision community due to the vast potential for commercial
applications such as context-aware advertisements and visual online shopping.
Recent papers have looked at the problem of parsing clothing (predicting pixel-
wise labelings of garment items) [35, 36] and clothing recognition for applica-
tions [22, 23, 11]. Parsing approaches take advantage of effective methods for
human pose estimation [37]. Two different clothing parsing scenarios are exam-
ined, weakly supervised parsing where predictions are restricted to annotated
garment item labels [35] and unrestricted parsing where the garment item labels
are not provided [36]. The second scenario [36] is more appropriate for our task
so we make use of this method here.
Attributes: Predicting useful mid-level semantic representations such as at-
tributes have been well studied recently. Attribute methods have been applied
to objects [16, 26, 14, 18, 9, 32], scenes [21, 34], and products [27, 13, 12]. Addi-
tionally attributes have been explored specifically in the context of clothing for
describing attributes of upper body clothing [1] or for jointly estimating cloth-
ing attributes in a CRF based approach [4]. Work on attributes is related to
our goal in that we also want to produce a mid-level representation. In our case
we would like to predict the mid-level elements that are most indicative of a
particular style of clothing. Currently we consider garments as our elements, but
attributes would be a potential next step toward discovering distinctive predic-
tors of a style.
Games for Image Annotation: Large-scale labeling of image data by people
is becoming popular in the computer vision community, sometimes using do-
main experts for very specific labeling tasks [15], and alternatively addressing
tasks requiring less specialized expertise or using a combination of human and
computer feedback to allow non-experts to label imagery [13, 2, 3]. To more ef-
fectively leverage human labeling, some approaches make the labeling process
into an entertaining game, as in the ESP Game [29] or [30]. More recently [6]
uses a game setting to label important regions for fine-grained classification.
Recognizing Styles: Recently Doersch et al look at the problem of selecting
discriminative patches that distinguish between the styles of different cities [7].
Lee et al use a related method to discover style elements connecting objects in4 M. Hadi Kiapour, Kota Yamaguchi, Alexander C. Berg, and Tamara L. Berg
120
100
Number of Players
80
60
40
20
0
0 100 200 300 400 500
Number of Games Played
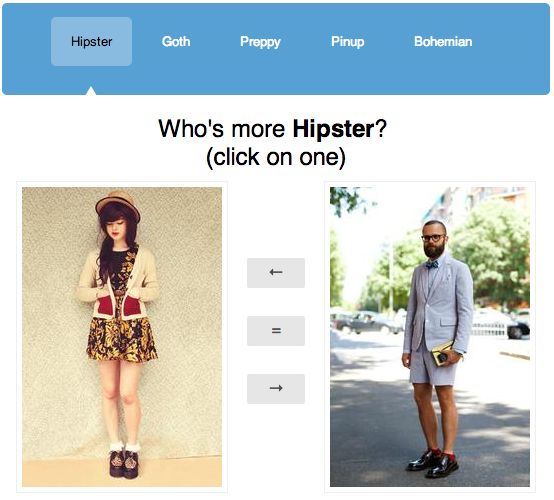
(a) Snapshot of the game (b) Distribution of games played
Fig. 1: Left shows an example game for the hipster category on Hipster Wars. Users
click on whichever image is more hipster or click “=” for a tie. Right shows the number
of games played per player.
space and time. Most related to our work are methods to recognize social tribe of
people in group photographs of events [25, 17]. We address a somewhat different
problem, considering photos of individuals instead of groups and not making
use of any features from the image backgrounds. In addition we analyze and
predict the degree to which a style is exhibited. We also consider a new problem
of predicting which outfit items most indicate styles in general, and which outfit
elements indicate a specific person’s style.
3 Hipster Wars: Style Dataset & Rating Game
To study style prediction we first collect a new dataset depicting different fashion
styles (Section 3.1). We then design a crowd-sourcing game called Hipster Wars
to elicit style ratings for the images in our dataset (Section 3.2).
3.1 Data Collection
We collect a new dataset of images depicting five fashion styles, Bohemian,
Goth, Hipster, Pinup, and Preppy. To construct our initial seed corpus, we query
Google Image Search using each style name and download top ranked images. We
then use Google’s “Find Visually Similar Images” feature to retrieve thousands
of additional visually similar images to our seed set and manually select images
with good quality, full body outfit shots. We repeat this process with expanded
search terms, e.g. “pinup clothing” or “pinup dress”, to collect 1893 images in
total. The images exhibit the styles to varying degrees.
3.2 Rating Game
We want to rate the images in each style category according to how strongly
they depict the associated style. As we show in section 3.5, simply asking people
to rate individual images directly can produce unstable results because each
person may have a different internal scale for ratings. Therefore, we develop an
online game to collectively crowd-source ratings for all images within each style
category. A snapshot of the game is shown in Figure 1a.Hipster Wars: Discovering Elements of Fashion Styles 5
Bohemian Goth
50 50
40 40
Score 30 30
Score
20 20
10 10
0 0
0 100 200 300 400 0 100 200 300 400
Samples Sorted by Score Samples Sorted by Score
(a) Bohemian (b) Goth
Fig. 2: Style scores computed by our Style Rating Game, showing means and uncer-
tainties for images sorted from smallest to largest mean.
Our game is designed as a tournament where a user is presented with a
pair of images from one of the style categories and asked to click on whichever
image more strongly depicts the solicited style, or to select “Tie” if the images
equally depict the style. For example, for images in the hipster category the user
would be asked “Who’s more hipster?” After each pair of images, the user is
provided with feedback related to the winning and losing statistics of the pair
from previous rounds of the tournament.
Because we cannot afford to gather comparisons for all pairs of images in our
dataset, we make use of the TrueSkill algorithm [10]. This algorithm iteratively
determines which pair of images to compare in each tournament, and based on
user input successively updates the ratings of images in our dataset. TrueSkill
is a popular ranking system, originally developed to pair users in XBox Live.
Though it was originally developed to pair players and determine their gaming
skill levels, it is a general model that can be applied in any competitive game.
Here we apply it to images.
There are several reasons we choose the TrueSkill algorithm. For each tour-
nament the algorithm pairs up images with similar estimated ratings. Therefore
over time we are able to focus on finer-grained distinctions between images and
minimize the number of comparisons we need to make to estimate the true image
ratings. Additionally, the algorithm is online (as opposed to batch). Users can
upload their own photos and merge them seamlessly into the tournaments even
after the game has started. The algorithm is also efficient, allowing us to update
rankings in real-time after each tournament even when many users are playing at
once. It also explicitly allows for ties and models uncertainty in ratings. Finally,
TrueSkill converges quickly, reducing the number of games necessary to compute
ratings for images.
3.3 Game Details
Each image is associated with a skill variable, s, representing how strongly the
image represents the associated style. Our goal is to determine this skill level for
each image in the dataset. An image’s skill is modeled by a Gaussian distribution
with mean, µ, and variance, σ 2 , where s ∼ N (s; µ, σ 2 ). As different users play6 M. Hadi Kiapour, Kota Yamaguchi, Alexander C. Berg, and Tamara L. Berg
the tournaments there may be variations in how the styles are perceived, this
is modeled with another variable, p, a Gaussian distribution around skill level,
p ∼ N (p; s, β 2 ).
Updating after Win/Loss: After each tournament is played, if the tournament
does not result in a tie, we update the skill estimates for the winning player as:
2
σwinner (µwinner − µloser )
µwinner ← µwinner + .V , (1)
c c c
σ2
2 2 (µwinner − µloser )
σwinner ← σwinner . 1 − winner .W , (2)
c2 c c
(3)
Where:
G0,1 (a − b)
V(a, b) = (4)
Φ0,1 (a − b)
W(a, b) = V(a, b) · (V(a, b) + a − b) (5)
c2 = 2β 2 + σwinner
2 2
+ σloser (6)
Where G0,1 and Φ0,1 are the PDF and CDF of normal distributions with zero
mean and unit variance. The intuition behind these updates is that if the win
was expected, i.e. the difference between skills of the winner image and the losing
image was large relative to the total uncertainty, c, then the update on image
skill estimates will be small. However, if the outcome of the tournament was
surprising, the updates will be larger. Similar update rules are applied for the
loser of the tournament.
Updating after Tie: If a tournament is tied, V and W are computed as:
G0,1 (−b − a) − G0,1 (b − a)
V(a, b) = (7)
Φ0,1 (b − a) − Φ0,1 (−b − a)
(b − a) · G0,1 (b − a) + (a + b) · G0,1 (a + b)
W(a, b) = V2 (a, b) + (8)
Φ0,1 (b − a) − Φ0,1 (−b − a)
Similar intuition applies here. If both images already had similar skill levels
there are not significant updates on beliefs for either image. If the result was
more surprising, updates are more significant.
Selecting Pairs: For each tournament we must select a pair of images to play
against each other. We would like to optimize two things: every image should be
played enough times to reliably determine its rating, and we would like to pair
up images with similar ratings estimates in order to produce fine-grained esti-
mates of their ratings. Therefore, to select pairs we first choose the least played
image from the dataset and then we choose as its pair, the image with highest
probability of creating a draw with that image (to maximize the informativeness
of each tournament) which following [10] is computed as:
s !
2
2 2β 2 (µi − µj )
qdraw (β , µi , µj , σi , σj ) ≡ · exp − (9)
2β 2 + σi2 + σj2 2(2β 2 + σi2 + σj2Hipster Wars: Discovering Elements of Fashion Styles 7
Most Least
Pinup
Goth
Hipster
Bohemian
Preppy
Fig. 3: Example results from our style rating game, Hipster Wars. Top and bottom
rated for each style category.
Implementation details: We design our game such that image scores fall into
the range [0, 50]. Our ranking system initializes ratings for all images with µ = 25
and uncertainty σ = 25 3 . Value for , the draw margin, is calculated based on a
10% chance of draw assumed in every game and default value for β is set to 25 6 .
Finally the ‘true skill’ of each image is given by µ − 3σ, a conservative estimate
which ensures images with high skill means and least uncertainties will be placed
on the top.
3.4 Game Results
Our style rating game was played by 1702 users for over 30,000 tournaments. On
average users played about 18.5 tournaments, indicating reasonable engagement.
Some users played hundreds of tournaments, with a max of 465. The distribution
of number of games played per user is shown in Figure 1b. Scores sorted by
their mean along with their uncertainty for two sample categories are shown in
Figure 2.
This produces very reasonable ratings for each style category. Top and bottom
rated images for each style are shown in Figure 3. Top rated images tend to
depict very strong indications of the associated style while images rated toward
the bottom of the set depict the style with much less strength.8 M. Hadi Kiapour, Kota Yamaguchi, Alexander C. Berg, and Tamara L. Berg
Hipster Hipster
10 1 Pairwise
comparison
wins
100%
0%
9
Winning probability from Mech. Turk
0.9 Simulated
Turk
ra8ng
wins
8 0.8 40%
28%
Mech. Turk avg. rating
7 0.7
A Hipster
Wars
TrueSkill
score
29.80
23.72
6 0.6 Turk
ra8ngs
5 5,6,6,9,10
5,6,6,6,10
0.5
Pairwise
comparison
wins
4 0.4 A from
Hipster
Wars
3 B 100%
0%
0.3
Simulated
Turk
ra8ng
wins
2 0.2 32%
52%
1 0.1
B Hipster
Wars
TrueSkill
score
33.16
31.01
0 0
0 2 4 6 8 10 0 0.2 0.4 0.6 0.8 1 Turk
ra8ngs
Hipster Wars skill level Winning probability from Hipster Wars 5,6,7,8,9
4,7,8,9,9
(a) (b) (c)
Fig. 4: Hipster Wars Pairwise ratings vs. individual ratings from Amazon Mech. Turk.
3.5 Pairwise vs. Individual Ratings
In order to evaluate the effectiveness of pairwise comparisons on Hipster Wars
over a standard approach of rating style independently for each image, we used
Amazon Mechanical Turk to conduct the following experiment. For each of the
style categories, we divided the range of skills obtained from Hipster Wars into
10 equal size intervals which we call skill levels ( 1 :lowest, 10 :highest) and
picked a subset of 100 images distributed uniformly over the intervals. For each
of the images, we asked 5 individuals (on Mechanical Turk) to rate the degree of
a particular style category. Example ratings from all skill levels were provided.
Figure 4a shows a scatter plot of average ratings from Mechanical Turk vs the
skill level estimated by Hipster Wars. Figure 4b shows the average ratings vs the
actual win percentage of games on Hipster Wars. In general the ratings are much
noisier than either the direct pairwise comparisons or the skill level estimated
by Hipster Wars. Figure 4c shows example pairs where this discrepancy is very
large. These results indicate that the pairwise comparison approach can provide
more stable and useful ratings for subtle cues like style.
4 Style Representation
We represent the style of outfits using a number of visual descriptors found to be
useful for clothing recognition tasks [36], including descriptors related to color,
texture, and shape. In particular, we calculate a vector of the following features
at each pixel within a patch centered around the pixel: a) RGB color value, b)
Lab color value, c) MR8 texture response [28] (to encode local patterns) d) HOG
descriptor [5] (to measure local object shape), e) Distance from image border,
f) Probability of pixels belonging to skin and hair categories [36].
We form the Style Descriptor by accumulating these features following [36],
but without dimensionality reduction to capture the details of clothing appear-
ance. The exact procedure is the following: 1) We first estimate body pose [37].
2) For each of the 24 estimated body part keypoints, we extract an image patch
of size 32×32 pixels surrounding the keypoint. 3) We split each image patch intoHipster Wars: Discovering Elements of Fashion Styles 9
Style Descriptor LLC Color Hist Style Descriptor LLC Color Hist
0.8 0.8
Bohemian Goth Hipster Pinup Preppy
Bohemian 1904 99 135 73 99
0.7 0.7
Goth 83 1763 168 21 75
0.6 0.6
Hipster 188 303 1012 39 338
0.5 0.5
Pinup 137 59 27 668 47
0.4 0.4
Preppy 228 233 281 107 1313
0.3 0.3
0.9 0.8 0.7 0.6 0.5 0.9 0.8 0.7 0.6 0.5
Quantile Quantile
(c) Confusion matrix of 5 way clothing
(a) Accuracy (b) Average F-1 style classification at δ = 0.5
Fig. 5: Between-Class classification results showing accuracy and average f-1 scores for
each style computed over random 100 folds for the classification of the top δ% rated
images. Error bars are 95% confidence intervals from statistical bootstrapping.
4 × 4 cells and mean-std pooling of the features described above are computed.
4) We concatenate all pooled features over all 24 patches, for a total of 39, 168
dimensions.
We compared the classification performance of Style Descriptor against two
other global visual descriptors computed on the detected bounding box by pose
estimator: LLC encoding [31] of local SIFT [24] descriptors and color histogram.
For LLC we extract SIFT features on a dense grid over the image and use
LLC coding to transform each local descriptor into a sparse code and apply a
multi-scale spatial pyramid (1×1, 2×2, 4×4) [19] max-pooling to obtain the final
43008-dimensional representation. Color histogram features were constructed by
quantizing the R,G,B channels into 16 bins each, giving a final 4096-dimensional
histogram for each image.
5 Predicting Clothing Styles
We consider two different style recognition tasks: Between-class classification
- Classifying outfits into one of the five fashion styles (Sec 5.1). Within-class
classification - differentiating between high and low rated images for each style
(Sec 5.2). For each of these tasks, we compare Style Descriptor versus the other
global descriptors which we considered as baseline. In all classification experi-
ments we use a linear kernel SVM using the liblinear package [8].
5.1 Between-class classification
We consider classifying images as one of five styles. Results examine how per-
formance varies for different splits of the data, defining a parameter δ which
determines what percentage of the data is used in classification. We vary values
of δ from 0.1 to 0.5 where δ = 0.1 represents a classification task between the top
rated 10% of images from each style (using the ratings computed in Sec 3.2). We
use a 9 : 1 train to test ratio, and repeat the train-test process 100 times. The
results of our between-class classification are shown in Figure 5. Performance is
good, varying slowly with δ, and the pattern of confusions is reasonable.10 M. Hadi Kiapour, Kota Yamaguchi, Alexander C. Berg, and Tamara L. Berg
Most (Predicted) Least (Predicted)
Pinup
Goth
Hipster
Bohemian
Preppy
Fig. 6: Example results of within-classification task with δ = 0.5. Top and bottom
predictions for each style category are shown.
5.2 Within-class classification
Our next style recognition tasks considers classification between top rated and
bottom rated examples for each style independently. Here we learn one linear
SVM model for each style. The variable δ = 10% . . . 50% determines the percent-
age of top and bottom ranked images considered. For example, δ = 0.1 means
the top rated 10% of images are used as positives and the bottom rated 10%
of samples as negatives. We repeat the experiments for 100 random folds with
a 9 : 1 train to test ratio. In each experiment, C, is determined using 5 fold
cross-validation.
Results are reported in Figure 7. We observe that when δ is small we generally
have better performance than for larger δ, probably because the classification
task becomes more challenging as we add less extreme examples of each style.
Additionally, we find best performance on the pinup category. Performance on
the goth category comes in second. For the hipster category, we do quite well
at differentiating between extremely strong or weak examples, but performance
drops off quickly as δ increases. Example predictions for each style are shown in
Figure 6.Hipster Wars: Discovering Elements of Fashion Styles 11
1 1
0.9 0.9
0.8 0.8
0.7 0.7
0.6 0.6
0.5 0.5
0.4 0.4
0.3 Bohemian 0.3 Bohemian
Goth Goth
0.2 Hipster 0.2 Hipster
0.1 Pinup 0.1 Pinup
Preppy Preppy
0 0
0.9 0.8 0.7 0.6 0.5 0.9 0.8 0.7 0.6 0.5
Quantile Quantile
(a) Precision (b) Recall
Style Descriptor LLC Color Hist Style Descriptor LLC Color Hist
1 1
0.9 0.9
0.8 0.8
0.7 0.7
0.6 0.6
0.5 0.5
0.4 0.4
0.3 0.3
Bohemian Goth Hipster Pinup Preppy Bohemian Goth Hipster Pinup Preppy
Quantile Quantile
(c) Accuracy (δ = 0.2) (d) F-1 (δ = 0.2)
Fig. 7: Within-Class classification results averaged for each style computed over random
100 folds balanced classification of the top and bottom δ% quartiles. Error bars are
95% confidence intervals from statistical bootstrapping.
6 Discovering the Elements of Styles
In this section, we are interested in two different questions: 1) what elements of
style contribute to people in general being a hipster (or goth or preppy, etc), and
2) for a particular photo of a person, what elements of their outfit indicate that
they are a hipster (or goth or preppy, etc)?
6.1 General Style Indicators
We would like to determine which garment items are most indicative of each
style in general. For this, we compute clothing segmentation on all images of each
style, and obtain the percentage of each predicted garment item present. Figure 8
shows the percentage of pixels occupied by each garment item across images of
each style. Based on this automatic analysis, we can make some interesting
observations using our clothing recognition predictions. For example, we find
that pinups and bohemians tend to wear dresses whereas hipsters and preppies
do not. Goths fall somewhere in between. Pinups also tend to display a lot of
skin while this is less true for goths. Hipsters and preppies wear the most jeans
and pants. Preppies tend to wear more blazers while goths and hipsters wear the
most boots.12 M. Hadi Kiapour, Kota Yamaguchi, Alexander C. Berg, and Tamara L. Berg
0.4
0.35
Bohemian
0.3
Goth
0.25
0.2
Hipster
0.15
0.1
Pinup
0.05
Preppy
0
g
bl t
bl r
bo
rd
n
dr
s
ir
ja s
je
le ns
pa
s
sh
sh s
sw irt
=g r
s
p
r
se
ca ots
at
et
gs
irt
ts
in
l
e
te
he
es
el
nt
oe
ht
ba
iga
to
be
ha
or
sk
co
ck
az
in
ou
sh
sk
a
he
ea
Ot
gg
Fig. 8: Clothing items across styles.
6.2 Style Indicators for Individuals
Our second approach is a bit more complex. In this model we make use of our
models trained on Style Descriptors. We essentially transfer predictions from the
Style Descriptor to the underlying parse while making use of computed priors
on which garment items are most likely for each style.
Discriminative part discovery: Suppose we have a set of image features xi
from each part i that we locate from a pose estimator. Then our style prediction
model can be described by a linear model:
X
y= wiT xi + b, (10)
i∈parts
where y is a decision value of the prediction, wi is model parameters correspond-
ing to part i, and b is a bias parameter.
In this paper, we specifically view the individual term wi xi as a distance from
the decision boundary for part i in the classification, and utilize the weights to
localize where discriminative parts are located in the input image. This interpre-
tation is possible when the input to the linear model is uniformly interpretable,
i.e., same feature from different locations. Also to guarantee the equivalence of
parts interpretation, we normalize the part features xi to have zero-mean and
uniform standard deviation in training data.
To calculate the score of the part i, we apply a sigmoid function on the
decision value and get probabilities of a style given a single part:
1
pi ≡ . (11)
1 + exp −wiT xi
Learning is done in the same manner as within-class style classification, using
L2-regularized logistic regression.
From parts to items: Part scores tell us which locations in the outfit are affect-
ing style prediction. However, to convert these to an interpretable prediction, we
map predicted garments back to garments predicted in the original parse. This
produces a more semantic output, e.g. “She looks like a hipster because of her
hat.” To map parts to garments in the parse, we first compute a saliency map of
parts; At each keypoint, we project the part score p(xi ) to all pixels in the patchHipster Wars: Discovering Elements of Fashion Styles 13
Bohemian
background hair 0.524
skin skin 0.521
hair skirt 0.515
bag bag 0.511
flats shirt 0.509
shirt flats 0.509
skirt background 0.503
Input Clothing parse Part saliency Item saliency Item scores
Fig. 9: From parts to items. We compute contributions of each part, and project them
in image coordinates (Part saliency). Then, using clothing parse, we compute the scores
of items. When the score is above 0.5, the associated item indicates a positive influence
on the queried style. Note that the scores only show the relative strength of style-
indication among items in the picture.
location. Articulated parts get the average score from all parts. Areas outside of
any patch are set to 1/2 (i.e., decision boundary). Using the computed clothing
segmentation [36], we compute the average score of each garment item from the
saliency map. This produces, for each item k in the clothing parse of an image,
a score pk that we can use to predict items that strongly indicate a style. Figure
9 depicts this process.
Prior filtering: The result of part-based factorization can still look noisy due
to errors in pose estimation and clothing parsing. Therefore, we smooth our
predictions with a prior on which garment items we expect to be associated
with each style.
Our prior is constructed by building a linear classifier based on the area of
each clothing item that we obtain from the clothing segmentation [36]. Denoting
the log pixel-count
P of item k by xk , we express the prior model by a linear
function: y = k wk xk + b, where y is the decision value of style classification,
and wk and b are model parameters. Using the same idea from the previous
1
subsections, we compute the score of each item by: qk ≡ 1+exp(−w k xk )
.
Once we compute the part-based score pk and the prior score qk , we merge
them into the final indicator score rk for garment-item k:
σp 1 1
rk ≡ λ1 pk + λ2 qk − + , (12)
σq 2 2
where λ1 and λ2 , are weights given to each score, σp and σq are standard de-
viations of pk and qk at each image. The intuition here is that we assume both
pk and qk follow a normal distribution with mean at 0.5. We adjust the shape
of qk distribution to that of pk in the second term. Then, we use λ’s to mix two
scores and produce the final result. We set λ’s to cross-validation accuracies of
classification during training normalized to sum to a unit, so that the resulting
score reflects the accuracy of style prediction.14 M. Hadi Kiapour, Kota Yamaguchi, Alexander C. Berg, and Tamara L. Berg
Preppy Hipster
boots
shirt shoes
skin t-shirt
hair hair
skirt skin
background pants
heels background
Fig. 10: Example predicted style indicators for individuals.
Method Bohemian Goth Hipster Pinup Preppy
Random 0.357 0.258 0.171 0.427 0.232
Our method 0.379 0.282 0.154 0.454 0.241
Table 1: Ratio of images that include the top choice from crowds in the first 5 elements
of our discovery method.
6.3 Analysis of Style Indicator for Individuals
Figure 10 shows examples of discovered style indicators for individuals. Predicted
elements for each outfit are ordered by indicator scores. We find that our method
captures the most important garment-items well such as shirt for preppy styles,
graphic t-shirts for hipsters, or dresses for pinups.
We also attempted to quantitatively verify the results using crowdsourcing.
We obtained the “ground truth” by asking workers to vote on which element they
think is making a certain style. However, the naive application of this approach
resulted in a number of problems; 1) workers tend to just vote on all visible items
in the picture, 2) small items are ignored, 3) workers mark different items with
a different name (e.g., shoes vs. flats) and 4) different workers are not consistent
due to the great subjectivity in the question. We show in Table 1 the ratio of
images from our discovery that included the worker’s top choice. Our method
achieved slightly better result than the random ordering. However, we note that
the “ground truth” in this evaluation does not necessarily constitute a good
measurement for benchmarking, leaving open the question of how to “ground
truth” annotation for such subtle socially-defined signals.
7 Conclusions
We have designed a new game for gathering human judgments of style ratings
and have used this game to collect a new dataset of rated style images. We
have explored recognizing and estimating the degree of fashion styles. We have
also begun efforts to recognize which elements of outfits indicate styles generally
and which items in a particular outfit indicate a style. Results indicate that it is
possible to determine whether you are a hipster and that it may even be possible
to determine why you are a hipster! (We gratefully acknowledge NSF Award#
1444234, and Google Faculty Award, ”Seeing Social”.)Hipster Wars: Discovering Elements of Fashion Styles 15
References
1. Bossard, L., Dantone, M., Leistner, C., Wengert, C., Quack, T., Van Gool, L.:
Apparel classification with style. ACCV pp. 1–14 (2012)
2. bourdev, L., Malik, J.: Poselets: Body part detectors trained using 3d human pose
annotations. In: Computer Vision, 2009 IEEE 12th International Conference on.
pp. 1365–1372. IEEE (2009)
3. Branson, S., Wah, C., Babenko, B., Schroff, F., Welinder, P., Perona, P., Belongie,
S.: Visual recognition with humans in the loop. In: Computer Vision–ECCV 2010,
pp. 663–676. Springer (2010)
4. Chen, H., Gallagher, A., Girod, B.: Describing clothing by semantic attributes. In:
ECCV, pp. 609–623 (2012)
5. Dalal, N., Triggs, B.: Histograms of oriented gradients for human detection. In:
Computer Vision and Pattern Recognition, 2005. CVPR 2005. IEEE Computer
Society Conference on. vol. 1, pp. 886–893 vol. 1 (2005)
6. Deng, J., Krause, J., Fei-Fei, L.: Fine-grained crowdsourcing for fine-grained recog-
nition. In: Computer Vision and Pattern Recognition (CVPR), 2013 IEEE Con-
ference on. IEEE (2013)
7. Doersch, C., Singh, S., Gupta, A., Sivic, J., Efros, A.A.: What makes paris look
like paris? ACM Transactions on Graphics (SIGGRAPH) 31(4) (2012)
8. Fan, R.E., Chang, K.W., Hsieh, C.J., Wang, X.R., Lin, C.J.: Liblinear: A library
for large linear classification. Journal of Machine Learning Research (2008)
9. Ferrari, V., Zisserman, A.: Learning visual attributes. NIPS (2007)
10. Herbrich, R., Minka, T., Graepel, T.: Trueskill(tm): A bayesian skill rating system.
In: Advances in Neural Information Processing Systems. pp. 569–576 (2007)
11. Kalantidis, Y., Kennedy, L., Li, L.J.: Getting the look: clothing recognition and seg-
mentation for automatic product suggestions in everyday photos. In: Proceedings
of the 3rd ACM conference on International conference on multimedia retrieval.
pp. 105–112. ACM (2013)
12. Kovashka, A., Grauman, K.: Attribute pivots for guiding relevance feedback in
image search. In: ICCV (2013)
13. Kovashka, A., Parikh, D., Grauman, K.: Whittlesearch: Image search with relative
attribute feedback. In: CVPR. pp. 2973–2980. IEEE (2012)
14. Kumar, N., Berg, A., Belhumeur, P., Nayar, S.: Attribute and simile classifiers for
face verification. In: ICCV (2009)
15. Kumar, N., Belhumeur, P.N., Biswas, A., Jacobs, D.W., Kress, W.J., Lopez, I.,
Soares, J.V.B.: Leafsnap: A computer vision system for automatic plant species
identification. In: Computer Vision–ECCV 2012, pp. 663–676. Springer (2012)
16. Kumar, N., Berg, A.C., Belhumeur, P.N., Nayar, S.K.: Describable visual attributes
for face verification and image search. In: IEEE Transactions on Pattern Analysis
and Machine Intelligence (PAMI) (October 2011)
17. Kwak, I.S., Murillo, A.C., Belhumeur, P., Belongie, S., Kriegman, D.: From bikers
to surfers: Visual recognition of urban tribes. In: British Machine Vision Conference
(BMVC). Bristol (September 2013)
18. Lampert, C., Nickisch, H., Harmeling, S.: Learning to detect unseen object classes
by between-class attribute transfer. In: CVPR (2009)
19. Lazebnik, S., Schmid, C., Ponce, J.: Beyond bags of features: Spatial pyramid
matching for recognizing natural scene categories. In: Computer Vision and Pattern
Recognition (CVPR), 2006 IEEE Conference on. IEEE (2006)16 M. Hadi Kiapour, Kota Yamaguchi, Alexander C. Berg, and Tamara L. Berg
20. Lee, Y.J., Efros, A.A., Hebert, M.: Style-aware mid-level representation for discov-
ering visual connections in space and time. In: ICCV (2013)
21. Li, L.J., Su, H., Lim, Y., Fei-Fei, L.: Objects as attributes for scene classification.
In: European Conference of Computer Vision (ECCV), International Workshop on
Parts and Attributes. Crete, Greece (September 2010)
22. Liu, S., Feng, J., Song, Z., Zhang, T., Lu, H., Xu, C., Yan, S.: Hi, magic closet, tell
me what to wear! In: ACM international conference on Multimedia. pp. 619–628.
ACM (2012)
23. Liu, S., Song, Z., Liu, G., Xu, C., Lu, H., Yan, S.: Street-to-shop: Cross-scenario
clothing retrieval via parts alignment and auxiliary set. In: CVPR. pp. 3330–3337
(2012)
24. Lowe, D.: Object recognition from local scale-invariant features. In: ICCV. pp.
1150–1157 (1999)
25. Murillo, A.C., Kwak, I.S., Bourdev, L., Kriegman, D., Belongie, S.: Urban tribes:
Analyzing group photos from a social perspective. In: CVPR Workshop on Socially
Intelligent Surveillance and Monitoring (SISM). Providence, RI (June 2012)
26. Parikh, D., Grauman, K.: Interactively building a discriminative vocabulary of
nameable attributes. In: CVPR (2011)
27. Parikh, D., Grauman, K.: Relative attributes. In: ICCV (2011)
28. Varma, M., Zisserman, A.: A statistical approach to texture classification
from single images. Int. J. Comput. Vision 62(1-2), 61–81 (Apr 2005),
http://dx.doi.org/10.1007/s11263-005-4635-4
29. Von Ahn, L., Dabbish, L.: Labeling images with a computer game. In: SIGCHI
Conference on Human Factors in Computing Systems (CHI), 2004. pp. 319–326.
ACM (2004)
30. Von Ahn, L., Liu, R., Blum, M.: Peekaboom: a game for locating objects in images.
In: Conference on Human Factors in Computing Systems (CHI), 2004 (2006)
31. Wang, J., Yang, J., Yu, K., T. Huang, F.L., Gong, Y.: Locality-constrained lin-
ear coding for image classification. In: Computer Vision and Pattern Recognition
(CVPR), 2010 IEEE Conference on. IEEE (2010)
32. Wang, Y., Mori, G.: A discriminative latent model of object classes and attributes.
In: European Conference on Computer Vision (2010)
33. Wu, S.: Online-retail spending at $200 billion annually and growing. Wall street
journal digits blog (Feb 2012)
34. Xiao, J., Hays, J., Ehinger, K.A., Oliva, A., Torralba, A.: Sun database: Large-scale
scene recognition from abbey to zoo. In: Computer vision and pattern recognition
(CVPR), 2010 IEEE conference on. pp. 3485–3492. IEEE (2010)
35. Yamaguchi, K., Kiapour, M.H., Berg, T.L.: Parsing clothing in fash-
ion photographs. In: Proceedings of the 2012 IEEE Conference on
Computer Vision and Pattern Recognition (CVPR). pp. 3570–3577.
CVPR ’12, IEEE Computer Society, Washington, DC, USA (2012),
http://dl.acm.org/citation.cfm?id=2354409.2355126
36. Yamaguchi, K., Kiapour, M.H., Berg, T.L.: Paper doll parsing: Retrieving similar
styles to parse clothing items. In: Computer Vision (ICCV), 2013 IEEE Interna-
tional Conference on (2013)
37. Yang, Y., Ramanan, D.: Articulated pose estimation with flexible mixtures-of-
parts. In: CVPR. pp. 1385–1392 (2011)You can also read