Horizons et Tendances - EPAS
←
→
Page content transcription
If your browser does not render page correctly, please read the page content below

Horizons et Tendances, 9 janvier 2019   1

Formation continue

Horizons et Tendances

Mercredi 15 janvier 2020, Lausanne

                                                               www.epas.ch

                                         Horizons et Tendances, 9 janvier 2019   2

Horizons et Tendances, 15 janvier 2020

Perspectives économiques /
investissements 2020
Vincent Juvyns

                                                               www.epas.ch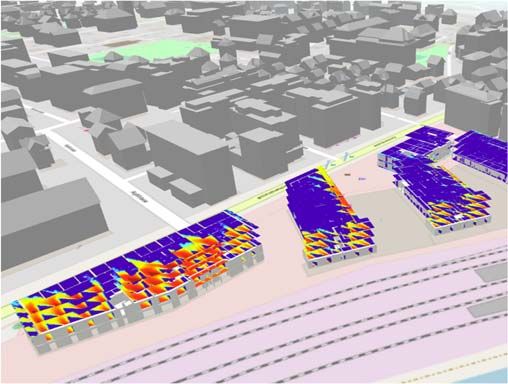
Global growth GTM – Europe |4
Real GDP growth Contribution to global real GDP growth
% change year on year % change year on year
6 5
4 4
Global economy
2 3
0 2
-2 1
-4 0
2020
consensus forecast Global
-6 -1 China
US 1,8%
EM ex-China
UK 1,1%
-8 -2 DM ex-US
Eurozone 1,0%
US
Japan 0,3%
-10 -3
'00 '02 '04 '06 '08 '10 '12 '14 '16 '18 '20 '85 '88 '91 '94 '97 '00 '03 '06 '09 '12 '15 '18
Source: (Left) BEA, Bloomberg, Eurostat, Japan Cabinet Office, ONS, Refinitiv Datastream, J.P. Morgan Asset Management. Forecasts are from Bloomberg contributor composite. (Right) Refinitiv Datastream, World Bank,
J.P. Morgan Asset Management. EM is emerging markets. DM is developed markets.
Past performance is not a reliable indicator of current and future results. Guide to the Markets - Europe. Data as of 31 December 2019.
3
Global Purchasing Managers’ Index (PMI) for manufacturing GTM – Europe | 5
2019
2008 2009 2010 2011 2012 2013 2014 2015 2016 2017 2018 2019
Nov Dec
Global 50,3 50,1
Developed 49,5 49,1
Emerging 51,0 51,0
Global economy
Eurozone 46,9 46,3
France 51,7 50,4
Germany 44,1 43,7
Eurozone
Italy 47,6 46,2
Spain 47,5 47,4
Greece 54,1 53,9
Ireland 49,7 49,5
Sweden 45,7 47,1
Developed
Switzerland 48,8 50,2
UK 48,9 47,5
US 52,6 52,4
Japan 48,9 48,8
China 51,8 51,5
Indonesia 48,2 49,5
Korea 49,4 50,1
Emerging
Taiwan 49,8 50,8
India 51,2 52,7
Brazil 52,9 50,2
Mexico 48,0 47,1
Russia 45,6 47,5
Source: Markit, J.P. Morgan Asset Management. The Global Purchasing Managers’ Index (PMI) for manufacturing assesses the economic health of the sector by
surveying manufacturing businesses regarding output, new orders, stocks of purchases, supplier delivery times and employment. A score of 50 indicates that economic
activity is neither expanding nor contracting, above 50 indicates expansion. The colours range from red to yellow to green, where red is below 50, yellow is at 50 and
green is above 50. Quarterly averages are shown, except the two most recent monthly data points. Past performance is not a reliable indicator of current and future
results. Guide to the Markets - Europe. Data as of 31 December 2019.
4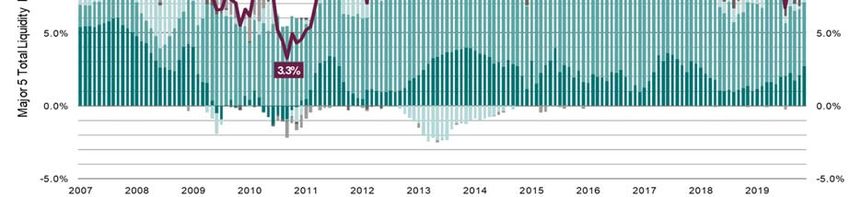
Global core inflation and inflation expectations GTM – Europe |8
Core inflation Market-based inflation expectations
% change year on year %, 5y5y inflation swap
5 5
4 4 UK
Global economy
Headline inflation
target
3 3
US
2 2
1 1 Eurozone
Japan
0 0
US
-1 UK -1
Eurozone
Japan
-2 -2
'07 '09 '11 '13 '15 '17 '19 '07 '09 '11 '13 '15 '17 '19
Source: (Left) Bank of Japan, BLS, Eurostat, ONS, Refinitiv Datastream, J.P. Morgan Asset Management. CPI is the Consumer Price Index. Core inflation for the US is defined as CPI excluding food and energy. Core
inflation for Japan is defined as CPI excluding fresh food and energy. Core inflation for the UK and the eurozone is defined as CPI less energy, food, alcohol and tobacco. Japan core CPI has been adjusted down by 2% from
April 2014 to March 2015 to remove the estimated impact of the consumption tax hike over this period. (Right) Bloomberg, J.P. Morgan Asset Management. 5y5y inflation swap represents the market’s expectation of five-year
average inflation, starting in five years’ time. Data for Japan starts in March 2007 due to data availability. Past performance is not a reliable indicator of current and future results. Guide to the Markets - Europe. Data as of 31
December 2019.
5
Global central bank policy GTM – Europe |9
Market expectations for policy rate Central bank balance sheets
% USD trillions
12-month change Global central bank
2.0 3.0 18
in balance sheet balance sheet
Forecast*
2.5 16
1.6
Global economy
US
14
2.0
1.2
12
1.5
0.8 10
UK
1.0
0.4 8
0.5
6
Japan
0.0
0.0
4
Eurozone
-0.4
Switzerland -0.5 2
-0.8 -1.0 0
Dec ’19 Dec ’20 Dec ’21 Dec ’22 Dec ’23 '07 '08 '09 '10 '11 '12 '13 '14 '15 '16 '17 '18 '19 '20
Source: (Left) Bloomberg, J.P. Morgan Asset Management. Expectations are calculated using OIS forwards. (Right) Bank of England (BoE), Bank of Japan (BoJ), European Central Bank (ECB), Refinitiv Datastream, Swiss
National Bank (SNB), US Federal Reserve (Fed), J.P. Morgan Asset Management. Global central bank balance sheet is the sum of the balance sheets of the BoE, BoJ, ECB, Fed and SNB. *Balance sheet forecast
assumptions: BoE to have zero net asset purchases over the forecast period; BoJ to have an annualised net asset purchase pace of 20 trillion yen over the forecast period; ECB to have net asset purchases of 20 billion
euros per month over the forecast period; SNB to have zero net asset purchases over the forecast period; Fed to increase assets by USD 60 billion per month through to June 2020, after which it is assumed that the balance
sheet will remain steady. Past performance is not a reliable indicator of current and future results.
Guide to the Markets - Europe. Data as of 31 December 2019.
6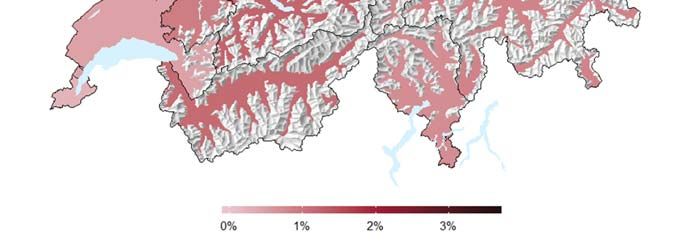
Global income                                                                                                                                                                                                                                 GTM – Europe   | 48
           Asset yield comparison
           % yield
                                                                                                                         Equity
                                 10                                                                                                                                                                                                                      9.4
                                                                                                                         Fixed income
                                   8           Average Europe inflation: 1,5%                                            Alternatives
                                               (12 months to November 2019)                                                                                                                                                                  5.5
                                   6                                                                                                                                                                    4.8                4.8
                                                                                                                                                                  4.1                4.2
                                   4                                                                                                           3.4
                                                                                                         2.3                2.6
                                   2
                                                                  0.0                 0.5
                                   0
                                               -0.2
                                  -2
                                             German              Cash              Euro IG          DM equity          EM equity             MSCI             Global     Global REITs     Global                       EM debt         DM high yield     Global
Equities

                                              Bunds                                                                                         Europe          convertibles              infrastructure                                                   transport

           Equity index yields
           % yield                                                                                                                                                                                        Buyback yield
                                  6                                                                                                                                                                        Dividend yield
                                  5
                                  4
                                  3
                                  2
                                  1
                                  0
                                               FTSE All-Share                              S&P 500                            MSCI World                      MSCI Europe ex-UK                            MSCI Japan                              MSCI EM
                                 Source: (Top) Bloomberg Barclays, BofA/Merrill Lynch, Clarkson, Drewry Maritime Consultants, MSCI, Refinitiv Datastream, J.P. Morgan Asset Management. Additional yield often comes with
                                 associated capital and/or liquidity risk. Global infrastructure and global transport yields are as of March 2019 and June 2019, respectively. Yields for the bond indices are yield to worst and dividend
                                 yields for the equity indices. Global transport levered yield is rental income minus operating expenses, debt amortisation and interest expenses, expressed as a percentage of equity value. Global
                                 convertibles: Bloomberg Barclays Global Convertibles; DM equity: MSCI World; EM equity: MSCI EM; German bunds: Germany 10-year yield; Euro IG: Bloomberg Barclays Euro Agg. –
                                 Corporates; Global REITs: FTSE NAREIT Index; DM high yield: BofA/Merrill Lynch Developed Markets High Yield Constrained; EM debt: J.P. Morgan EMBI Global; Global infrastructure: MSCI
                                 Global Infrastructure Asset Index – Low risk. (Bottom) Bloomberg, FTSE, MSCI, Refinitiv Datastream, Standard & Poor’s, J.P. Morgan Asset Management. Buyback yield is last twelve months
                                 buybacks divided by the market cap of the index. Past performance is not a reliable indicator of current and future results. Guide to the Markets - Europe. Data as of 31 December 2019.

      7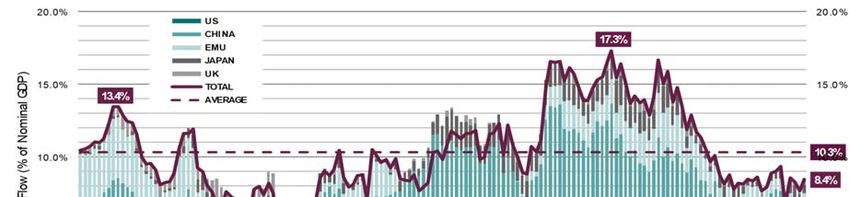
Horizons et Tendances, 9 janvier 2019   9

Horizons et Tendances, 15 janvier 2020

Quels placements et asset classes
favoriser pour 2020?
Eric Rosset

                                                                                                                                                                                 www.epas.ch

                                                                          2019 WITHIN THE TOP 3 VINTAGE YEARS

                                         Pictet LPP 40 Index – Annual Returns (Rebased)

                                         Source: Pictet Asset Management, Refinitiv, December 2019
                                                                                                          Perspectives d'investissement 2020
                                                                                                     10   Pictet Asset Management
                                                                                                          A l'attention des investisseurs professionnels
LOOKING INTO 2020

›        ‘Slowdown part 2’                                                                                                                                                       ›        Last missing piece to global easing
                                                                                                                                                                                          jigsaw
›        US lags global slowdown
›        Odds tilted towards more Fed easing
                                                                                     Global                                           China’s                                    ›        Clear need of easing
                                                                                 Desynchronised                                   Defensive Easing
                                                                                   Slowdown
                                                                                                                                                                                 ›        Multiple constraints (including
                                                                                                                                                                                          ‘stagflation’)

›        ‘Initial recovery part 1’                                                                                                                                               ›        Diversifying away from negative
                                                                                   Paradigm Shift                                  Constructing                                           yielding debt
›        Test cases: India, Korea, EMU, UK
                                                                                    in Policy Mix                                Robust Portfolios
›        US election: the next big step forward
                                                                                                                                                                                 ›        Using optionality to capture growth
                                                                                                                                                                                          surprises
         in this shift?
                                                                                                                                                                                 ›        Keeping credit risk at bay

Source: Pictet Asset Management, December 2019
                                                                                                                            Perspectives d'investissement 2020
                                                                                                                       11   Pictet Asset Management
                                                                                                                            A l'attention des investisseurs professionnels

                                                                  FROM TIGHTENING TO PIVOT AND MODEST EASING

Major 5 – Total (Policy & Private) Liquidity Flow by Major Bloc (6-Month Rolling, % GDP)

                                                                                                                                                         Double tightening

                                                                                                                                                                                                Pivot

                           2007 Peak                                                                                                                        2017 Peak
                            50% US                                                                                                                           20% US
                           20% China                                                                                                                        50% China

Note: Total Liquidity flow calculated as Policy plus Private Liquidity flows, as % of nominal GDP, using current-USD GDP weights (US: 36.9%, China: 26.1%, EMU: 23.5%, Japan: 8.7%, UK: 4.9%)
Source: Refinitiv Datastream, Pictet Asset Management
                                                                                                                               Perspectives d'investissement 2020
                                                                                                                         12 Pictet Asset Management
                                                                                                                               A l'attention des investisseurs professionnels
ONE MISSING PIECE TO GLOBAL EASING PUZZLE? CHINA

EM – Activity & Central Bank Breadth                                                    China – Activity & Policy Easing

Source: Pictet Asset Management, Refinitiv, December 2019                               Source: Pictet Asset Management, Refinitiv, December 2019

                                                                                       Perspectives d'investissement 2020
                                                                                  13   Pictet Asset Management
                                                                                       A l'attention des investisseurs professionnels

                                                        ANGLO-SAXON BONDS TO PROVIDE PORTFOLIO BALANCE

US – 10Yr Yield & 10% Return Implied Target                                             Swiss – 10Yr Yield & 10% Return Implied Target

Source: Pictet Asset Management, Refinitiv, December 2019                               Source: Pictet Asset Management, Refinitiv, December 2019

                                                                                       Perspectives d'investissement 2020
                                                                                  14   Pictet Asset Management
                                                                                       A l'attention des investisseurs professionnels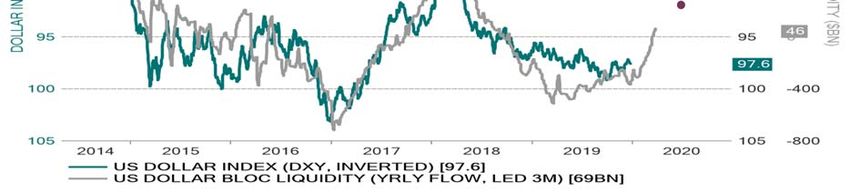
USD LIQUIDITY TIGHTNESS TO FADE AWAY

US Dollar Index (DXY) v. US Dollar Bloc Liquidity ($bn)

Source: Pictet Asset Management, Refinitiv, December 2019
                                                                                 Perspectives d'investissement 2020
                                                                            15   Pictet Asset Management
                                                                                 A l'attention des investisseurs professionnels

                                          GROWTH INCREASINGLY VULNERABLE, INCREMENTAL SHIFT TO VALUE

Global IT – Price v. Earnings                                                     Global Financials – Price v. Earnings

Source: Pictet Asset Management, Refinitiv, December 2019                         Source: Pictet Asset Management, Refinitiv, December 2019

                                                                                 Perspectives d'investissement 2020
                                                                            16   Pictet Asset Management
                                                                                 A l'attention des investisseurs professionnels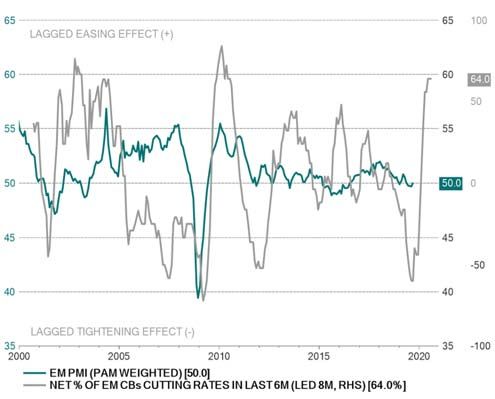
CORE VIEWS FOR 2020

                                ›     Risk budget allocation: market weight in equities, using optionality where possible, keep
                                      duration long

                                ›     US slowdown part 2: keep defensive equities (staples, utilities, REITs, healthcare), shave
                                      cyclical growth equities

                                ›     Initial recoveries part 1: dedicate a risk budget to corners of Europe (domestic oriented) and
                                      GEM (India, Korea) equities

                                ›     Portfolio balance: rotate into Anglo-Saxon core bonds (US, UK, Canada, Australia)

                                ›     Weaker US dollar: favour US TIPS & EM LC debt, keep gold

                                ›     Beware credit: more companies falling into BBB and out of BBB into High Yield

                                                                                                                 Perspectives d'investissement 2020
                                                                                                           17    Pictet Asset Management
                                                                                                                 A l'attention des investisseurs professionnels

For more information
                                                            This marketing material is for distribution to       financial situation, or to obtain specific advice   names of all MSCI indexes and products) are
PICTET ASSET MANAGEMENT                                     professional investors only. This marketing          from an industry professional.                      trademarks of MSCI or its subsidiaries.
                                                            document is issued by Pictet Asset Management
Rte des Acacias 60                                          S.A.. It is neither directed to, nor intended for    The value and income of any of the securities or    For active equities funds, please note that the
                                                                                                                 financial instruments mentioned in this             strategy is benchmark agnostic; the MSCI World
1211 Geneva 73                                              distribution or use by any person or entity who
                                                            is a citizen or resident of, or domiciled or         document may fall as well as rise and, as a         is not a benchmark but a reference index which
                                                                                                                 consequence, investors may receive back less        serves as a proxy for Global Equities (other
www.group.pictet                                            located in, any locality, state, country or
                                                            jurisdiction where such distribution, publication,   than originally invested. Risk factors are listed   proxies such as MSCI ACWI are equally
                                                            availability or use would be contrary to law or      in the fund’s prospectus and are not intended to    appropriate). The strategy’s investment
                                                            regulation. Only the latest version of the fund’s    be reproduced in full in this document.             universe is more concentrated than global
                                                                                                                                                                     indices as it is limited to the theme, but it
      @PictetAM                                             prospectus, the KIID (Key Investor Information       Past performance is not a guarantee or a            contains stocks not included in those indices as
                                                            Document), regulations, annual and semi-annual       reliable indicator of future performance.
                                                            reports may be relied upon as the basis for                                                              it is unconstrained in sizes and regions.
                                                                                                                 Performance data does not include the               Reference indices do not influence the portfolio
                                                            investment decisions. These documents are            commissions and fees charged at the time of         construction process.
      Pictet Asset Management Switzerland                   available on www.assetmanagement.pictet or at        subscribing for or redeeming shares. This
                                                            Pictet Asset Management S.A. , 60 Route des          marketing material is not intended to be a
                                                            Acacias – 1211 Geneva 73.                            substitute for the fund’s full documentation or
                                                            The information and data presented in this           for any information which investors should
      assetmanagement.pictet                                document are not to be considered as an offer        obtain from their financial intermediaries acting
                                                            or solicitation to buy, sell or subscribe to any     in relation to their investment in the fund or
                                                            securities or financial instruments.                 funds mentioned in this document.
      mega.online                                           Information, opinions and estimates contained in     Pictet Asset Management SA has not acquired
                                                            this document reflect a judgment at the original     any rights or license to reproduce the
                                                            date of publication and are subject to change        trademarks, logos or images set out in this
                                                            without notice. Pictet Asset Management S.A.         document except that it holds the rights to use
                                                            has not taken any steps to ensure that the           any entity of the Pictet group trademarks. The
                                                            securities referred to in this document are          trademarks, logos and images set out in this
                                                            suitable for any particular investor and this        document are used only for the purpose of this
                                                            document is not to be relied upon in substitution    presentation.
                                                            for the exercise of independent judgment. Tax        This document is for information purposes only.
                                                            treatment depends on the individual                  They should not be considered by the recipient
                                                            circumstances of each investor and may be            as an offer, an invitation or a personal
                                                            subject to change in the future. Before making       recommendation to acquire or sell any product
                                                            any investment decision, investors are               or fund or subscribe to any asset management
                                                            recommended to ascertain if this investment is       service.
                                                            suitable for them in light of their financial
                                                            knowledge and experience, investment goals and       MSCI marks used in this paper (including the

                                                                                                                 Perspectives d'investissement 2020
                                                                                                           18    Pictet Asset Management
                                                                                                                 A l'attention des investisseurs professionnels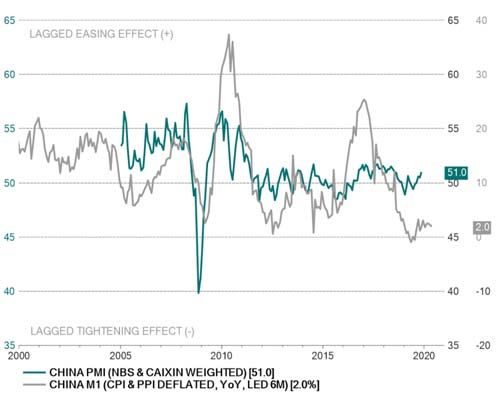
Horizons et Tendances, 9 janvier 2019   19

  Horizons et Tendances, 15 janvier 2020

  Perspectives pour le marché
  immobilier
  Damian Künzi

                                                                                                     www.epas.ch

            Un cycle immobilier long et mature en Suisse
                                                             22 ans
                                                    14 ans    x 2.4
                                                     x 2.6

                                           16 ans
                                            x 2.4

                                                                      Prix des maisons à
                                                                      plusieurs logements,
                                                                      indice TRX de Wüest
                                                                      Partner

            Source: Wüest Partner

20 | Horizons et tendances | 15.01.2020
Comment investir dans une période de
répression financière prolongée?
%
21 | Horizons et tendances | 15.01.2020
Prime de risque sur l’immobilier Suisse :
attrayante et sans alternative
%
%
22 | Horizons et tendances | 15.01.2020Défi 1 : ralentissement de l’économie suisse
et du solde migratoire
2
90000
70000 1
points de %
personnes
50000
0
30000
-1
10000
-10000 -2
1995 2000 2005 2010 2015 2020
Solde migratoire, échelle gauche
Différence de croissance Suisse/zone euro, échelle droite
23 | Horizons et tendances | 15.01.2020
Défi 2 : écart croissant entre offre et
demande, hausse des taux de vacance
Source : Office fédéral de la statistique, Swiss Life
Taux de vacance
24 | Horizons et tendances | 15.01.2020Défi 3 : augmentation de la pression politique
Problèmes d’accessibilité des prix
Genève : Initiative populaire «Construisons des logements pour toutes et tous»
approuvée le 24 novembre 2019
Berlin: introduction d’un gel temporaire des loyers
Bâle: plusieurs initiatives en attente de mise en œuvre :
En période de pénurie, les investisseurs doivent demander des autorisations
de projets de rénovation ou de démolition pour les «logements abordables»
Suisse : initiative populaire fédérale «davantage de logements abordables»,
mise en votation le 9 février 2020
Nouvelles règles en matière d’efficacité énergétique
25 | Horizons et tendances | 15.01.2020
Notre réponse : gestion active innovante et
préférence donnée aux emplacements centraux
Projet «Cornaredo
Park» à Lugano
Source : Archilyse, Swiss Life Asset Managers
26 | Horizons et tendances | 15.01.2020Prime de risque plus élevée à l’étranger
Rendements de bureaux «prime» au T3 2019
5%
4.50%
4.2% 4.00% 3.95%
4%
3.40% 3.30% 3.23% 3.25% 3.25%
2.43% 3.12% 3.09%
3% 2.70%
2.60%
2.30%
2.00% 3.52% 2.12%
3.67%
2% 4.02%
3.64% 3.57% 3.56% 3.49% 3.38% 3.27% 3.08%
3.00%
2.70%
2.40%
1% 2.07%
1.13%
0.48% 0.28%
0% 0.17%
-0.02% -0.24% -0.27% -0.26% -0.29%
-0.40% -0.40% -0.40% -0.44% -0.57%
-1%
Rendements des obligations Prime de risque immobiliers Rendements de
d'Etat à 10 ans vs. rendements des obligations d'Etat bureaux «prime»
Source : PMA, Wüest Partner, Cushman & Wakefield Macrobond ¦ Rendement des obligations d’Etat en moyenne trimestrielle; *T2 2019
27 | Horizons et tendances | 15.01.2020
Disclaimer
• Publié et approuvé par le Département économique
Swiss Life Asset Managers, Zurich
• Swiss Life Asset Managers est susceptible d’avoir suivi ou utilisé les recommandations présentées plus haut avant leur publication. Bien
que nos prévisions soient basées sur des sources considérées comme fiables, aucune garantie ne saurait être donnée quant à
l’exactitude et à l’exhaustivité des informations utilisées. Le présent document contient des prévisions portant sur des évolutions futures.
Nous ne nous engageons ni à les réviser, ni à les actualiser. Les évolutions effectives peuvent fortement différer de celles anticipées dans
nos prévisions.
28 | Horizons et tendances | 15.01.2020You can also read