A Glass Half-Full: The Promise of Regional Trade in South Asia

Page created by Fernando Malone
 
CONTINUE READING
A Glass Half-Full: The Promise of Regional Trade in South Asia
A Glass Half-Full:
The Promise of
Regional Trade in
South Asia
Sanjay Kathuria
L e a d Ec ono mi st a n d C o o rdi nato r, Re g i ona l I nte grat i on,
M a c ro eco nom i c s , Tra de a n d I nvest ment G l oba l P ra c t i c e
T h e Wo r l d B a n k

Colombo, October 8, 2018
A Glass Half-Full: The Promise of Regional Trade in South Asia
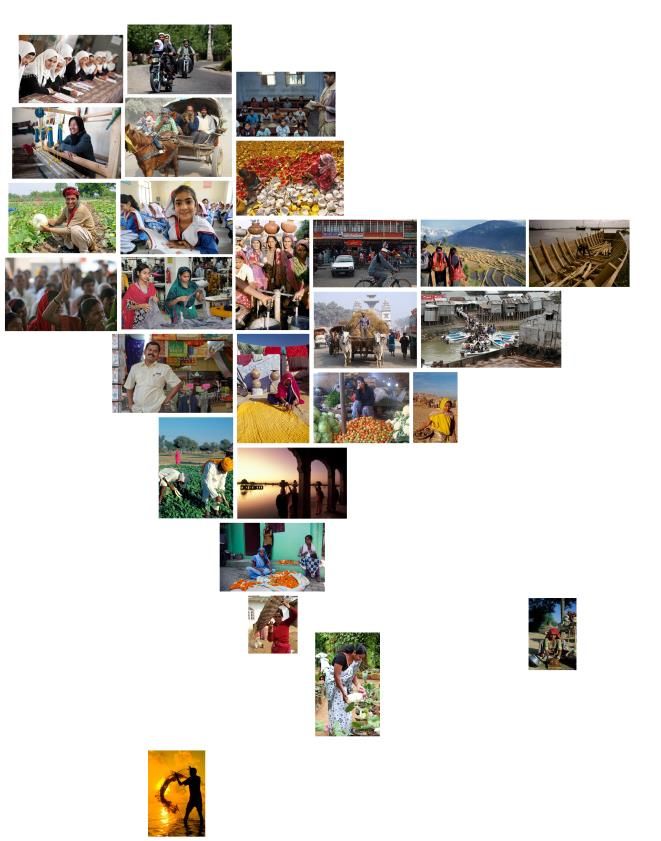
Imagine #OneSouthAsia
A Glass Half-Full: The Promise of Regional Trade in South Asia
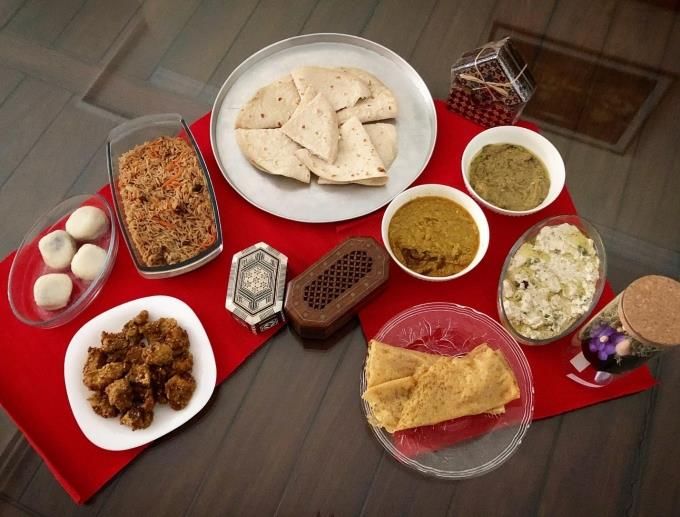
A South Asia where one can travel seamlessly...

 Breakfast in Kabul

 Lunch in Lahore

 Tea in Colombo

 Dinner in Delhi
A Glass Half-Full: The Promise of Regional Trade in South Asia
…enabled by frequent connections, like in ASEAN
                                                      Air Connectivity between Selected Country Pairs
                                                              in ASEAN and South Asia, 2017
 No. of flights per year, one way

                                    35,000                                                                                                                                       30914
                                    30,000                                                                                                26691
                                    25,000
                                    20,000
                                    15,000
                                    10,000                   7594
                                     5,000                                                          3967
                                        0
                                                          IND LKA                                IND BGD                                 SGP IDN                               IDN MAS

                                                                                                      Departure-destination
                                        Source: Based on data from DIIO (Data In, Intelligence Out) (database), Diio, LLC, Reston, VA (accessed August 2017), https://www.diio.net/products/index.html.
A Glass Half-Full: The Promise of Regional Trade in South Asia
Connectivity also means consumers enjoy goods
at the best available prices
                    Food prices in different cities (US$)

                       Eggs      Potato                   Eggs    Potato
                    regular,12    1 kg                 regular,12 1 kg
   Colombo             1.23       1.03    Bangkok         1.66     1.49
   Delhi               0.91       0.30    Hanoi           1.50     1.10
   Dhaka               1.13       0.30    Jakarta         1.56     1.42
   Islamabad           0.93       0.34    Kuala Lumpur    1.28     0.76
   Kathmandu           1.44       0.38    Yangon          1.49     0.94
   CV                  0.20       0.67                    0.09     0.27
   Source: Numbeo
A Glass Half-Full: The Promise of Regional Trade in South Asia
The Story of South Asia: The most dynamic …
                                South Asia: Most Rapidly Growing Region in the World

                           8
 Growth rate, % per year

                           6

                           4

                           2

                           0
                                        2014                   2015   2016   2017e   2018f     2019f        2020f
                           -2
                                East Asia and Pacific                                  Eastern Europe and Central Asia
                                Latin America and the Caribbean                        Middle East and North Africa
                                South Asia                                             Sub-Saharan Africa
                                Source: World Bank 2017, 2018.
                                Note: e = estimate; f = forecast.
A Glass Half-Full: The Promise of Regional Trade in South Asia
… yet the most disjointed
                                          Intraregional Trade as a Share of Regional GDP
            14
            12
            10
             8
  Percent

                                                                                                               South Asia
             6                                                                                               lowest at less
             4                                                                                                  than 1%
             2
             0
                       1990
                       1991
                       1992
                       1993

                       1995
                       1996
                       1997
                       1998

                       2000
                       2001
                       2002
                       2003
                       2004
                       2005
                       2006
                       2007
                       2008
                       2009
                       2010
                       2011
                       2012
                       2013
                       2014
                       2015
                       1994

                       1999
                         East Asia and Pacific                                Middle East and North Africa
                         South Asia                                           Sub-Saharan Africa
                         Latin America and the Caribbean

   Source: Calculations based on data from UN Comtrade through WITS and WDI
A Glass Half-Full: The Promise of Regional Trade in South Asia
Issue: The missing potential

             Barriers in trading with neighbors

Agenda for   Approach of the Report
today
             Analysis and recommendations

             Achieving the goal
Issue: The missing potential

             Barriers in trading with neighbors

Agenda for   Approach of the Report
today
             Analysis and recommendations

             Achieving the goal
Neighbors trade and prosper… but not in South Asia
                                   Intraregional Trade as a Share of Total Trade
           60
           50
           40                                                                                  South
 Percent

           30                                                                                   Asia
           20                                                                                lowest at
           10                                                                                   5%
            0
                   1990

                   1992
                   1993
                   1994
                   1995
                   1996
                   1997
                   1998
                   1999
                   2000
                   2001

                   2003
                   2004
                   2005
                   2006
                   2007
                   2008
                   2009
                   2010
                   2011
                   2012

                   2014
                   2015
                   1991

                   2002

                   2013
                   East Asia and Pacific                        Middle East & North Africa
                   South Asia                                   Sub-Saharan Africa
                   Latin America and the Caribbean
                Source: UN Comtrade; WITS
Intraregional trade is only one third of its potential…
                            Intraregional Trade Potential in South Asia
                                                                                                                               $67 bn
                        70,000
                                                                                                                                           Trade gap has been
   Trade, $, millions

                        60,000
                        50,000                                                                                                             rising:
                        40,000                                                                                                             • 2001: US$ 7 bn
                        30,000
                                                                                                                                           • 2015: US$ 44 bn
                        20,000
                        10,000                                                                                                $23 bn
                                                                                                                                           • Goods only
                             0                                                                                                             • Underestimate
                                        2002
                                               2003
                                                      2004
                                                             2005
                                                                    2006
                                                                           2007

                                                                                          2009
                                                                                                 2010
                                                                                                        2011
                                                                                                               2012
                                                                                                                      2013

                                                                                                                                    2015
                                 2001

                                                                                  2008

                                                                                                                             2014
                                                 Actual trade                            Predicted trade
 Source: Calculations based on data of CEPII Gravity Database, Centre d’Etudes Prospectives et d’Informations Internationales, Paris; WITS, World Bank
... and Sri Lanka can more than double its exports to
South Asia
                 Export Potential of Sri Lanka to South Asia (2015)                                             Gap = $ 1.6 bn = ~15%
                                                                                                                of Sri Lanka’s global
                 3                                                 2.8                                          export
   US$ Billion

                 2                                                                                              Sri Lanka significantly
                               1.2
                 1                                                                                              under exporting to:
                                                                                                                • India ($1.3bn)
                 0
                      Actual Exports to               Potential Exports to
                         South Asia                       South Asia

 Source: Calculations based on data of CEPII Gravity Database, Centre d’Etudes Prospectives et d’Informations
 Internationales, Paris; WITS, World Bank

                       Ultimately, people are denied the benefits of proximity and trade
SL highest recipient of FDI within the region, but still very
low overall
                                  Table: Intra-Regional Outward Investment in South Asia in 2015 (Million US$)
     Investment                                                                                                                      Total Inv to
                                                                                                                       Total Inv to
  from\Investment                       AFG           BGD            BTN            IND       MDV    NPL     PAK   LKA              SA/Total Inv to
                                                                                                                           SA
         to                                                                                                                             World
             AFG                           -           0.0              -            0.1       -       -     0.0     -      0.2           0.0
             BGD                           -              -             -           34.9      1.1    19.9    1.2    6.4    63.5          33.8
             BTN                           -              -             -                 -    -      0.0    0.0     -      0.0           0.5
              IND                          -         140.6          19.6                      20.9   131.5    -    431.4   744.0          0.9
             MDV                           -              -             -                 -    -       -      -    17.3    17.3          12.3
              NPL                          -           0.2              -            0.7       -       -      -      -      0.9           1.2
              PAK                        9.6          22.6              -                 -   5.3     3.4     -    15.6    56.5          18.4
              LKA                          -          10.2              -           30.5      53.7    0.9     -      -     95.2          14.4

  Total Inv from SA                      9.6         173.5          19.6            66.1      81.0   155.6   1.2   470.7   977.5          1.1
   Inv from SA/Inv
                                       27.5            1.4          11.7             0.0      13.1   17.2    0.1    4.7     0.3
     from World
Source: Calculations based on Coordinated Direct Investment Survey (CDIS) database, IMF
Issue: The missing potential

             Barriers in trading with neighbors

Agenda for   Approach of the Report
today
             Analysis and recommendations

             Achieving the goal
Both nature and man have contrived to fragment
the region
 ▪ Isolated and landlocked regions
 ▪ High tariffs and paratariffs
 ▪ Disproportionately high trade costs, due to poor logistics
   infrastructure and inefficient trade facilitation
 ▪ Complicated and non-transparent NTMs
 ▪ Constraints on services trade
 ▪ Below-potential FDI and lack of RVCs

         Underlying theme in all obstacles – Lack of mutual trust
South Asian countries discriminate against each other…
Overall trade restrictiveness index (OTRI) indicate protection greater for South Asia
imports than rest of the world
                         OTRIs, select countries, South Asia, 2011

                    Importing                                   Origin of imports
                     Country                       South Asia                        Rest of world
                   Afghanistan                          3.84                               4.65
                        India                           4.59                               0.50
                                                                                                        In Sri Lanka, the index is 3
                     Sri Lanka                          1.01                               0.33      times higher for SA imports as
                                                                                                       compared to ROW imports
                        Nepal                          10.59                               6.87
                     Pakistan                           3.00                               0.51

                   Source: Calculation Kee & Nicita in 2018 based on Kee and Nicita 2017
…and negate the benefit of proximity…
                              Average Trade costs, Intraregional and Interregional, 2010-2015

                    Regional trade agreements                                                                  Country pairs

                      SAFTA                             193
                                                                                             500
Trade agreements

                                                                                                                     386
                      ASEAN                       160                                        400

                                                                                   Percent
                                                                                             300                                    248
                                                                                                                           210
                   MERCOSUR                 119                                              200    153       135                         159

                      NAFTA                                                                  100
                                   47
                                                                                               0
                              0         100       200                300
                                           Percent

                                                                                                                    Country pairs
                                                  Source: Calculations based on UNESCAP trade cost database
Issue: The missing potential

             Barriers in trading with neighbors

Agenda for   Approach of the Report
today
             Analysis and recommendations

             Achieving the goal
The report gathered detailed on the ground
knowledge…

   Surveys    Focus group   Stakeholder    Analysis of new
              discussions   consultation        data
…and unpacked four critical barriers to deeper trade
integration in South Asia
    Nontransparent and protective tariffs, especially paratariffs
     ▪ Analyzed in detail in 3 countries (Bangladesh, Sri Lanka, Pakistan)

    Real and perceived nontariff barriers
     ▪ Examined through the lens of a handful of products and trading relationships

    Higher costs of connectivity
     ▪ Investigated using India-Sri Lanka air travel agreement as a case study

    Broader trust deficits in the region
      ▪ Draws lessons from the 4 operational Bangladesh-India border haats
Issue: The missing potential

             Barriers in trading with neighbors

Agenda for   Approach of the Report
today
             Analysis and recommendations

             Achieving the goal
Import tariffs are a tax on imports
                they are also tax on exports.
Overall, tariffs are falling in South Asia …
                   Simple Average Tariffs, South Asia, 1987–2016

             100
              80
   Percent

              60
              40
              20
               0
                               1987                           1997                     2007          2016
                                                                           Year
                            IND            PAK            BGD             LKA   NPL           BTN   AFG

      Source: Calculations based on data in Pursell 2011; WTO, ITC, and UNCTAD 2017.
… yet it remains more restrictive than other regions
                                           Average Tariff in 2016 (%)
                 16
                 14                                                                                13.4
                 12                                                                  11.4
                 10
                  8                                         7.3          7.4
                  6
                                                4.3
                  4          2.7
                  2
                  0
                           North           Europe &      East Asia & Latin America Sub-Saharan   South Asia
                          America         Central Asia   the Pacific     & the        Africa
                                                                       Caribbean

      Source: WB staff calculation based on WTO data
SAFTA is undermined by long sensitive lists
 In 2015, almost 35 percent of intraregional trade under in South Asia was
 restricted under sensitive lists
                                  SAFTA sensitive lists
                        Country                                                    Products, revised list (phase II)
                       Afghanistan                                                               850
                        Bangladesh                                                    987 (LDCs); 993 (NLDCs)
                           Bhutan                                                                       156
                             India                                                     25 (LDCs); 614 (NLDCs)
                          Maldives                                                                      154
                            Nepal                                                     998 (LDCs); 1,036 (NLDCs)
                          Pakistan                                                                      936
                         Sri Lanka                                                    837 (LDCs); 963 (NLDCs)
   Sources: “Agreement on South Asian Free Trade Area (SAFTA),” SAARC, Kathmandu, http://saarc-
   sec.org/assets/responsive_filemanager/source/Files%20for%20Areas%20of%20Cooperation/ETF/Agreement%20on%20South%20Asian%20Free%20Trade%20Ar
   ea%20(SAFTA).docx; sensitive lists: Ministry of Commerce (Bangladesh), https://www.bangladeshtradeportal.gov.bd/?r=site/display&id=121; Ministry of
   Commerce (Pakistan), http://www.commerce.gov.pk/about-us/trade-agreements/sensitive-list-of-safta-member-phase-ii/; Department of Commerce (Sri Lanka),
   http://www.doc.gov.lk/index.php?option=com_content&view=article&id=56&Itemid=183&lang=en.

                                  No clear guideline for phasing out sensitive lists
Sensitive lists cover a large proportion of Sri
Lanka’s import

               44% of
      Sri Lanka’s imports from
             South Asia

                                           23% of
                                   Sri Lanka’s exports to
                                         South Asia
SAFTA is significantly diluted by paratariffs, which are
     not a part of trade concessions
Bangladesh (%, FY17)                                         Pakistan (%, FY17)                                             Sri Lanka (%, 2016)

30                                                     30                                                           30
                               25.6
25                                                     25                                                           25                                  22.4
20                                                     20                                                           20
                                                                                            15.3
15         13.3                                        15             13.1                                          15
                                                                                                                                   10.8
10                                                     10                                                           10
5                                                        5                                                           5
0                                                        0                                                           0
      Average import    Average tariff                        Average import Average tariff                                Average import           Average tariff
           tariff       including para                             tariff    including para                                     tariff              including para
                             tariff                                               tariff                                                                 tariff

                  Source: Calculation from National Board of Revenue ( Bangladesh), Federal Bureau of Revenue ( Pakistan) and Sri Lanka Customs .
How can SAFTA be made more meaningful?
 South Asian countries need to agree on an accelerated, time-bound schedule
  for elimination of sensitive lists
    ▪   Particularly for Bangladesh and Sri Lanka

 Problem of paratariff needs to be squarely addressed
    ▪   Important for Bangladesh, Pakistan and Sri Lanka
    ▪   Sri Lanka has already taken some steps

 SAFTA members should continue their tariff elimination efforts for their non-
  sensitive lists
    ▪   For all countries
As tariffs have gone down, countries have
tended to substitute them with non-tariff
measures.
Unpackaging the black box of NTMs
Study examines NTMs in bilateral trade between Bangladesh and India
 and between India and Nepal in selected products of significance

 Focuses on SPS and TBT measures – account for majority of NTMs in
  South Asia

 Distinguishes between real and perceived issues by triangulating survey
  information with examination of regulations and consultations with
  regulators in the 3 focus countries
‘Real’ and ‘perceived’ non-tariff barriers add to the
‘noise’ and trust deficit
                                                       Inadequate capacity
              Information asymmetries
                                                      Exporting countries lack
               Lack of awareness among
                                                 accredited capacity for testing and
            exporters about partner country’s
Perceived   requirements on regulations and
                                                  certification to meet standards,
                                                    and have to rely on partner
                        standards
                                                       country infrastructure

               Border infrastructure
               Very few border points have
                                                           Procedures
  Real      Electronic Data Interchange (EDI),     Cumbersome procedures in
            Risk Management System (RMS),        product registration and renewal
                   and Single Window
Removing non tariff barriers requires persistent
coordination
 Information flows
    ▪ Explore a non-tariff barrier resolution mechanism for South Asia.
    ▪ Increase awareness of exporters through campaigns and workshops about
      importing country standards.
 Infrastructure
    ▪ EDI, RMS, and single window at border points
 Procedures & capacity building
     ▪ Bilateral mechanism to coordinate and expedite accreditation

These steps can be seen as confidence-building measures for eventual mutual
recognition agreements
Connectivity is the nuts and bolts of
international trade.
Regional air connectivity in South Asia is poor
even between capitals
                Bilateral Connectivity in South Asia, by Number of Flights per Week
                                      .
Country                   Sri Lanka                India           Pakistan Bangladesh Maldives           Nepal   Afghanistan   Bhutan

Sri Lanka                                         147                    10                   6      30     0          0          0

India                           147                                       6                 67       32    71         22          23

Pakistan                       10                     6                                      10      0      1          6          0

Bangladesh                       6                   67                  10                          1      5          0          2

Maldives                         30                  32                   0                   1             0          0          0

Nepal                            0                   71                   1                   5      0                 0          14

Afghanistan                      0                   22                   6                   0      0      0                     0

Bhutan                           0                   23                   0                   2      0     14          0

Source: Compiled using data obtained from the websites of various South Asian airlines, June 2015.
Efficiency of air travel services is an important
determinant of trade costs
Impact on trade in goods
  ▪ High value, low volume goods

 Impact on services trade
  ▪ Tourism, education

 Impact on FDI

 Study focuses on India-Sri Lanka air services liberalization
 focusing on 2003 and 2011 amendments
  ▪ Stakeholder consultation
  ▪ Econometric analysis
The liberalization episodes resulted in improved connectivity,
reduced prices, and increased air traffic
                                                      Growth in airline flights between India and selected
                                                                       countries, 2004–17
 2011 amendments:                             8000
 ▪ increase of 16 flights per week             7000
 ▪ 2442 seats per week                         6000
                                               5000

                                     Flights
                                               4000
                                               3000
Prices fell by 20-40% on                      2000
routes with competition                        1000
                                                  0
                                                      From India From India From India    From    From Nepal                                              From Sri
                                                          to      to Nepal to Sri Lanka Bangladesh to India                                               Lanka to
                                                      Bangladesh                         to India                                                           India
                                                                                     2004           2010          2017
                                                                     Source: Based on data from DIIO (Data In, Intelligence Out) (database), Diio, LLC,
                                                                     Reston, VA (accessed August 2017), https://www.diio.net/products/index.html.
Economic impact of liberalization went beyond
                     aviation: tourism key example
                 Arrival Statistics by Purpose of Travel, Indian Visitors                                              Arrival Statistics by Purpose of Travel, Sri Lankan Visitors
                                        to Sri Lanka                                                                                             to India
                                                                                                             350,000
           400,000
           350,000                                                                                           300,000
           300,000                                                                                           250,000
Tourists

           250,000                                                                                           200,000

                                                                                                  Tourists
           200,000                                                                                           150,000
           150,000
           100,000                                                                                           100,000
            50,000                                                                                            50,000
                 0                                                                                                 0
                     2000 2002 2004 2006 2008 2010 2012 2014 2016

                     Pleasure              Business                 Others                Total                 Tourism and others                  Business/Professional                       Total
                Source: Compiled from Market Research and Statistics (database), Ministry of                             Source: Compiled from Market Research and Statistics (database), Ministry of
                Tourism, New Delhi, http://tourism.gov.in/market-research-and-statistics.                                Tourism, New Delhi, http://tourism.gov.in/market-research-and-statistics.

                              Since 2005, India is the biggest source of tourist arrivals in Sri Lanka
                              Since 2003, there has also been a steady growth in Sri Lankan tourist arrivals in India
South Asia can learn from India-Sri Lanka air
liberalization experience
 Gold standard of open skies agreement not necessary to begin liberalization
   ▪   Incremental approach adopted by India-Sri Lanka offers an alternative
   ▪   Tourism from countries such as Bangladesh can increase because of growing middle class

 Gains can be more if accompanied by other supporting reforms
   ▪ Sri Lanka’s authorization of visa-on-arrival for expansion

 Structural weakness of the industry needs to be addressed to amplify benefits
   ▪   Inherent structural weakness of the airline industry in both countries reduced impact of
       liberalization

 Policy persistence pays off
Cross-country studies show that nations in
which there is a lot of trust among people
do well economically.
                  -   Kaushik Basu
Trust is a fragile commodity in South Asia

 The virtuous circle between trade and trust is
  broken in South Asia.

 However, Bangladesh-India border haats are
  helping bridge trust deficit by promoting
  people-to-people interaction

 Study examined functioning of 4 operational
  border haats through detailed fieldwork
Border haats have had significant positive welfare impact
on all stakeholders especially on women
                                           I am a housewife, but I
                                           make 30,000 BDT every
                                           Tuesday because of the
                                                border haat.
The welfare impact of border haats can be further
strengthened
 Border haat initiative should be scaled up
    ▪   Does not detract from formal trade.
 Larger gains possible by streamlining procedures, improving facilities, and
  enhancing use of technology.
    ▪   Vendor selection, electricity and sanitation, prevention of theft.

 Focus on value limits instead of limitations on products would be more
  meaningful.
    ▪   Expand product list
 Female participation in haats can be boosted.
    ▪   Improved sanitary facilities, quota for women vendor.
Issue: The missing potential

             Barriers in trading with neighbors

Agenda for   Approach of the Report
today
             Analysis and recommendations

             Achieving the goal
How do we get there?
Sri Lanka’s own role is crucial in realizing
   regional economic benefits
 Liberalizing trade within South Asia
  ▪ Reducing paratariffs – Sri Lanka already taking steps
  ▪ Reducing tariffs and sensitive lists
 Build awareness, capacity and infrastructure to reduce problems arising from
NTMs
  ▪ Focus on partner country standards and related capacity building
  ▪ Accredited laboratories for testing
  ▪ Electronic data interchange with partner countries
  ▪ But also streamline own SPS and TBT measures (part of anti-export bias story)
 Accelerate connectivity agenda with neighbors
  ▪ Air connectivity with Pakistan, Bangladesh
 Take initiatives of trust building activities through people to people
contact
  ▪ Encourage tourism from other South Asian countries
Unlocking the potential through targeted reforms and
their careful management…
  Incremental yet concrete steps needed to tap potential
       Effective SAFTA
       Chip away at real and perceived NTBs
       Improve connectivity

  This will also help to open up regional value chains, critical to trade
   dynamism
  Open regionalism
  Trust deficit should be addressed in conjunction with other reform
  Careful management of implementation, addressing winners and losers
Links and Hashtags
#OneSouthAsia
#AGlassHalfFull

World Bank website:
http://worldbank.org/onesouthasia

Social Media:
https://twitter.com/WorldBankSAsia
https://twitter.com/WorldBankIndia
https://twitter.com/Sanjay_1818
You can also read