Hot & cold dust in M31: the resolved SED of Andromeda
←
→
Page content transcription
If your browser does not render page correctly, please read the page content below
The Spectral Energy Distribution of Galaxies
             Proceedings IAU Symposium No. 284, 2011
                                                                                           c International Astronomical Union 2012
             R.J. Tuffs & C.C. Popescu, eds.                                                         doi:10.1017/S174392131200885X

                Hot & cold dust in M31: the resolved SED
                             of Andromeda
               Brent Groves1 , Oliver Krause1 and the MPIA Herschel Andromeda
                                              Team
                    1
                        Max Planck Institute for Astronomy, Königstuhl 17, D-69117 Heidelberg, Germany
                                                   email: brent@mpia.de, krause@mpia.de

             Abstract. Due to its proximity, the Andromeda galaxy (M31, NGC 224) offers a unique in-
             sight into how the spectra of stars, dust, and gas combine to form the integrated Spectral En-
             ergy Distribution (SED) of galaxies. We introduce here Herschel Space Observatory PACS and
             SPIRE photometric observations of M31 which cover the far-infrared to sub-mm wavelengths
             (70-500 µm). These new observations reveal that the total IR luminosity of M31 is relatively
             weak, with LIR = 109 . 6 5 L , only 10% of the total luminosity of M31. However, as seen in the
             previous studies of M31, the IR luminosity is dominated by a 10 kpc ring in all Herschel bands.
             This is distinct from the optical, where the bulge in the central 2kpc, dominates the luminosity,
             clearly demonstrating how different components at distinct positions in a galaxy contribute to
             make the integrated SED.
             Keywords. Galaxies:individual:M31,ISM:dust

             1. Introduction
                The Andromeda galaxy (M31) has helped forge our understanding of the association
             of dust with gas and stars on galactic scales. The seminal work of Baade & Gaposchkin
             (1963) noted that in Andromeda the dust (as seen through extinction) was predominantly
             associated with young stars and hence star formation. Yet it was with far-infrared space
             telescopes that the dust revealed itself. The IRAS observations of M31 (Habing et al.
             1984, Soifer et al. 1986, Walterbos & Schwering 1987, Xu & Helou 1996a,b) found the
             IR luminosity of M31 was relatively weak compared to many other galaxies found in the
             IRAS surveys. The IRAS survey found the IR maps dominated by the 10 kpc ring, as
             also found at 175 µm in the ISO survey of M31 (Haas et al. 1998).
                The Spitzer Space Telescope view of M31 took this IR image to the next level of
             resolution, with the 10 kpc ring clearly visible in the IRAC 8 µm band (Barmby et al.
             2006), and in the longer wavelength MIPS bands (Gordon et al. 2006). In addition to
             the larger 10 kpc ring, the MIPS imagery also revealed the central peak, and inner
             spirals and outer loops. Using this Spitzer data, in association with GALEX and SDSS
             imaging, Montalto et al. (2009) modelled the dust of M31, determining the dust mass
             distribution and importantly the heating of the dust across the disk. They found that
             over the majority of the disk the dust was heated predominantly by optical photons and
             stars older than 1 Gyr, as suggested in the earlier work by Xu & Helou (1996b).
                In this paper we continue this investigation into the far-infrared properties of M31 with
             Herschel Space Observatory (Pilbratt et al. 2010) observations of the Andromeda galaxy.
             This data has given us an unprecedented look into the long wavelength emission from
             M31 and demonstrates that, overall, M31 has a low total IR luminosity and relatively
             low total dust mass. However, even with cold dust (long wavelengths), the 10kpc ring
                                                                             112

Downloaded from https://www.cambridge.org/core. IP address: 176.9.8.24, on 26 Sep 2020 at 06:54:03, subject to the Cambridge Core terms of use, available at
https://www.cambridge.org/core/terms. https://doi.org/10.1017/S174392131200885X
Hot & cold dust in M31 113
Figure 1. The spectral energy distribution of Andromeda (filled points), and the best fit model
(black curve) from the SED fitting code MAGPHYS (da Cunha et al. 2008). Note that the
2MASS data (empty circles) were not used in determining the best fit due to the smaller aperture
used. The solid curve shows the best model fit, while the grey line shows the unattenuated stellar
spectrum. In the lower plot we show the offset of the data from the best fit model.
dominates the emission, but dust emission can be found out to radii even further than
this. For full details of this work, we refer the reader to Groves et al. (in prep.).
2. The Integrated SED of Andromeda
The Andromeda galaxy was observed in all 6 Herschel photometric bands (PACS 70,
100, and 160 µm and SPIRE 250, 350, and 500 µm as a Guaranteed Time (GT1) program.
A ∼ 3◦ × 1◦ region centred on M31 was observed in slow parallel mode (20 /s) for a total
time of ∼ 24 hours (86412 seconds). The full observations and reduction are described
in detail in Krause et al. (in prep.).
Using literature data (UV from Gil de Paz et al. (2007), optical from Walterbos &
Kennicutt (1987), near-IR from Jarrett et al. (2003), and the mid-IR from Barmby et al.
(2006) and Gordon et al. (2006)) and the new Herschel data, it is now possible to obtain
the full UV–IR integrated spectral energy distribution (SED) of the Andromeda galaxy,
enabling a comparison of our nearest massive neighbour with more distant galaxies. We
obtained the full SED of M31 within a rm a j ∼ 95 ellipse, with an inclination of 75◦ and
a P.A. of 37.7◦ , shown by the filled points in Figure 1.
Figure 1 also shows the best fit model SED from the SED fitting code MAGPHYS
(da Cunha et al. 2008). Due to the significantly smaller aperture used to determine the
2MASS fluxes and the observable offset between these fluxes and the R and 3.6 µm
bands, we have not included these in the determination of the best fit model. The offset
between the best fit model and the observations can be seen in the lower part of Figure
1, including the offset of the 2MASS points.
It is immediately clear from the integrated SED that M31 is an early type spiral, with
a relatively low UV and IR luminosity (c.f. the work of Mutch et al. 2011, who compare
Andromeda with SDSS galaxies, and found that it fell in the “green valley”). The total
luminosity of M31 from the best-fit model is log(L∗ /L ) ∼ 10.61. Only ∼10% of the
+0.15
radiation in M31 has been processed by dust, with Ldust = 4.44−0.10 × 10⁹ (L ), and the
subsequent radiation from the dust is predominantly cool, peaking at ∼ 160µm. The total
mass of dust returned by the model is log Md = 7.43 ± 0.06(M ), supporting the idea
+0.5
that M31 is a dust poor galaxy. The mean cold dust temperature in M31 is 16.8−0.7 K,
Downloaded from https://www.cambridge.org/core. IP address: 176.9.8.24, on 26 Sep 2020 at 06:54:03, subject to the Cambridge Core terms of use, available at
https://www.cambridge.org/core/terms. https://doi.org/10.1017/S174392131200885X114 B. Groves et al.
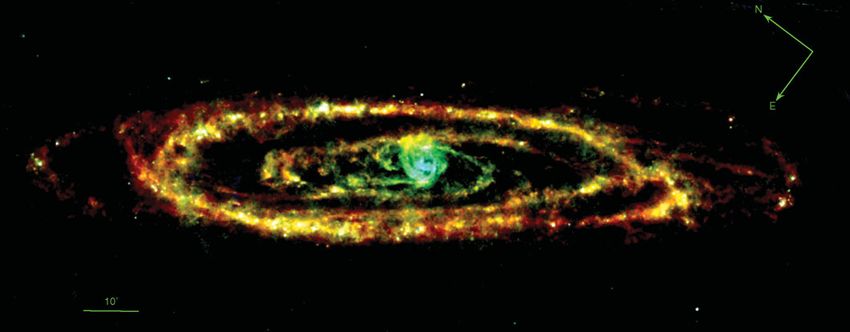
Figure 2. Far-infrared image of Andromeda using the Herschel bands showing PACS 70 µm,
PACS 100 µm, and SPIRE 250 µm, all convolved to SPIRE 250 µm resolution. All three bands
have the same square root scaling from 10 MJy/sr to 150 MJy/sr The angular scale is shown
by the 10’ bar in the lower right.
as expected with the peak of the IR bump at such long wavelengths. Altogether, M31 is
a relatively dust-poor spiral with relatively cool dust, mostly because it is dominated by
the emission from the diffuse ISM.
3. The resolved SED of Andromeda
The unprecedented spatial resolution of Herschel (6 − 8 , or 20–60pc at 70 − 250µm),
enables us to go further and determine the heating of the dust at the scales of Hii regions
and giant molecular clouds, and obtain the SED of Andromeda on small scales. In Figure
2 we show a three-colour far-infrared image of M31, using the PACS 70 and 100 µm and
SPIRE 250 µm bands. All three bands have the same square root scaling from 15 MJy/
to 150 MJy/sr.
Clearly visible in the image is the 10 kpc starforming ring of M31 and its spiral struc-
ture, with bright white points indicating positions of Hii regions. Outside the 10kpc ring,
little dust emission is seen at these levels of surface brightness, except for the extended
loops along the major axis. Inside the ring, the inner spiral arms are visible, linking the
ring to both the nuclear and bulge emission at the centre. These features have been visible
in both the earlier IRAS and Spitzer MIPS far-IR maps of M31, yet never before at such
spatial resolution at these wavelengths. This image clearly demonstrates which regions
contribute at which wavelengths, with the 10kpc ring dominating long wavelengths but
the central region dominated by the shortest wavelengths.
This is more clear when we fit a simple modified blackbody, Fν ∝ Bν (Td )( νν0 )β , to
the 100–500 µm data. By minimizing over the other parameters, we determined the
dust temperature Td as a function of radius, shown in Figure 3. The radial variation
quantitatively displays what was clear in Figure 2, with a high temperature in the central
2 kpc where the bulge of M31 is, while the disk of M31 has an approximately constant
temperature (Td ≈ 17 ± 1K). This even includes the 10kpc ring, where little variation
is seen with the mean Td , though clearly there are individual hot Hii regions within
the ring. To the right of the radial temperature we show the integrated IR SEDs of
the central 2 kpc (the bulge), and between 9 and 11 kpc (the ring) and the best fitting
simple modified blackbody. While these two SEDs demonstrate the difference in dust
temperatures between the two regions, they also reveal the relative contribution of these
Downloaded from https://www.cambridge.org/core. IP address: 176.9.8.24, on 26 Sep 2020 at 06:54:03, subject to the Cambridge Core terms of use, available at
https://www.cambridge.org/core/terms. https://doi.org/10.1017/S174392131200885XHot & cold dust in M31 115
R < 2 kpc
9 < R < 11 kpc
Figure 3. Left: Radial variation of mean temperature in M31. The temperature is determined
by fitting the median flux in all bands in radial bins of 1 (0.23kpc) width using elliptical annuli.
The error bars show the 16-84 percentiles of marginalized PDFs. Right: The Herschel IR SED
from the central 2kpc (top) and from the 10kpc ring (bottom) as labelled.
regions to each band, with the overall bulge IR emission an order of magnitude weaker
than the ring, but having a relatively greater (though still weak) contribution at the
shortest wavelengths.
As a final note, we point out that this work presents only a small fraction of the
available information with these new Herschel images. With existing optical, GALEX,
Spitzer, Hi, radio, and CO data, and the currently ongoing Pan-chromatic Hubble An-
dromeda Treasury survey which will cover roughly a third of the star forming disk, using
HST 6 filters from the UV–NIR, in addition to the Herschel images presented here, there
exists a seemingly-overwhelming wealth of data on the Andromeda galaxy that should
prove to be a heritage in understanding the connections between stars, gas, and dust and
how they combine to make a galaxy.
References
Baade, W. & Gaposchkin, C. H. P. 1963, Evolution of stars and galaxies., by Baade, W;
Gaposchkin, C. Cambridge, Harvard University Press
Barmby, P. et al. 2006, ApJL, 650, L45
da Cunha, E., Charlot, S., & Elbaz, D. 2008, MNRAS, 388, 1595
Gil de Paz, A., Boissier, S., Madore, B. F., et al. 2007, ApJS, 173, 185
Gordon, K. D., et al. 2006, ApJL, 638, L87
Haas, M., Lemke, D., Stickel, M., et al. 1998, A&A, 338, L33
Habing, H. J., Miley, G., Young, E., et al. 1984, ApJL, 278, L59
Jarrett, T. H., Chester, T., Cutri, R., Schneider, S. E., & Huchra, J. P. 2003, AJ, 125, 525
Montalto, M., Seitz, S., Riffeser, A., et al. 2009, A&A, 507, 283
Mutch, S. J., Croton, D. J., & Poole, G. B. 2011, ApJ, 736, 84
Pilbratt, G. L., Riedinger, J. R., Passvogel, T., et al. 2010, A&A, 518, L1
Soifer, B. T., Rice, W. L., Mould, J. R., et al. 1986, ApJ, 304, 651
Xu, C. & Helou, G. 1996a, ApJ, 456, 152
Xu, C. & Helou, G. 1996b, ApJ, 456, 163
Walterbos, R. A. M. & Kennicutt, R. C., Jr. 1987, A&AS, 69, 311
Walterbos, R. A. M. & Schwering, P. B. W. 1987, A&A, 180, 27
Downloaded from https://www.cambridge.org/core. IP address: 176.9.8.24, on 26 Sep 2020 at 06:54:03, subject to the Cambridge Core terms of use, available at
https://www.cambridge.org/core/terms. https://doi.org/10.1017/S174392131200885X116 B. Groves et al.
Discussion
Chakrabarti: Do you consider a range of temperatures? The reason I’m asking is that
Chris McKee and I found that if you estimate masses assuming a single temperature,
you would get a different answer than if you considered a self-consistent distribution of
temperatures.
Groves: I agree. The simple models would not be able to give accurate masses. However,
you can use simple modified blackbodies as a physically-motivated parameterization of
the far IR colours. They are useful so long as you don’t over-interpret the results.
Wang: Since M31 is highly inclined, do you see any evidence for projected dust features
from the front side of galactic disk.
Groves: While most of the disk is optically thin we can see on the 3-colour Herschel
image of M31 a portion where we have the disk dust emission projected onto the bulge.
Downloaded from https://www.cambridge.org/core. IP address: 176.9.8.24, on 26 Sep 2020 at 06:54:03, subject to the Cambridge Core terms of use, available at
https://www.cambridge.org/core/terms. https://doi.org/10.1017/S174392131200885XYou can also read