HOUSING IMPACT ASSESSMENT OREGON WILDFIRES AND STRAIGHT-LINE WINDS (DR-4562-OR)
←
→
Page content transcription
If your browser does not render page correctly, please read the page content below

FEMA Photo, Bear Lake Estates Mobile Home Park, Phoenix, Oregon, January 11, 2021

HOUSING IMPACT ASSESSMENT
     OREGON WILDFIRES AND
       STRAIGHT-LINE WINDS
               (DR-4562-OR)

                             Housing Recovery Support Function
Coordinated by: US Department of Housing and Urban Development
                                     Report Dated April 30, 2021
Table of Contents
Overview ............................................................................................................................................................... 4
Housing Recovery Support Function..................................................................................................................... 6
Housing Impact Assessment ................................................................................................................................. 8
    Purpose ............................................................................................................................................................. 8
    Data Analysis..................................................................................................................................................... 8
    Stakeholder Outreach....................................................................................................................................... 8
Pre-Disaster Housing........................................................................................................................................... 10
    Housing Stock ................................................................................................................................................. 10
    Housing Development .................................................................................................................................... 11
Impacted Area Demographics ............................................................................................................................ 13
    Summary ......................................................................................................................................................... 13
    Age and Family Size ........................................................................................................................................ 13
    Income Levels ................................................................................................................................................. 14
    Education ........................................................................................................................................................ 14
    Disability ......................................................................................................................................................... 14
    Race ................................................................................................................................................................ 15
    Limited English Proficiency ............................................................................................................................. 15
    Pre-Disaster Homelessness............................................................................................................................. 16
Post Disaster Impacts.......................................................................................................................................... 17
    Overview ......................................................................................................................................................... 17
        Population Poverty and Vulnerable Groups ............................................................................................... 17
    Housing Impacts ............................................................................................................................................. 18
        FEMA Verified Loss ..................................................................................................................................... 19
        FEMA Verified Loss - Manufactured Housing /Homeowner Insurance ................................................ 20
        US Small Business Administration (SBA) Disaster Loans ............................................................................ 20
        Wildfire Insurance Coverage ...................................................................................................................... 21
        Most Impacted Areas ................................................................................................................................. 22
        Jackson County Impacts ............................................................................................................................. 23
    Impacts to Affordable Housing ....................................................................................................................... 24
        Oregon Housing and Community Services (OHCS) ..................................................................................... 24
        HUD Office of Public and Indian Housing (PIH) .......................................................................................... 24
        HUD Office of Housing - Multifamily Housing ............................................................................................ 25

DR-4562-OR Housing Impact Assessment – April 30, 2021                                                                                                                     2
HUD Office of Housing - Single Family Housing.......................................................................................... 25
       USDA Multi-Family Housing Portfolio and Impacts .................................................................................... 27
   Other Population Impacts............................................................................................................................... 29
       Tribal Member Housing and Impacts ......................................................................................................... 29
       The Latinx Community ................................................................................................................................ 30
       Impacts to the Homeless Population ......................................................................................................... 31
Stakeholder Engagement .................................................................................................................................... 33
Key Recovery Considerations.............................................................................................................................. 34
   Apply an equity and inclusion lens in all recovery activities .......................................................................... 34
   Increase permanent affordable, accessible housing ...................................................................................... 35
   Apply holistic approach to recovery ............................................................................................................... 36
   Rebuild/ Build resilient utilities and infrastructure ........................................................................................ 37
   Assist communities in recovery planning and visioning ................................................................................. 37
   Expand homeownership and financial literacy opportunities ........................................................................ 37
Conclusion........................................................................................................................................................... 39
Appendix 1: Stakeholder Meetings Summaries ................................................................................................. 40
Appendix 2: Market-at-a-Glance........................................................................................................................ 46
Appendix 3: Individual Housing Recovery Resources ......................................................................................... 48
Appendix 4: State and Community and Development Resources ..................................................................... 57
Appendix 5: Success Stories and Best Practices................................................................................................. 61

DR-4562-OR Housing Impact Assessment – April 30, 2021                                                                                                                 3
Overview
In early September 2020, unusually high winds and dry weather caused the rapid expansion of multiple
wildfires throughout the State of Oregon. Significant damage to public utilities, infrastructure, and
housing were sustained because of several weeks of uncontrolled fires. Over one million acres burned
resulting in devastation of historic proportion in many communities. On 9/15/2020 a Major Disaster
Declaration was approved for the State of Oregon for wildfires and straight-line winds. Individual
assistance for Clackamas, Douglas, Jackson, Klamath, Lane, Lincoln, Linn, and Marion Counties was
granted.
It is significant to also note that the Oregon Wildfires and Straight-line Winds event occurred during the
ongoing COVID-19 pandemic response effort. COVID-19 mitigation considerations impacted every level
of the response operation and may impact housing recovery planning.
Oregon’s Office of Emergency Management (OEM) reported the wildfires destroyed thousands of homes
and nearly half of them were mobile homes, primarily located in Jackson County. Based on feedback
during stakeholder engagement, many of these mobile homes were reported to be mortgage free older
models that were uninsured or underinsured. With the destruction of these homes, a large segment of
affordable housing disappeared leaving many residents without the resources to rebuild and recover
without support. Housing stock throughout Oregon has been found to be insufficient to absorb displaced
households, leaving over 1,000 individuals still residing in the non-congregate sheltering system six
months after the fires.
This Housing Impact Assessment (the “Assessment”) provides an overview of the impacted areas, the pre-
and post- disaster housing environment, shares insights gleaned from stakeholders crucial to successful
recovery, provides several key recovery considerations useful for long-term planning and identifies some
of the housing resources that may aid in planning and strategic thinking. During the Assessment process,
the Housing Recovery Support Function (RSF) engaged, as appropriate, other RSFs (Economic, Health and
Human Services, Infrastructure Systems) to facilitate coordination of cross sector housing-related issues.
The severity of the wildfires called for the formation of various task forces and collaboration across
multiple sectors, special advisors, and State representation to support community long-term recovery.
This Assessment is intended to assist the state, counties, and local governments, and community
stakeholders, with assessing housing impacts and identifying long-term housing recovery needs in the
impacted areas.
In the development of the Assessment, the Housing RSF team conducted surveys, participated in various
task force meetings, stakeholder engagements, collaborated with the State of Oregon’s (State’s) Office of
Housing and Community Services (OCHS) and other federal, state, and local agencies involved in recovery
efforts and reviewed the State’s existing Recovery Plan. Through these activities, the Housing RSF has
identified six key recovery areas for state and local agencies to consider in their long-term recovery
planning:
Apply an equity and inclusion lens in all recovery activities
Increase permanent, affordable, and accessible housing options
Apply a holistic approach to recovery
DR-4562-OR Housing Impact Assessment – April 30, 2021 4
Rebuild/Build resilient utilities and infrastructure Assist communities in recovery planning and visioning Expand homeownership and financial literacy opportunities These considerations are described in further details in the Key Recovery Considerations section of this document. DR-4562-OR Housing Impact Assessment – April 30, 2021 5

Housing Recovery Support Function
Under the National Disaster Recovery Framework (NDRF), the US Department of Housing and Urban
Development (HUD) is the coordinating agency for the Housing Recovery Support Function (RSF). The
mission of the Housing RSF is to:
Support efforts to address pre‐and post‐disaster housing issues
Facilitate the delivery of federal resources to implement housing solutions that effectively support
the needs of the whole community and contribute to its sustainability and resilience
Support activities to assist local, state, and tribal governments in the rehabilitation and
reconstruction of damaged and destroyed housing
Support efforts to develop new accessible, permanent housing options
The NDRF establishes a common platform and forum for how the whole community builds, sustains, and
coordinates delivery of recovery capabilities. Resilient and sustainable recovery encompasses more than
the restoration of a community’s physical structures to pre-disaster conditions. Through effective
coordination of partners and resources, we can ensure the continuity of services and support to meet the
needs of affected community members who have experienced the hardships of financial, emotional,
and/or physical impacts of devastating disasters.1
The NDRF helps ensure that all communities can Figure 1: The Six NDRF Recovery Support Functions
coordinate recovery efforts to address their
unique needs, capabilities, demographics, and
governing structures. It encourages an inclusive
recovery process, engaging traditional and
nontraditional whole community partners, and
provides a strategic and national approach to lead,
manage, and coordinate recovery efforts while
increasing the resilience of our communities. 2
Each RSF has a designated coordinating agency along
with primary agencies and supporting organizations
with programs relevant to the functional area. The
RSF Coordinating Agency, with the assistance of the
Federal Emergency Management Agency,
provides leadership, coordination, and oversight
for that recovery area of focus.
The Housing RSF collaborates with all other RSFs mission assigned to a specific Presidentially Declared
Disaster, in addition to federal, state, tribal and nongovernmental agencies, to identify pre- and post-
disaster housing challenges, assist in the development of long-term housing recovery options for displaced
households and provide requested programmatic and topical technical assistance.
1 National Disaster Recovery Framework, Second Edition, June 2016 -
https://www.fema.gov/sites/default/files/2020-06/national_disaster_recovery_framework_2nd.pdf
2 Same as above
DR-4562-OR Housing Impact Assessment – April 30, 2021 6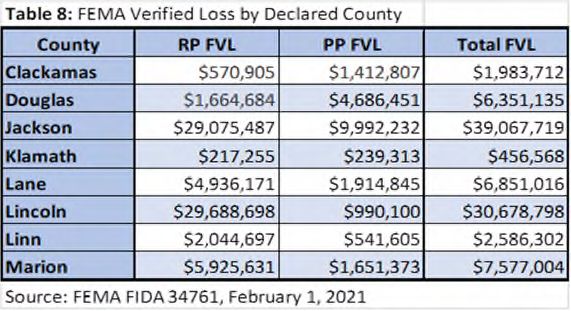
HUD has been mission assigned to DR-4563-OR and will lead the Housing RSF, along with support from
the US Department of Agriculture – Rural Development (USDA-RD), to support the State in its housing
recovery efforts.

Coordinating Agency:   US Department of Housing and Urban Development (HUD)

Primary Agencies:      Federal Emergency Management Agency (FEMA)
                       US Department of Agriculture, Rural Development (USDA-RD)
                       US Department of Justice (DOJ)

Supporting Agencies:   US Department of Commerce (DOC)
                       US Department of Health and Human Services (HHS)
                       US Environmental Protection Agency (EPA)
                       Corporation for National and Community Service (CNCS)
                       US Small Business Administration (SBA)
                       US Department of Energy (DOE)
                       American Red Cross (ARC)
                       US Department of Veteran Affairs (VA)
                       National Voluntary Organizations Active in Disaster (NVOAD)

State Agency:          Oregon Housing and Community Services (OHCS)

DR-4562-OR Housing Impact Assessment – April 30, 2021                                            7
Housing Impact Assessment
Purpose
The primary purpose of the Housing Impact Assessment (the “Assessment”) is to be a resource document
for state, tribal and local officials, as they consider, develop, and execute their recovery plans. The
Housing RSF, in collaboration with FEMA, USDA-RD and OHCS, collected, analyzed, and synthesized
damage assessment data and housing impacts resulting from the 2020 Oregon Wildfires and Straight-Line
Winds (DR-4562-OR). Additionally, OHCS requested the inclusion of data related to several areas of focus
including manufactured housing, the homeless population, the Latinx Community 3 , and other under-
represented populations. This document contains impact data and other housing information that should
assist the State and its partners when making critical decisions related to effective recovery planning and
coordination.
Data Analysis
The Housing RSF team, with support from HUD’s Office of Policy Development and Research (PD&R),
reviewed and analyzed data from the following sources:
FEMA Individual Assistance Open Disaster Statistics as of February 1, 2021
FEMA Individual Assistance inspection and structure type data as of February 1, 2021
FEMA Individual Assistance inspection and registrant data as of February 1, 2021
Baseline Census data for the impacted areas, including 2017 American Community Survey (ACS)
5-Year Estimates and 2018 Vintage Population estimates
US Department of Agriculture – Rural Development (USDA-RD) Single-Family and Multifamily
Housing portfolio
Housing Assistance Council (HAC) Rural Data Portal for Rural & Small-Town Areas (2016 & 2017)
SBA DR-4562 Disaster Loan data from FEMA
The Housing RSF also reviewed:
Summaries of other relevant housing needs assessments, useful documents and reports, and
conversations with local officials and experts
Examples of disaster recovery efforts that were pursued by other states and local governments
facing similar disaster recovery issues
USDA-RD reports and other pre-and post-Multifamily Housing impact information
The assessment does not provide recommendations for specific housing recovery strategies that state
and local officials or tribal entities should pursue. Instead, as noted above, this document should be a
resource as they consider options for recovery. Jurisdictions may find this document helpful for informing
their required housing needs assessment for current recovery and future planning needs.
Stakeholder Outreach
The Housing RSF, with support from FEMA, the USDA-RD and OHCS, undertook a comprehensive outreach
strategy to impacted communities, local leaders, housing providers, and other stakeholders. Outreach
included:
3 https://www.merriam-webster.com/dictionary/Latinx
DR-4562-OR Housing Impact Assessment – April 30, 2021 8
Meetings with state and local representatives, individual stakeholders, stakeholder groups, and
others engaged in, or supporting the recovery process.
OHCS-facilitated housing, social service, and homeless stakeholder surveys to assess state,
regional, tribal, and local disaster recovery gaps and priorities for government and nonprofit
housing and social service providers.
Working with other state and federal RSFs to identify cross-cutting concerns and issues that
directly impact providing long-term housing solutions for impacted residents.
Focus groups with stakeholders including housing providers, builders, owners, non-profit
agencies, and service providers; state and local representatives; and financial organizations
involved in housing development.
DR-4562-OR Housing Impact Assessment – April 30, 2021 9
Pre-Disaster Housing
Housing Stock
The pre-disaster housing stock was most concentrated in counties located within a metropolitan area,
with fewer housing units in surrounding rural counties. Low levels of pre-disaster stock in rural areas are
particularly relevant to survivors displaced from rural counties needing to be rehoused within a
reasonable commuting distance to maintain a connection to employment, health care, and school
networks. This stands in contrast to survivors displaced from counties located within the metro areas who
would be in closer proximity to a larger housing market and may have greater access to permanent
rehousing options.

In Table 1, the number and types of housing in the declared counties is shown. As previously noted, a
large portion of the pre-disaster housing stock was in metropolitan areas. Clackamas County, one of the
primary counties in the Portland-Vancouver-Hillsboro metropolitan area, had the largest pre-disaster
housing stock amongst the declared counties. Clackamas County contains 9% of Oregon’s housing stock,
and similarly, accounts for 10% of the 1-unit detached or attached (single-family) housing units within the
state. Approximately 23% of the housing stock in the declared counties is in Clackamas County. Larger
multifamily units are generally found in more urban areas and Clackamas County has 8% of Oregon’s 20-
to 49-unit buildings and 9% of the units in buildings with more than 50 units.

    Table 1: Oregon Pre-Disaster Housing Stock by County
                     Total Housing     1, detached or                                                                      Mobile home, boat, RV,
      County                                            2 to 4 units   5 to 19 units   20 to 49 units   50 or more units
                          Units        attached unit                                                                              van, etc.
Oregon                 1,750,539          1,189,113      124,610         144,785          56,819            89,220                145,992
Clackamas               165,422            121,135        7,340           14,424          4,306             7,947                  10,270
Douglas                  50,036             34,179        2,423           1,615            841               801                   10,177
Jackson                  94,525             65,254        7,768           4,176           1,542             3,223                  12,562
Klamath                  33,418             23,963        1,837            952             475               547                    5,644
Lane                    161,531            108,805        11,837          14,026          4,971             7,369                  14,523
Lincoln                  31,328             22,524        1,723           1,749            646               278                    4,408
Linn                     50,011             35,537        3,382           3,087           1,042              995                    5,968
Marion                  125,190             82,932        10,836          13,140          2,774             4,247                  11,261
Housing in
                      711,461              494,329        47,146          53,169          16,597            25,407                74,813
Declared Counties
% of State Total
                                            41.6%         37.8%           36.7%           29.2%              28.5%                 51.2%
by Type
% of Total in
                                            69.5%          6.6%           7.5%             2.3%              3.6%                  10.5%
Declared Counties
Source: American Community Surevey 2018 5-year data

The housing stock in the declared counties generally mirrored the state in terms of rent burden4. There
were two counties (Jackson and Lane) where the rent burden for renters was above the Oregon average
of 52%. Lane County had the highest rent burden at 57%. Conversely, Douglas County was observed to
have 48% of renters being rent-burdened, the lowest rate recorded amongst the individual assistance
declared counties.

Given the number of renters experiencing a rent burden statewide, and particularly those in counties
impacted by the wildfires, the affordable housing “footprint” within the State is an important component
of the Oregon housing market. A listing of the number and location of units within the eight impacted
counties supported by state or federal assistance are listed below.

4   At or above 30% of income.

DR-4562-OR Housing Impact Assessment – April 30, 2021 10 OHCS maintains asset management oversight over a portfolio of 363 residential rental properties
which comprise 15,000 units; 13 Mobile Home Parks (MHPs) with a total of 745 units (in Lane,
Clackamas, and Douglas counties, only); and 23 assisted living properties totaling 1,250 units.
HUD’s Office of Public and Indian Housing eight Public Housing Authorities (PHAs) assists 1,428
households with Public Housing and 12,104 households with rental assistance.
HUD’s Office of Housing - Multifamily Program oversees 165 multifamily housing properties
consisting of 8,582 units, of which 4,315 receive project-based assistance.
USDA-RD’s Multi-Family Housing portfolio consisted of a combined 72 affordable housing
complexes providing 2,570 total units. Additionally, there were 72 vacant units, 68 which where
habitable, across 37 properties.
USDA-RD’s Single Family Housing Direct Loan portfolio consists of 1,300 loans for $111 million in
the impacted eight-county region.
USDA’s Single Family Housing Guaranteed Loan portfolio includes 5,972 loans totaling $1 billion.
Housing Development
OHCS commissioned a report, Implementing a Regional Housing Needs Analysis Methodology in Oregon:
Approach, Results, and Initial Recommendations, published in August 2020, stemming from 2019 state
legislation to transform Oregon’s approach to housing planning. The report presents a methodology for
projecting regional housing needs and allocating that need to local jurisdictions.
The report shows that statewide, an estimated 583,600 new housing units are needed across Oregon by
2040, which amounts to roughly 30,000 new housing units constructed per year between 2020 and 20405.
Included in this total number of units are 104,372 units in the impacted counties. Current annual rates of
housing production estimated by the Oregon Home Builders Association are between 15,000 and 20,000
per year, amounting to a significant shortage in production. According to Oregon’s Office of Economic
Analysis, “…new construction activity in recent years [2019] has barely kept pace with the increase in
population growth. A market imbalance remains…[urban areas are] rebalancing and the supply of new
apartments are beginning to hold down rents. However, these trends are not yet seen elsewhere in the
state.”6 The rate of new construction compared to the rate of household formation also appears to bear
this out, particularly within the disaster-impacted counties7. In sum, significant demand for new-build
housing was outpacing supply prior to either the recent wildfire disasters, or COVID-19.
Further, the Oregon Home Builders Association noted that pre-COVID-19 and pre-wildfire, the industry
faced numerous challenges which limited the volume of homebuilding such as the availability of skilled
labor; cost of materials; and an unpredictable supply chain (products like furnaces, panels, studs, etc.).
The devastation on workforce, people, businesses, etc. caused by the wildfires further exacerbated the
stress in the homebuilding environment, while also significantly adding to the pre-disaster housing
5
‘Implementing a Regional Housing Needs Analysis Methodology in Oregon: Approach, Results, and Initial
Recommendations’ ECONorthwest prepared for Oregon Housing and Community Services, August 2020.
https://www.oregon.gov/ohcs/about-us/Documents/RHNA/2020-RHNA-Technical-Report-Final.pdf
6 Lehner, J. 2019 ‘Oregon’s Housing Supply’, Oregon Office of Economic Analysis
https://oregoneconomicanalysis.com/2019/01/29/oregons-housing-supply/
7 Baron, M. et al. 2018 ‘Housing Underproduction in Oregon: Economic, Fiscal and Environmental Impacts of
Enabling Transit-Oriented Smart Growth to Address Oregon’s Housing Affordability Challenge’ ECONorthwest
https://www.upforgrowth.org/sites/default/files/2018-10/UFGHousingUnderproductionInOregon.pdf
DR-4562-OR Housing Impact Assessment – April 30, 2021 11shortage. Given the complex logistical nature of homebuilding, none of these factors can be considered in isolation, and each has the potential to significantly delay the overall rate or cost of production. Other challenges identified by the Oregon Home Builder’s Association, such as timelines for zoning and permitting, are policy issues which are local and/or state decisions. The State of Oregon has, historically, taken active policy measures to address these issues, such as the elimination of exclusive single-family zoning across much of the state to address this unmet demand for housing units8. The destruction of significant proportions of the housing stock throughout the disaster-impacted area will serve to only exacerbate these challenges to the overall statewide housing shortage, and to pose a barrier to the homebuilding industry’s capacity to respond quickly to the need to rebuild disaster-impacted communities. 8FreddieMac 2020 ‘The Housing Supply Shortage: State of the States’ FreddieMac Economic & Housing Research Insight. p.1 DR-4562-OR Housing Impact Assessment – April 30, 2021 12
Impacted Area Demographics
Summary
The eight declared counties have a combined population of 1,727,9459, comprising 41.0% of the total
Oregon population. The two most populous counties are Clackamas with 418,187 and Lane with 382,067,
which are located within the Portland-Vancouver-Hillsboro and Eugene-Springfield metropolitan areas,
respectively. Clackamas and Lane counties combined represent 46.3% of the population of the declared
counties. Including Clackamas and Lane, there are six declared counties with population exceeding
100,000 (the remaining four are Douglas, Jackson, Linn and Marion). Those six counties have a combined
population of 1,609,745 (or 93.2% of the population of the declared counties). In contrast, the two
smallest declared counties (Klamath and Lincoln) each have a population under 70,000. With a combined
population of 118,200, the two smallest counties account for only 6.8% of the population of the eight
declared counties.
Although the smaller counties may have a comparatively small portion of the State’s disaster survivors,
consideration of the housing impacts and recovery in those counties is critical for the economic resilience
of those areas. To consider the housing needs of those counties will require looking beyond the total
number of registrants or damage.

Age and Family Size
The portion of people in the eight declared Oregon counties under 18 years of age ranges from 17%-25%
and is generally comparable to the entire state of Oregon (where 21% of the population is under 18).
Marion County has the highest rate of population under 18 years of age at 25% and has the largest average
family size of 3.3. For the 60+ age cohort, the range is more widespread at 21%-37%, compared to
Oregon’s 24% statewide. Communities with high percentages of young and/or residents aged 62 and over
may face increased recovery challenges because these segments of the population may require more
resources to support their recovery.

Average household sizes are smaller than average family sizes, in large part because a family contains a
minimum of two people, whereas only one person is needed to form a household. In Oregon, the average
household size is 2.5 (compared to the State’s average family size of 3.1).

            Table 2: Population, Age and Family Size
                                                               Age, percent
                County            Population                                         Family Size
                                                       Under 18               60+
                Oregon            4,217,737             21.3%                23.5%       3.1
          Clackamas                418,187              21.9%                24.2%       3.1
          Douglas                  110,980              19.4%                33.3%       2.8
          Jackson                  220,944              20.8%                28.8%       2.9
          Klamath                   68,238              21.7%                28.0%       2.9
          Lane                     382,067              18.8%                25.3%       2.9
          Lincoln                   49,962              17.1%                36.9%       2.8
          Linn                     129,749              22.9%                24.6%       3.1
          Marion                   347,818              25.1%                21.3%       3.3
          Source: Census Bureau 2019 Population Estimates; 2018 ACS 5-year data

9   Census Bureau 2019 Population Estimates; all other data uses 2018 ACS 5-year data.

DR-4562-OR Housing Impact Assessment – April 30, 2021                                                   13
Income Levels Disaster recovery at the household level typically requires significant resources to address the damage. Those costs may be borne by insurance, savings, loans or external assistance. The ability to address the financial demands of disaster recovery at the individual or family level is often a function of family income. The median household income 10 for Oregon (all counties) is $59,393 (mean of $80,040). The median household income in the 8 declared counties ranges from $45,354 to $76,597 (the mean household incomes range from $56,559 to $101,612). Three of the declared counties have a median household income below $50,000 (Douglas, Klamath, and Lincoln). Klamath County has the lowest median household income at $45,354. Only 2 counties have a median household income above $55,000 (Clackamas and Marion). Clackamas has the highest median household income amongst the declared counties at $76,597. Of the declared counties, none of them has a household income11 below 75-percent of the statewide median and only 1 has a household income above 125-percent of the statewide median; the aforementioned Clackamas County (129% of the State median). Several of these counties have a greater portion of the population who derive a portion of their household income from Social Security and Retirement sources. In Oregon, 33% of the households receive income from Social Security, averaging $19,792 statewide. In the 8 declared counties, that ranges from 33%-49% (Clackamas and Marion counties are at 33% and Douglas and Lincoln counties are at 49%). In all the declared counties, approximately one-third of households receive Social Security benefits. In Oregon, 20% of households receive some form of retirement income outside of Social Security, averaging $27,705. Among the declared counties, all eight have more than 20% of households receiving retirement income. Residents in the impacted counties who live on a fixed income derived primarily from either Social Security or retirement benefits may face additional recovery resource challenges. Education Education can be described by the two ends of the spectrum, those without high school degrees and those with a bachelor’s degree or higher. In Oregon, 10% of the residents lack a high school degree and 33% possess a bachelor’s degree or higher. In the declared counties, five have a higher percentage of population without high school degrees than the state (see Table 3). For residents with a bachelor’s degree or higher, the Oregon average is 33% and for the declared counties this ranges from 17% in Douglas County to 37% in Clackamas County. Those without bachelor’s degrees may experience limited options with respect to employment in their recovery from the disaster, particularly if businesses close or modernize as part of the recovery. Additionally, this may impact State or local economic development initiatives that require increased educational attainment for the workforce. Disability Individuals with disabilities face additional challenges with respect to disaster recovery. The ACS data presents disability information for three age groups, under 18, 18-64, and 65 and over. The Oregon estimates for individuals with a disability in those age groups is 4.7%, 12.0%, and 36.2%, respectively. For the youngest group (under 18), Lane and Lincoln counties have at least 6% (Oregon is 4.7%). Among the working age group, the disability percentages exceed the statewide rate in every county except Clackamas. For residents 65 and older, the Oregon rate is 36.2%. Counties exceeding the statewide 10 Median income may be a more effective statistic because it is less prone to being influenced by high incomes at the very top of the range. 11 As shown in Table DP03 of the 2018 5-year ACS. DR-4562-OR Housing Impact Assessment – April 30, 2021 14
average for the 65 and over population with disabilities include Douglas, Klamath, Lane, Lincoln, Linn, and
Marion. Amongst the declared counties, Linn County has the highest percentage of the population aged
65 and over with a disability at 40.8 percent.

Race
Race may play a role in engaging and assisting disaster survivors as lines of communication and community
priorities may differ among different races. According to the ACS12, while 76% of the Oregon population
identifies as white, in the 8 declared counties that ranges from 66%-88%. Marion County, which is located
in the Salem metropolitan area, has the lowest at 66%, not unexpected as urban areas often have
significant minority communities.

Black or African American populations (1.8% of Oregon’s population) in the declared counties are
predominantly in Marion County, with more than 1% of the county’s population. Black or African
Americans comprise 1% or less of the county population in the remaining declared counties.

The percentage of American Indian and Alaska Native in the declared counties are the highest in Klamath
and Lincoln counties (4% and 3%, respectively). Clackamas, Douglas, Jackson, Klamath, Lincoln, and
Marion counties all have approximately 1% of their respective populations comprised of American Indian
and Alaska Natives. Statewide, American Indian and Alaska Natives represent nearly 1% (0.9%) of the
Oregon population.

Limited English Proficiency
The Hispanic or Latino populations in the declared counties are all lower than the Oregon rate (13%).
Highest are Jackson, Klamath, and Marion counties with more than 10% of the population identifying as
Latino in each county. Douglas County has the lowest Hispanic or Latino population at 6 percent. Hispanic
or Latino residents may face communication challenges, as those counties also have the greatest
proportion of residents with Limited English Proficiency13 (LEP).

Engaging in the recovery process is challenging for all survivors, particularly those with LEP. In Oregon, 6%
of the population is considered to have LEP. Marion County, identified above with a large Hispanic or
Latino population, has nearly double the state rate for LEP. The four counties with the next highest rates
of LEP are Clackamas and Jackson (4% of the population), and Klamath and Lane with 3% each,
respectively. The ACS data further shows that these are largely (84%) Spanish speakers in Jackson,
Klamath, and Marion counties. To a lesser extent, in Clackamas and Lane County, Spanish speakers
represent approximately 50% of the population with LEP followed by speakers of other European
languages (20%) and Asian or Pacific Islander languages (30%).

DR-4562-OR Housing Impact Assessment – April 30, 2021                                                     15
Table 3: County Household Income, Education, Disability, Race and Limited English Proficiency
                   Household Income                Education           Disability,                                  Race
                                                                        all ages                    Black or   American Indian
                                                         Bachelors                                                                       Hispanic or    Limited English
     Location     Median         Mean      No HS Grad                                 White         African      and Alaska      Other
                                                         or Higher                                                                         Latino      Proficiency (LEP)
                                                                                                   American        Native
    Oregon       $59,393       $80,040       9.6%         32.9%           14.5%         76.0%        1.8%           0.9%         8.4%      12.8%            5.8%
Clackamas         $76,597      $101,612      6.7%         36.8%           11.7%         82.3%        0.9%           0.6%         7.7%      8.5%              4.1%
Douglas           $45,812       $60,606      10.9%        17.2%           20.7%         88.1%        0.4%           1.0%         4.8%      5.7%              1.2%
Jackson           $50,851       $68,838      10.4%        27.4%           16.0%         81.2%        0.6%           0.9%         4.8%      12.5%             3.5%
Klamath           $45,354       $56,559      12.6%        19.4%           19.9%         78.4%        0.7%           3.6%         4.6%      12.7%             3.3%
Lane              $53,172       $70,610      8.6%         29.6%           16.9%         82.1%        1.0%           0.9%         7.4%      8.7%              2.6%
Lincoln           $46,061       $60,104      9.4%         24.1%           21.8%         82.6%        0.4%           2.6%         5.3%      9.1%              2.0%
Linn              $52,097       $66,040      10.1%        19.5%           17.5%         85.4%        0.4%           0.8%         4.6%      8.9%              2.4%
Marion            $56,097       $72,055      14.7%        22.8%           14.8%         65.8%        1.2%          50.0%         6.2%      26.3%            10.4%
Source: Census Burear 2019 Population Estimates: 2018 ACS 5-year data
Note: "Other Race" includes Asian, Native Hawaiian and other Pacific Islander, other, and two or more races.

Pre-Disaster Homelessness
According to the Oregon Statewide Shelter Study (August 2019) 14 , Oregon has one of the highest
homelessness rates in the country, with 50 or more persons experiencing homelessness per 10,000
population, and an estimated need of over 5,800 shelter beds for both families with children and
individuals experiencing homelessness. The study found a particular need among certain groups, including
people of color, undocumented non-citizens, youth, and LGBTQ+.

Key findings from Oregon’s 2019 Point-in-                                      Figure 2: Oregon Wildfire Impacted County 2019 Point in Time Count
Time Count 15 indicate that three in four                                                (Homelessness)
Oregonians experiencing homelessness
live outside of the Portland metropolitan
area, with the greatest concentration of
families experiencing homelessness found
in coastal counties and southern Oregon.
Two of the fire-impacted counties, Jackson
and Lane, each saw an increase from 2017
to 2019 in their overall number, as well as
in the number of persons experiencing
unsheltered homelessness. The wildfire-
impacted 2019 overall homeless count is
presented in Figure 2.

Student homelessness16 was also present at above-average rates in two of the most fire-affected school
districts: For the 2019-2020 school year, the overall rate of student homelessness in Oregon was 3.62%17;
in the McKenzie School District (#68, Lane County) it was 15.93%, and in the Phoenix-Talent School District
(#4, Jackson County) it was 7.68%18.

14
   www.oregon.gov/ohcs/about-us/Documents/poverty/Oregon-Statewide-Shelter-Study.pdf
15
   public.tableau.com/profile/oregon.housing.and.community.services#!/vizhome/2019Point-in-
TimeDashboard/Story1
16 www.oregon.gov/ode/schools-and-districts/grants/esea/mckinney-vento/pages/default.aspx
17 www.oregon.gov/ode/schools-and-districts/grants/ESEA/McKinney-

Vento/Documents/Unduplicated%20State%20Totals%2019-20.xlsx
18 www.oregon.gov/ode/schools-and-districts/grants/ESEA/McKinney-Vento/Documents/K-

12%20District%20Totals%20percent%20of%20Enrollment%2019-20.xlsx

DR-4562-OR Housing Impact Assessment – April 30, 2021                                                                                                                16
Post Disaster Impacts
Overview
The eight FEMA Individual Assistance-declared counites are Clackamas, Douglas, Klamath, Jackson, Lane,
Lincoln, Linn, and Marion Counties. Figure 3 depicts the declared counties and designated FEMA
programs. Of the eight, three are located within a Metropolitan Statistical Area (MSA) as defined by the
Office of Management Budget. Two of the MSAs had at least one declared county. The impacted MSAs
and associated counties are listed in Table 4.
Figure 3: DR-4562-OR Declared Counties
DR-4562-OR
Registration deadline
November 30, 2020
As of December 30, 2020
Total registrations: 25,218
Total IHP: $32,065,455.07
Table 4: DR-4562-OR Impacted MSAs
MSA County
Portland-Vancouver- Marion, Linn
Salem, OR-WA
Medford-Grants Pass, Jackson
OR
Population Poverty and Vulnerable Groups
Table 5 presents demographic and disaster registrant information for the declared counties impacted by
both the Oregon Straight-line Winds and Fire. The populations range from the largest county of Clackamas
with a population of 418,187 to the smallest county being Lincoln with a population of 49,962. As of
February 1, 2021, 24,014 households in the 8 declared counties have applied for FEMA IA assistance. Of
these registrants, 6,950 (28.9%) were homeowners and 17,064 (71.1%) were renters. There were 24
registrants where their housing occupancy (owner vs. renter) was not provided.
DR-4562-OR Housing Impact Assessment – April 30, 2021 17Table 5: Oregon County Demographics and FEMA Registrant Data
Pre-Disaster Post Disaster Owner Registrants Post Disaster Renter Registrants
% People
Owner HH Owner HH Renter HH Renter HH
Total below Owner Renter
County with with AFN with with AFN Tenure Blank
Population Poverty Registrants Registrants
Member 60+ Member Member 60+ Member
Level
Clackamas 418,187 8.5% 982 384 118 1,338 222 113 2
Douglas 110,980 16.2% 521 160 47 10,951 265 63 3
Jackson 220,944 16.3% 2,382 1,361 472 2,180 441 231 12
Klamath 68,238 20.3% 117 54 5 146 17 6 0
Lane 382,067 18.5% 884 495 143 879 157 90 3
Lincoln 49,962 16.7% 475 267 101 328 86 47 1
Linn 129,749 14.4% 403 196 58 350 65 37 0
Marion 347,818 15.2% 1,186 651 173 892 152 97 3
TOTALS 1,727,945 6,950 3,568 1,117 17,064 1,405 684 24
Source: Census Bureau 2019 Population Estimates; 2018 ACS 5-year data; FEMA FIDA 21196, February 1, 2021
Housing Impacts
Oregon’s Office of Emergency Management (OEM) collected damage assessments from each of the eight
Individual Assistance declared counties and reported that over 4,00019 homes were destroyed including
1,795 manufactured homes as indicated in Table 6. It is important to recognize that there is a difference
in the number of damaged/destroyed homes reported by FEMA and the numbers reported by OEM. Not
every household whose home was damaged or destroyed applied for FEMA assistance and FEMA data is
reflective of only households who applied for assistance, whereas OEM data reflects damage information
for all homes damaged by the wildfires. Reasons that households might not apply for FEMA assistance
include the damage was covered by insurance, the damaged property was not their primary residence,
discomfort with sharing personal information with the federal government, or concerns about program
eligibility. Therefore, it will be important for the state to work with local and impacted jurisdiction to
continue to evaluate, validate, and consolidate reported data to determine the most accurate number of
damaged and destroyed homes.
Table 6: Homes Damaged by County and Damage Level*
Major Destroyed/
Manufactured Damaged Damaged
County Single Family Multifamily Homes Homes Homes
Clackamas 62 0 0 0 62
Douglas 126 0 12 0 138
Jackson 610 193 1,561 9 2,373
Klamath 11 0 0 0 11
Lane 463 0 0 1 464
Lincoln 63 3 222 0 288
Linn 71 0 0 0 71
Marion 629 0 0 4 633
Total 2,035 196 1,795 14 4,040
Source: Oregon Office of Emergency Management
*This table includes data provided by state/local data sources to OEM. Actual damage counts may be
subsequently updated as more information is received.
19
https://experience.arcgis.com/experience/6c42bf70be214725b8dd0de8d407eca9/page/page_0/?views=vie
w_2
DR-4562-OR Housing Impact Assessment – April 30, 2021 18FEMA Verified Loss
As shown on in Table 7, FEMA inspections determined that 1,533 (9.6%) of owner registrants suffered real
property loss. Among owners and renters, 3,731 registrants suffered personal property losses.
In the declared counties, owner registrants experienced real property (RP) and personal property (PP) FVL in
excess of $5,000 at a rate of 11% and 13.4% respectively. Renters experienced PP FVL in excel of $5,000 at a
rate of 7.2%.
Table 7: FEMA Verified Loss by Occupancy
Registrant Occupancy
Owner Renter
Damage Category Owner % of Renter % of
Number Total Number Total
No Real Property FVL 5,417 77.9%
Any Real Property FVL 1,533 22.1%
RP FVL $0.01-$499 429 28.0%
RP FVL $500-$4,999 342 22.3%
RP FVL $5,000-$24,999 103 6.7%
RP FVL $25,000 and over 659 43.0%
No Personal Property FVL 5,380 77.4% 15,030 88.1%
Any Personal Property FVL 1,570 22.6% 2,035 11.9%
PP FVL $0.01-$499 18 1.1% 49 2.4%
PP FVL $500-$4,999 621 39.6% 765 37.6%
PP FVL $5,000 and over 931 59.3% 1,221 60.0%
Total Registrants 6,950 17,065
In the declared counties, Jackson County received the most real and personal property FVL combined
totaling $39,067,719. Klamath County received the least at $456,568.
It should be noted that the FEMA Individual Assistance Program does not provide assistance for rental
properties or secondary homes. So, this would also account for a discrepancy between OEM damage
assessment and FEMA data.
DR-4562-OR Housing Impact Assessment – April 30, 2021 19FEMA Verified Loss - Manufactured Housing /Homeowner Insurance
Manufactured Housing (MFG), as referenced in this section, is defined as an applicant’s residence type is
a travel trailer or a mobile home as their primary residence. As shown on in Table 9, FEMA inspections
determined that 1,009 (43.1%) of owner registrants suffered real property loss to their primary residence.
Eight hundred 800, or 34.2% were determined to be destroyed. Of the owner destroyed residences, 561
(70.1%) were not insured.
FEMA inspections determined that 47 (4.6%) of renter occupied units were deemed destroyed. Major
damage was determined for 354 (34.9%) units, moderate damage for 65 (6.4%) units and 547 (54%) units
with a determination of no damage or affected. Affected may be damage that does not affect the
habitability of the residence.
Table 9: Manufactured Housing Damaged/Homeowners Insurance by
OCC Type
Registrant Occupancy
Owner Renter
Owner Category Owner % of Renter % of
No Real Property FVL 1,332 56.9%
Any Real Property FVL 1,009 43.1%
Destroyed 800 34.2%
Destroyed With HOI 239 29.9%
Destroyed No HOI 561 70.1%
Not Destroyed 1,539 65.7%
Not Destroyed With HOI 974 63.3%
Not Destroyed No HOI 566 36.8%
No RP FVL 407 71.9%
RP FVL $0.01-$499 72 12.7%
RP FVL $500-$4,999 86 15.2%
RP FVL $5,000-$24,999 1 0.2%
RP FVL $25,000 and over 0 0.0%
Renter Category
Destroyed 47 4.6%
Major Damage 354 34.9%
Moderate Damage 65 6.4%
No Damage/Affected 547 54.0%
Total Registrants 2,341 1,013
Source: FEMA FIDA 34761, February 1, 2020
US Small Business Administration (SBA) Disaster Loans
The Small Business Administration (SBA) provides low-interest, long-term disaster loans to homeowners,
and renters to repair or replace uninsured/underinsured disaster damaged property. FEMA and the SBA
work together during federally declared disasters to assist homeowners and renters who suffer real and
personal property loss. If referred to the SBA, FEMA applicants must complete an SBA loan application to
be considered for eligibility for FEMA assistance programs. Based on their SBA application, applicants will
be assessed using a Failed Income Test (FIT) to determine their eligibility for an SBA Disaster
Loan. SBA determinations by county are detailed in Table 10.
DR-4562-OR Housing Impact Assessment – April 30, 2021 20Table 10: SBA Registrant Data by County
SBA Total
SBA Under SBA Cancelled SBA Loan Approved and
County Review or Withdrawn Apprvd SBA FIT FIT Percentage FIT
Clackamas 7 16 19 372 391 95.1%
Douglas 4 11 9 441 450 98.0%
Jackson 14 57 177 1,151 1,328 86.7%
Klamath 3 2 1 30 31 96.8%
Lane 2 18 33 321 354 90.7%
Lincoln 2 10 41 174 215 80.9%
Linn 3 6 14 126 140 90.0%
Marion 9 22 50 364 414 87.9%
Source: FEMA FIDA21196, February 1, 2021
Wildfire Insurance Coverage
The Federal Insurance and Mitigation Administration (FIMA) considers insurance to be a form of
mitigation against future losses and reduction of suffering from disasters.20 Insurance helps expedite and
ensure a more resilient recovery. As a disaster recovery resource, the impact of insurance varies widely
with its prevalence and applicability in the impact areas. In Oregon, the State’s Division of Financial
Regulation (DFR), “protects Oregonian’s access to fair products and services through education,
regulation, and consumer assistance.” 21 This includes insurance for consumers. DFR made an initial data
collection effort to better understand the impact of the wildfire events that took place in 2020. The
information provided is focused on data reported for Oregon zip codes that had an evacuation level of 3
at some point during the wildfire events. DFR is conducting a comprehensive data call on the wildfires
that is targeted to be completed in April 2021. The initial data collection, as of December 31, 2020 yielded
the following results.
Total Claims Reported – 11,230
Claims still in Pending status – 3,013
Paid Loss – $778 million
*Case Incurred Loss - $1.03 billion
*Definition for Case Incurred Loss - indemnity case reserves plus claim payments made to date. Estimates
of IBNR should not be included.
Notes/Caveats
This initial data collection was reported by insurance companies making up roughly the top 83%
of the market, based on annual financial data available for 2019.
Insurers were asked to report claims related to fire or wind damage occurring from August 8, 2020
through December 31, 2020.
20 https://www.fema.gov/about/offices/insurance-mitigation
21 https://dfr.oregon.gov/Pages/index.aspx
DR-4562-OR Housing Impact Assessment – April 30, 2021 21 Reporting of claims was not specific to named fire events, however all information was reported
by zip code. Using information on zip codes with evacuation level of 3 we focused in on the areas
affected by the wildfires.
Most Impacted Areas
The vast majority of homeowners carry property insurance (the 2019 American Housing Survey shows
that 94% of homeowners have property insurance) and property insurance covers fire. When HUD
calculates “serious unmet needs” for a disaster, it focuses exclusively on homeowners who do not have
property insurance and renters with incomes of less than $20,000.
This works well with the data FEMA collects for all types of disasters, including fires. As noted earlier,
FEMA does not inspect damage to homeowner units for fire events if the homeowner indicates they have
property insurance. As such, we are unable to use FEMA data to estimate total damage from a fire event.
However, because FEMA does inspect for homeowners without insurance, we can identify the
communities that are likely to be “most impacted” from an event where homeowners are not insured.
To the extent a renter has registered for assistance due to loss of personal property, we also have that
information from FEMA.
Tables 11 and 12 show the counties HUD estimates have serious unmet needs in excess of $10 million
and zip codes outside of those counties with estimates of serious unmet needs in excess of $2 million for
DR-4562-OR.
Table 11 shows ONLY the count of owner- Table 11: Estimated Homeowners with Serious
occupied units with serious damage that were Damage and Not Insured
uninsured for that damage. As is typical for fire Owner serious unmet
events, nearly all of the units identified are Major- Major-
Total
Severe Serious
estimated to have had severe damage. The sum Low High
Unmet
of all seriously damaged owner units without Jackson (County) 483 483
insurance is 550. Douglas (County) 1 9 10
97368 (Lincoln (County)) 43 43
The sum of all renter units with a FEMA 97413 (Lane (County)) 14 14
inspection of personal property that proxies for Owner Most Impacted Total 0 1 549 550
serious damage is 903, with a subset of those units – 573 – occupied by renters with incomes less than
$20,000. It is this subset that HUD considers in its calculation of most impacted unmet needs.
In terms of overall serious unmet needs in most impacted areas using HUD’s methods finds a nearly
50/50s split between homeowners with most impacted unmet needs (serious damage and uninsured)
and renters with most impacted unmet needs (serious damage and incomes less than $20,000).
DR-4562-OR Housing Impact Assessment – April 30, 2021 22Table 12: Estimated renters with serious damage; and the subset with incomes less than $20,000
Renters with FEMA Inspection showing serious
Renter serious unmet (income less than $20K)
damage based on Personal Property Loss
Total Total
Major-Low Major-High Severe Serious Major-Low Major-High Severe Serious
Damage Unmet
Jackson (County) 92 286 223 601 54 168 104 326
Douglas (County) 9 32 168 209 9 28 162 199
97368 (Lincoln (County)) 9 22 18 49 5 10 7 22
97413 (Lane (County)) 9 15 20 44 8 10 8 26
Renter Most Impacted Total 119 355 429 903 76 216 281 573
Jackson County is the most affected of all the declared counties. Additional analysis for Jackson County
is below.
Jackson County Impacts
Within Jackson County, 96% of the homeowner serious unmet needs and 81% of renter serious unmet
needs are concentrated in 9 Census Block Groups. These were identified as areas with more than 10
homes with serious unmet needs. Table 13 shows these Census Block Groups to be in Phoenix city, Talent
city, and the Remainder of Medford CCD.
Table 13: Concentrated Serious Unmet Housing Needs in Jackson County, OR
Census Block
Homeowner
County-Place Group (County, Renter Serious Total Serious
Place Name Serious Unmet
Code Tract, Block Unmet Need Unmet Need
Need
Group)
4157500 410290016011 Phoenix city (part) 60 30 90
4157500 410290016012 Phoenix city (part) 58 26 84
4157500 410290016022 Phoenix city (part) 0 43 43
4172500 410290017001 Talent city 1 15 16
4172500 410290017003 Talent city 22 10 32
4172500 410290017004 Talent city 60 60 120
4199999 410290016011 Remainder of Medford CCD 151 56 207
4199999 410290016022 Remainder of Medford CCD 94 18 112
4199999 410290017003 Remainder of Ashland CCD 20 6 26
Total 466 264 730
DR-4562-OR Housing Impact Assessment – April 30, 2021 23Impacts to Affordable Housing
Oregon Housing and Community Services (OHCS)
OHCS maintains asset management oversight over a portfolio of 1,150 projects state-wide totaling almost
57,000 units, consisting of projects funded with federal and state tax credits, bonds, other federal funding,
(e.g. HOME and Housing Trust Funds (HTF), and state funding. Over 1,000 projects (about 53,000 units)
are residential rental, with the balance comprising a mix of manufactured home parks (MHP), assisted
living and other residential facilities, transitional housing, shelters, and one lease-to-own project. 75% of
the units are targeted to households at 50-
Table 14: OHCS Pre-Wildfire Affordable Housing Inventory
60% of Area Median Income (AMI).
Assisted Living MHP Residential Rental
County Projects Units Projects Units Projects Units
Within the eight disaster-declared counties, JACKSON 2 189 66 2,128
363 residential rental properties comprise LANE 3 142 8 300 79 3,458
CLACKAMAS 4 202 2 184 54 3,274
15,000 units; 13 MHPs with a total of 745 DOUGLAS 3 104 3 261 44 1,379
units (in Lane, Clackamas, and Douglas KLAMATH 13 360
counties, only); and 23 assisted living LINCOLN 3 174 18 687
LINN 1 42 29 1,060
properties total 1,250 units. MARION 7 400 60 2,667
Totals 23 1,253 13 745 363 15,013
Of OHCS’ projects, three properties in Jackson County totaling 127 units were severely damaged (lost).
Table 15: OHCS Wildfire severely damaged (lost) properties
Property Name No. of Units City/County Population
Anderson Vista 36 Talent/Jackson Farmworker
Brookside Rose (Rose Court) 36 Phoenix/Jackson Elderly/Disabled
Northridge Center 55 Medford/Jackson Elderly
HUD Office of Public and Indian Housing (PIH)
Of the Oregon counties designated for Individual Assistance, there is a public housing authority (PHA) in
each of the eight counties.
Housing Choice Voucher (HCV) households are qualified low-income, senior, and/or disabled households
receiving rental assistance (subsidy) to live in participating rental housing (landlords) in their communities.
These eight PHAs assist 1,428 households with Public Housing and 12,104 households with subsidy
During the wildfires, many PHA families had to temporarily evacuate while there was a direct threat to
their homes. The Public Housing units did not receive any permanent impacts by the wildfires (i.e. no
damages or displacements). However, four of the eight PHAs in the designated counties reported a total
of 75 displaced HCV households. The four impacted PHAs were The Housing Authority of Lincoln County
Housing, Homes for Good (Lane County), Marion County Housing Authority, and The Housing Authority of
DR-4562-OR Housing Impact Assessment – April 30, 2021 24You can also read