Housing Needs Assessment - March 2022 - czb - Dutchess County Government

Page created by Francisco Gross
 
CONTINUE READING
Housing Needs Assessment - March 2022 - czb - Dutchess County Government
Housing
Needs
Assessment
March 2022

             Prepared by

                     czbLLC
              czb
Housing Needs Assessment - March 2022 - czb - Dutchess County Government
Acknowledgements
PROJECT STEERING COMMITTEE                                                                STAFF, DUTCHESS COUNTY
                                                                                          DEPARTMENT OF PLANNING AND
Alan Bell                                      Monica LaClair
                                                                                          DEVELOPMENT
Supervisor, Town of LaGrange                   Assistant Superintendent for Business,
                                               Pine Plains Central School District
Betsy Brockway                                                                            Eoin Wrafter
Commissioner (retired), Dutchess               Mary Linge                                 Commissioner
County Department of Services for              Director of Real Estate Development,
                                                                                          Anne Saylor
Aging, Veterans and Youth                      Hudson River Housing
                                                                                          Deputy Commissioner for Housing
Rick Cerino                                    Wren Longno
                                                                                          Jennifer Cocozza
Mayor, Village of Wappingers Falls             Councilmember, City of Beacon
                                                                                          Deputy Commissioner
Darrah Cloud, Founding Member, Tri-            Nicholas Mauro
                                                                                          Heather LaVarnway, CNU-A
Town Coalition, and former Supervisor,         Manager of Recruitment & Workforce
                                                                                          Senior Planner – Project Coordinator
Town of Pine Plains                            Development, Marist College
                                                                                          Dylan Tuttle
David DeVito                                   Robert McKeon
                                                                                          Planner
Vice President, Commercial Real Estate         Supervisor, Town of Red Hook
Finance, M&T Bank
                                               Brian Mossey
Mark Doyle                                     Licensed Real Estate Salesperson,
Vice Chair, Dutchess County IDA Board,         Berkshire Hathaway
and General Manager, Fishkill Farms
                                               Cecilia Stancell
Yvonne Flowers                                 Director of Programs, Dyson Foundation
Councilmember, City of Poughkeepsie
                                               Richard Yeno (Katie Palmer-House)
Joseph Kirchhoff                               Supervisor (Town Clerk), Town of Dover
Principal and CEO, Kirchhoff Companies

                        Prepared for Dutchess County                                    Prepared by czbLLC
                                                                         czb

2    Dutchess County Housing Needs Assessment March 2022
Housing Needs Assessment - March 2022 - czb - Dutchess County Government
Table of Contents

  4 Executive Summary
  8 Introduction
 12 PART 1
       Market Conditions
       and Affordability

 32      PART 2

       Housing Needs Tomorrow

 44      PART 3

       A Strategy for Action

 54 Appendix
            Dutchess County Housing Needs Assessment March 2022   3
Housing
                                           Executive
Needs
Assessment                                 Summary

                                            The broad contours of today’s
                                            housing needs in Dutchess
                                            County are familiar. In fact, they
                                            echo the needs pinpointed in
                                            previous decades by previous
                                            studies in remarkable ways.

                                            What is different in 2022 is that a    levels of government—including
                                            confluence of circumstances have       the county and municipal levels.
                                            created rising levels of need for an   The Dutchess County Housing
                                            expanding range of households,         Needs Assessment describes the
                                            including many that had no             trends that influence rising levels
                                            trouble affording good housing         of need throughout the county,
                                            until recently—especially those        defines clear goals for additional
                                            earning $35,000 to $50,000.            housing interventions, and
                                            These rising levels of need,           recommends a strategic framework
                                            amplified by market tumult during      driven by local resources and an
                                            the pandemic, have turned more         adaptable toolkit of policies and
                                            attention to housing policy at all     programs.

4   Dutchess County Housing Needs Assessment March 2022
A Series                                                                                 Economy

of Long-                                              Demographics

Simmering
Trends                                                                                                         Income
Many factors influence housing needs                                                                          Disparities
and are explored in the Housing Needs
Assessment. They reveal several trends
that contribute to the housing market                   Affordability
experienced by households today. And
most are likely to persist—providing                                                    Housing
direction to future housing goals and                                                   Supply
policy considerations.

Slow growth and a changing              A bigger role for large                    Home values and rents have
population                              housing complexes                          been rising; vacancies are
Population and employment growth        Roughly 15,000 housing units               low
have slowed in recent decades,          have been added to the county’s            Since the fallout of the Great
but shrinking household sizes have      inventory in the past 20 years and         Recession, home values and rents
meant growth in the total number        represent 13.5% of current units.          have been rising in the county,
of households. Over the next 20         While most new units have been             especially since 2016. Low inventory
years, the number of net new            single-family homes, the number of         and low vacancy rates have played a
households is likely to be small, but   units in complexes with 20 or more         significant role, including vacancies
the composition will be different—      apartments has grown by nearly 50%         at larger apartment complexes
including a much larger share of        since 2000.                                dipping below 1% in 2020 and 2021.
households over age 65.

Incomes have lagged behind              Significant increases in cost-             Growth of higher-income
costs for renters                       burdened households                        households has exerted
The value of owner-occupied homes       Lagging renter incomes have meant          pressure on the market
and gross rents in the county have      a substantial rise in the share of         Growth in households with high
outpaced inflation since 2000, as       renters that spend more than               incomes has been a noteworthy
have the incomes of homeowning          30% of their monthly incomes on            trend of the past 20 years. Housing
households. But the incomes of          housing—52% of renters are now             opportunities that match the
renters in the county have lagged       in that position. Renter households        spending capacity of those
behind inflation.                       earning $35,000 to $50,000 have            households have not grown as
                                        experienced the sharpest change,           quickly, however, putting those
                                        with 71% now cost-burdened                 households in competition for the
                                        compared to just 10% in 2000.              same housing as middle-income
                                                                                   households—who also compete with
                                                                                   lower-income households who face a
                                                                                   dearth of affordably priced housing.

                                                                        Dutchess County Housing Needs Assessment March 2022   5
EXECUTIVE SUMMARY

A Clear Goal
for Additional
Interventions
Going
Forward
A key takeaway from trend analysis for the Housing Needs              Total
Assessment is that affordability challenges in Dutchess               Catch Up
                                                                      2,155
County resemble “death by a thousand cuts,” with a range
of factors contributing to the cost pressures felt by today’s
households. For the most part, these factors are long-term and
their impact has matured in recent years. They may have been          interventions
amplified by COVID-19 and the period of price escalation that         to resolve
preceded it, but they were not caused by those events.                existing cost
Regardless of the range and complexity of factors that shape the      burdens
Dutchess County housing market, it is clear that renters earning
less than $50,000 per year should be the focus of additional
interventions to improve access to affordable housing. These          Incremental
households are far more likely than others to currently spend         Catch Up

                                                                      108
more than 30% of their incomes on housing—making them
cost burdened—or highly vulnerable to spending that much, or
more, in the near future.
To “catch up” on unmet needs for renters making less than             interventions
$50,000, it is estimated that 2,155 additional interventions
will be needed—interventions that may include new housing             PER
units, new protections on existing rental units, vouchers to assist
with rent payments, or access to affordable homeownership.            YEAR
In recognition of the considerable volume of these unmet              going forward to
needs, this Housing Needs Assessment recommends an annual,            address existing and
incremental catch up goal of 108 additional interventions             future housing needs
per year for the next two decades.

6   Dutchess County Housing Needs Assessment March 2022
A Strategy
for Action

“Fair Share” approach                       Diverse tools supported by a
to new interventions in                     predictable infusion of local
Dutchess County                             resources
Making progress towards the goal            A Dutchess County Housing
of 2,155 additional interventions           Trust Fund is recommended to
requires both a regional strategy for       support a diverse toolkit that can
                                            be adapted to meet the needs and
Dutchess County and an approach to                                                            Local site
                                            conditions of jurisdictions across                identification
allocating those interventions across the   the county.                                       and land use
county in a manner that reflects local                                                        updates for new
                                            This toolkit may include:
housing needs—and the fact that local                                                         construction
jurisdictions will play a primary role in
meeting their needs.
The Housing Needs Assessment
proposes a “fair share” approach to         Rehabilitation          Local inclusionary        Subsidies
meeting those unmet needs—allocating        program for             policies                  for inclusive
a share to each jurisdiction based on       existing rentals                                  units in new,
                                                                                              mixed-income
its share of current households in the                                                        developments
county, its share of county households
earning under $50,000, and its share of                                                              VOUCHER

county jobs.                                 FOR SALE

                                            Subordinate              Tax exemption            More housing
                                            mortgages                policies                 vouchers
                                            to support
                                            affordable
                                            homeownership

                                                               Dutchess County Housing Needs Assessment March 2022   7
Introduction                                              As the old saying goes, there’s very little new under the sun.
                                                          In 1988, Dutchess County’s Planning staff provided a report to
                                                          the County Legislature regarding the need for more affordable
                                                          housing by the year 2000. Many of its key passages will sound as

       Dutchess County’s
                                                          relevant at the time of this writing in early 2022 as they did more
                                                          than 30 years ago. From the 1988 report:

    housing affordability
                                                             To some extent, recent spurts of residential
                                                             construction are a response to a “pent-up demand”

      challenges are not
                                                             in the housing market; that is, a need for units which
                                                             outstripped the supply. This is easily demonstrated by

         new, but current
                                                             the low vacancy rate in the rental market here (2.8%
                                                             in 1987).

     circumstances create                                    This “pent-up demand” resulted, for a time, in a
                                                             “seller’s market”, where buyers/renters competed to

          fresh urgency to                                   find a suitable unit; and producers were guaranteed
                                                             a comfortable return on homogeneous, upper-end

    address decades-long                                     housing. Left out of the picture, to a large extent,
                                                             were lower and moderate-income consumers

               conditions.                                   seeking an inexpensive rental or low-cost, first-time
                                                             homebuyer unit. These consumers encountered a
                                                             market place in which they often had to search far
                                                             and wide for suitable shelter.
                                                             ……there is a growing disparity (or price/income
                                                             gap) between housing costs and median income.
                                                             At one time, the average income household was
                                                             better able to afford the average priced home. For
                                                             example, in 1960, the median value of a housing unit
                                                             was $14,900 or 2.3-times median household income.
                                                             In 1970, this ratio dropped to 2.1, returning to 2.3 in
                                                             1980. In 1988, however, the average cost of a house
                                                             was approximately 3.6 times median household
                                                             income…
                                                          Recent trends, in the broad strokes, do not suggest much
                                                          more of an affordability problem than existed in 1988. In the
                                                          current era, rental vacancy rates have been under 3% since
                                                          2013, according to data maintained by Dutchess County. In
                                                          fact, according to county data dating back to 1980, low rental
                                                          vacancy rates in larger multi-family properties are the rule, not
                                                          the exception. Today’s home value to income ratios are actually
                                                          lower than those reported in 1988: the median ratio in 2019 was
                                                          3.3 and the average ratio was 2.8 (and historically low interest
                                                          rates make today’s ratios even more affordable for homeowners
                                                          compared to those of the late ‘80s).

8   Dutchess County Housing Needs Assessment March 2022
The culprits for affordability problems in 1988 may also sound   those who build and those who finance, would correct itself
familiar to readers of this report in 2022:                      by building and financing much more conservatively once the
   This “pent-up demand” has occurred for several                economy began to recover following the Great Recession.
   reasons:                                                      What was foreseeable, and to some extent what has come to
   Household formation patterns: Smaller households,             pass, is that the provision of housing in a market economy has
   a bulge in the number of older people living                  a cost—a cost that can be translated into a home purchase
   independently for longer periods of time, and                 price or a monthly rent—and so long as there are households
   patterns of divorce and family dispersion in the              with insufficient income to pay what housing costs in the
   last decade have all increased the number of units            local market, affordability challenges will result. So long as
   needed proportionate to population growth.                    Dutchess County continued to have a substantial number of
                                                                 households with low incomes, housing need would persist.
   Lengthy project approval times: Increased
   development activity and regulatory constraints               Today, it is clear in the data that Dutchess County’s housing
   have lengthened the time period from “conception              market is driven by well-educated, well-compensated, usually
   to construction”, constricting the capacity for               married, usually older, usually homeowner households. It is
   supply to catch up with the demand.                           their demand that sets the terms of the housing market. It
                                                                 is also clear that housing affordability challenges have been
   Limited variety of supply: Units built in Dutchess            growing for those who have always struggled—the county’s
   County since 1980 have been targeted primarily                lowest-income households—and more recently for those who
   toward a limited segment of the potential                     historically have not had to struggle—the county’s moderate
   housing consumer—specifically the upper middle                income households. Furthermore, it is clear that these trends
   income and above homebuyer, except for a few                  were well established by 2019.
   notable exceptions generated by not-for-profit
   organizations, et al.
                                                                 COVID-19 and 2020-2022 Economic Conditions
Small household sizes and the aging of county residents          What is also new, but less empirically supported at this
continue to be demand-side factors today, and difficult          time— not because it is necessarily false, but because there
development processes and limited product and price              is little reliable data—is the idea that “COVID refugees” are
offerings impact the new housing supply. So, is anything         moving into Dutchess County, particularly from New York City,
different today? If so, what?                                    and bidding up the cost of existing housing. Rental vacancy
                                                                 rates have been low for some time, and sales data show that
                                                                 although home prices did experience an anomalous increase
Long-Run Trends and Resulting Fall Out                           from 2019 to 2020, they were already on the rise in 2017.
What would have been difficult to forecast in 1988, or even in   A variety of new factors came into play at or around the same
2000, was how different kinds of households would benefit,       time as COVID, including but not limited to: historically low
or not, from future social, economic, and housing trends that    inventory of homes to purchase, general increase in demand
did not originate in the county but would have important on-     for single-family homes, and specific increase in Millennial
the-ground impacts. For example, labor markets increasingly      household formation. While an influx of new residents may
rewarded soft skills and formal education, and those who had     yet prove to be a real phenomenon, it is, as of this writing,
them reaped the financial rewards. Those households with         only an anecdotal one that will take time to assess. It will
two workers in possession of those in-demand traits benefited    also take time to fully understand the impact of the eviction
doubly. By contrast, in most cases, low-wage service workers     moratorium and other temporary or more permanent policy
did not experience much in the way of pay increases, and         changes that occurred in the midst of COVID.
single-earner households in those lines of work experienced
the greatest financial struggles.
                                                                 Whatever has been going on in the Dutchess housing
It was not necessarily foreseeable that the national housing     market in recent decades, the reality in 2022 is that
production industry would overbuild in the years before 2008,    thousands of households struggle to afford their housing
that credit would be overextended, that the housing market       costs. This report is an important step in the county’s
would crash, and that the housing industry, including both       ongoing efforts to understand and address its housing
                                                                 affordability challenges.

                                                                          Dutchess County Housing Needs Assessment March 2022   9
INTRODUCTION

Reading this Report                                                                      PART 1
This report endeavors to guide                                                           Market
Dutchess County policymakers—
county, town, and village
                                                                                         Conditions and
officials—and practitioners—                                                             Affordability
professional government staff
                                                                                         Part 1 provides an overview of
and housing providers—in                                                                 the demographic, economic, and
defining and pursuing achievable                                                         housing trends of recent years
housing goals. It includes three                                                         that combine to shape current
sections that connect existing                                                           conditions and affordability. It
                                                                                         concludes by defining a “catch
trends, potential future trends,                                                         up” number of interventions that
and the path forward.                                                                    would be needed to address a
                                                                                         prioritized housing need.
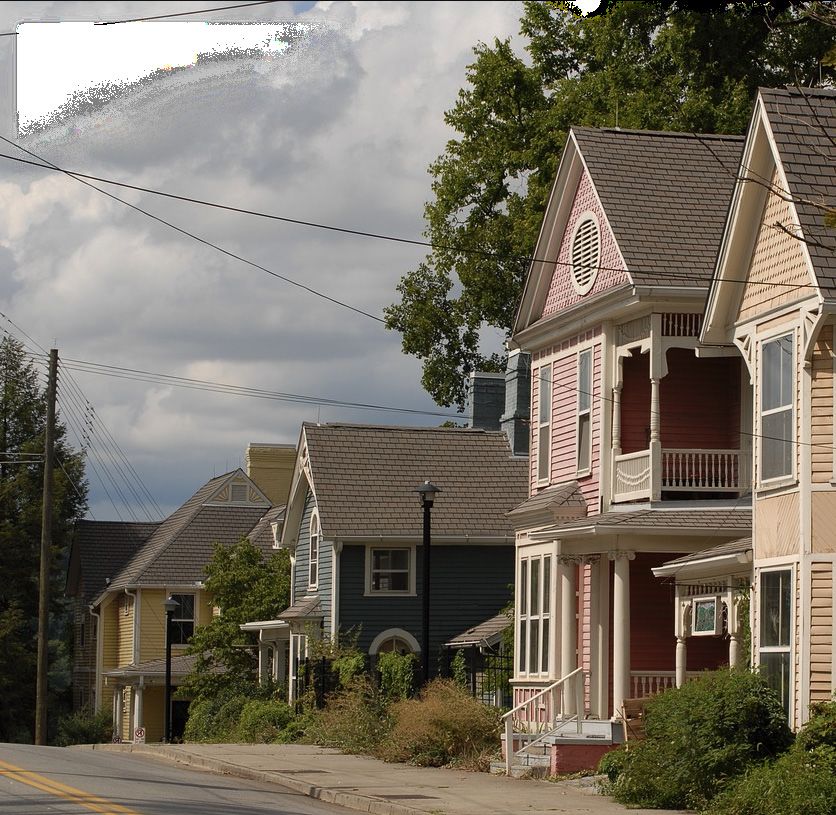
                                                           Photo credit: Jeremy Monaco

10   Dutchess County Housing Needs Assessment March 2022
PART 2                             PART 3
Housing Needs                      A Strategy for
Tomorrow                           Action
Part 2 summarizes three            Part 3 lays out a framework for
scenarios that are used to         moving beyond the study of
understand potential housing       housing needs and towards
needs over the next two            concerted local action with local
decades—all through the lens       resources. It recommends a
of six fundamental household       goal for additive interventions
types in Dutchess County. All      annually, the establishment
three scenarios are rooted         of a county housing fund, the
to population projections          development of a toolkit for
that foresee a rapid aging of      deploying local resources, and
the population, which will         a simple set of principles for
have a significant impact          guiding the use of federal and
on the county’s household          state resources.
profile. Overall, low growth
and a continuation of recent
household income trends are
expected to maintain housing
market dynamics into the future.

                                     Dutchess County Housing Needs Assessment March 2022   11
PART 1
                          Market
                          Conditions
                          and
                          Affordability
                          It is beyond dispute that many households struggle to
                          afford housing in Dutchess County. The data, analysis,
                          and discussion in the following pages illustrates this point
                          as clearly as possible. What is not as simple to explain is
                          why the gaps between housing costs and local households’
                          ability to pay them exist, and seem to be growing. This
                          section provides a brief—not exhaustive—overview of
                          basic demographic, economic, and housing trends, a
                          description of the county’s affordability challenges using
                          the latest comprehensive data, and some possible insights
                          into what has been happening with Dutchess County
                          households that allows some to live comfortably in a more
                          expensive housing market while others struggle.

12   Dutchess County Housing Needs Assessment March 2022
14 Demographics
16 Economy
18 Housing
20 Affordability
24 Income Disparities
26 How Different Areas of the County Compare
30 Key Takeaways

                            Dutchess County Housing Needs Assessment March 2022   13
PART 1: Market Conditions and Affordability

Demographics
Dutchess County’s demographic trends paint a picture
of a population that is aging and no longer growing.

Rapid Mid-20th Century Growth
and 21st Century Slowdown
Dutchess County grew relatively quickly in the middle of the 20th                                    Household growth, however, continued unabated through 2020.
Century, slowed somewhat after 1970, and then effectively stopped                                    Households continued to increase despite population slowdown
growing after 2010. (Officially, as of the time of this report, the 2020                             because, on average, each household has fewer people living in it.
Census reports a loss of 1,577 residents between 2010 and 2020.                                      Decreasing household sizes have been a trend in Dutchess County
Dutchess County has identified some COVID-related issues with                                        since at least 1950, when the average household size was 3.97.
how some of the group quarters were counted and a formal correc-
tion will be sought from the U.S. Census Bureau.)

Population, 1950-2020                                               Households, 1950-2020                                              Number of Households and
                                                                                                                                       Household Size
  350,000
                                                                      120,000                                     111,927
                                                                                                                                        2000                 2010   2020
  300,000
                                                295,911               100,000
                                                                                                                                       99,536            106,952 111,927
  250,000
                                                                      80,000

  200,000                                                                                                                              Household Size
                                                                      60,000
  150,000

                                                                      40,000
              136,781
                                                                                                                                       2.63 2.57 2.42
  100,000
                                                                                38,344
  50,000                                                              20,000

  0                                                                   0
            1950
                   1960
                          1970
                                 1980
                                        1990
                                               2000
                                                      2010
                                                             2020

                                                                               1950
                                                                                      1960
                                                                                             1970
                                                                                                    1980
                                                                                                           1990
                                                                                                                  2000
                                                                                                                         2010
                                                                                                                                2020

Source: U.S. Census                                                 Source: U.S. Census                                                Source: U.S. Census

14     Dutchess County Housing Needs Assessment March 2022
Population by Age, 2000 and 2019                                                                                 Aging Population
                  2000      Younger                                    AGE                                    Older                Since 2000, a key trend in Dutchess
                  2019                                                                                                             County has been the aging of its
                              Less  10 - 19    20 - 24   25 - 34    35 - 44   45 - 54    55- 64   65 - 74    75+
                            than 10                                                                                                population. The number of children
                  50,000                                                                                                           has declined while the age groups 55
                                                                                                                                   and older have grown substantially.
                  40,000                                                                                                           In 2000, Dutchess County’s median age
                                                                                                                                   was only one year greater than that of
                                                                                                                                   the U.S. By 2019, the median aged
                  30,000                                                                                                           Dutchess County resident was four
                                                                                                                                   years older than the median aged
                  20,000
                                                                                                                                   American.

                  10,000                                                                                                           Median Age

                  0

                  Population Change by Age, 2000 and 2019
                                                                                                                                   2000        Dutchess                  U.S.
                                                                                                                                                County
                  +20,000                                                               +18,721

                  +15,000                                                                                                                    36.7 35.3
                  +10,000                                                                         +10,028                                        YRS                    YRS
                                                                                                            +6,487
                  +5,000                       +4,056                         +3,302
 Decline Growth

                                                                                                                                   2010
                  0

                                      -2,360
                                                         -256                                                                                40.2 37.2
                  -5,000
                                                                                                                                                 YRS                     YRS
                  -10,000
                            -9.980
                  -15,000                                                                                                          2019
                                                                   -16,394
                                                                                                                                             42.2 38.1
                                                                                                                                                 YRS                     YRS

Source: 2000 Census and 2015-2019 ACS Five Year Estimates                                                                           Source: 2000 and 2010 Decennial Census, 2015-
                                                                                                                                    2019 ACS Five Year Estimates

                                                                                                                   Dutchess County Housing Needs Assessment March 2022              15
PART 1: Market Conditions and Affordability

       Economy
       The strongest trends in Dutchess County’s economy
       this century are its relatively slow employment
       growth compared to the nation, and the decline of
       manufacturing employment.

       Steady Economic and                                                  Employment Growth Lagging
       Income Growth                                                        the Nation

       Per Capita GDP and Personal Income, 2001-2020                        Annual Percentage Change from Previous Year in Total
                                                                            Non-Farm Employment, 2002-2019

          $70,000                                                                      3%

          $60,000                                                                      2%
                                                                            INCREASE

          $50,000
                                                                                       1%

          $40,000
                                                                                       0

          $30,000

                                                           Dutchess                    -1%
                                                                            DECREASE

          $20,000                                           County U.S.
                                             Per capita GDP                                  Dutchess
                                 Per capita personal income                            -2%    County U.S.
          $10,000

          $0
                                                                                       -3%
                    2001

                                                                     2020
2020

                                                                                             2002
                                                                                             2003
                                                                                             2004

                                                                                             2008
                                                                                             2009
                                                                                             2010
                                                                                             2011
                                                                                             2012
                                                                                             2013
                                                                                             2014

                                                                                             2018
                                                                                             2019
                                                                                             2005

                                                                                             2015
                                                                                             2006

                                                                                             2016
                                                                                             2007

                                                                                             2017

       Source: Bureau of Economic Analysis                                  Source: Bureau of Economic Analysis

       Per capita gross domestic product (GDP) measures the amount          Employment in Dutchess County rose and fell in a pattern similar
       of economic activity in the county and averages that value across      national conditions between 2001 and 2019. But overall
                                                                            to160,000
       all county residents. Between 2001 and 2020, annual growth in        employment growth during that time was 9.3%155,038 in the
       per capita GDP in Dutchess County averaged 2.7% versus 2.9%          county and 22.5% in the U.S. Between 2005 and 2018, annual
       nationally.                                                          employment growth was consistently higher in the U.S. than in
                                                                              155,000 County.
                                                                            Dutchess
       Per capita personal income, which is the total amount of income
       each year averaged across all county residents, grew at an
       average rate of 3.3% versus 3.4% nationally.
                                                                                 150,000

       16      Dutchess County Housing Needs Assessment March 2022
                                                                                 145,000
Gradual Employment                                                      There were few dramatic changes in employment in any specific industries between 2001
                                                                        and 2019. Some notable growth occurred in Health Care and Social Assistance and in
Shifts, Except in                                                       Educational Services (“Eds and Meds”) with a combined increase of over 9,000 workers.
Manufacturing                                                           Government employment decreased by just over 2,300. Manufacturing employment fell
                                                                        substantially however, with a loss of over 10,000; this represents a loss of 55.4% compared to
                                                                        a loss of 24.3% in the U.S. over the same time period.

25,000                                                                                                                                        Employment by industry, 2001-2019

                                                                                                                                              Health care and social assistance

20,000
                                                                                                                                              Government and government enterprises

                                                                                                                                              Retail Trade
15,000

                                                                                                                                                  Educational Services
                                                                                                                                                  Accommodation and food services

10,000                                                                                                                                            Construction
                                                                                                                                                  Manufacturing
                                                                                                                                                  Professional, scientific, and technical services
                                                                                                                                                  Real estate and rental and leasing
                                                                                                                                                  Other services
5,000                                                                                                                                             Administrative support and waste
                                                                                                                                                  mgmt and remediation services
                                                                                                                                                  Finance and insurance
                                                                                                                                                  Arts, entertainment and recreation
                                                                                                                                                  Transportation and warehousing (Data      not available
                                                                                                                                                                                      2010-2012.)
                                                                                                                                                  Information
0                                                                                                                                                 Mgmt of companies and enterprises
                                                                                                                                                  Forestry, fishing, and related activities
         2001
                2002
                       2003
                              2004
                                     2005
                                            2006
                                                   2007
                                                          2008
                                                                 2009
                                                                        2010
                                                                               2011
                                                                                      2012
                                                                                             2013
                                                                                                    2014
                                                                                                           2015
                                                                                                                  2016
                                                                                                                         2017
                                                                                                                                2018
                                                                                                                                       2019

                                                                                                                                              Source: Bureau of Economic Analysis

                                                                                                                                       Dutchess County Housing Needs Assessment March 2022                  17
PART 1: Market Conditions and Affordability

Housing
Dutchess County is a housing market that has been and
continues to be focused on ownership housing. But large-
scale multifamily development is the fastest growing
housing type, with developers responding to rental
demand that can be seen in low rental vacancy rates.

Housing Supply                                           Tenure of Households, 2000 and 2019

Dominated by                                             RENTERS OWNERS                   2000                   2019
Ownership of
Single-Family                                                                                   30,908                    33,873
Homes                                                                                     31%                       31%
                                                                                    69%                       69%
In recent decades, Dutchess County                                                              68,268                    74,540
has clearly been a place where
ownership of a single-family house is
the dominant housing arrangement.                                                TOTAL          99,176                 108,413
In 2000 and in 2019, nearly 70% of
households owned their homes
instead of renting, and nearly 70% of                     Number of Units by Units in Structure, 2000 and 2019
all housing units were single-family
houses (either detached or attached).                                                                               New Construction
Over the same period of time, the U.S.                           2000                       2019                       2000-2019
proportion of owners declined from
66% to 64% while its proportion of
single-family homes increased from
66% to 67%.
New units added to the inventory
during this period were also heavily
tilted toward single-family construction
                                                      Single            73,437                     83,817                 10,380
in the same proportion. A notable                     Family    69%                        69%                   71%
trend for those units that were
not single-family houses was the
prevalence of new units in structures of
20 units or more. Such units were only
3.9% of all units in 2000 and 5% of all
units in 2019, but comprised 13% of all
new units built in the intervening years.
                                                   2-19 Units   23%     24,160             22%     26,790        18%      2,630

Source: czb analysis of data from 2000 Census       20+ Units            4% 4,093                  5% 6,002               1,909
and 2015-2019 ACS Five Year Estimates                                                                            13%
                                                Mobile Homes             4% 4,413                  4% 4,180
                                                   and Other                                                               -2% -233

18     Dutchess County Housing Needs Assessment March 2022
Values and Rents                       Median Value                              2000                              2010                                         2019
Rising                                 of Owner
                                       Occupied
                                       Units
                                                                      $150,800 $323,300 $282,200
Median owner-occupied home
values increased by 87% between        Source: 2000 Census, 2006-2010 and 2015-2019 ACS Five Year Estimates
2000 and 2019. Of course, that
increase was not in a straight line,
as prices more than doubled from       Median Sale Price, 2012-2020
2000 to 2010 before falling during                      2012 2013                2014          2015         2016              2017              2018          2019       2020
the recession.

                                                                                                                                                                         $330,000
                                                                                                                                                              $295,000
                                                                                                                                                $285,000
                                                                                                                              $274,694
                                                                                                            $260,000
Since at least 2012, sale prices of

                                                                                               $260,000
                                                        $255,000

                                                                      $255,000

                                                                                  $260,000
single-family homes have not only
been stable but have begun to
rise. A clear upward trend in the
median sale price began in 2017,
culminating in a gain in 2020 of
almost 12% over the previous year.
Rents have also been rising since
2000, with the county’s median rent
                                       % Change from                  0.0%       2.0%           0.0%        0.0%              5.7%              3.8%          3.5%       11.9%
experiencing an increase of 73%.       previous year
In recent years, rental vacancy has
also been declining according to
                                       Single Family Sales, 2012-2020

                                                                                                                                                                         3,111
an annual rental housing survey

                                                                                                                                                              2,665
                                                                                                                                                2,483
                                                                                                                              2,482
administered by Dutchess County.
                                                                                                              2,269
                                                                                                1,866
                                                                       1,741

The survey, which reports results
                                                                                   1,645
                                                         1,431

only from owners or managers of
properties of at least 20 units who
chose to respond, reports vacancy
                                                   SOLD
at or below 3% each year since 2013
and below 2% each year since 2018.
A market is considered to be healthy   % Change from                  19.8%       -4.0%        13.4%        21.6%              9.4%             0.0%          7.3%       16.7%
with 5% vacancy so these rates         previous year
suggests a tightness in the rental     Source: NYS Sales Web
supply that would support rising
rents and construction of new rental
units.                                  Median Gross Rent

                                                                                 2000                            2010                                        2019
                                                                                 $707                     $1,038                                     $1,220
                                         Source: 2000 Census, 2006-2010 and 2015-2019 ACS Five Year Estimates

                                        Self-Reported Vacancy Rates in Properties with 20 Units or More
                                         4%

                                         3%

                                         2%

                                         1%

                                         0%
                                                 2010

                                                               2011

                                                                          2012

                                                                                   2013

                                                                                               2014

                                                                                                          2015

                                                                                                                       2016

                                                                                                                                         2017

                                                                                                                                                      2018

                                                                                                                                                                  2019

                                                                                                                                                                          2020

                                         Source: Dutchess County Department of Planning and Development

                                                                                             Dutchess County Housing Needs Assessment March 2022                                 19
PART 1: Market Conditions and Affordability

Affordability
The terms of Dutchess County’s market are largely set by
high-income homeowners who have few if any affordability
challenges. Other households struggle to keep up.

Incomes Lagging                                               Owners’ High Incomes Going Far While
Behind Housing                                                Renter Incomes Struggle to Keep Up
Costs, Especially for
Renters
Percent Change in Median Home Value,                          Median Owner
Median Gross Rent, and Median Incomes                         and Renter                           2000                        2010                        2019
by Tenure, 2000-2019                                          Affordability,
                                                              2000, 2010,
90%                                                           and 2019                                                 $323,300                                 $310,581
                                                                                                                                                     $282,200
80%
                                                                                                                                    $255,288
                                                                                                   $195,018
70%                                                           Median                        $150,800
                                                              Owner
60%
                                                              Affordability

50%
                                                INFLATION
                                                2000-2019         Median Value of Owner-Occupied Units
40%                                                               Median Affordable Value

30%

20%                                                           Median
                                                              Renter                                                      $1,038 $944                   $1,220 $1,066
10%
                                                              Affordability                      $707 $780
0%

                   MEDIAN                                          Median Gross Rent
         Home Owner     Rent Renter                                Median Affordable Rent
         Value Income        Income

                                                              Despite the median home value growing faster than the median owner income
       2019        $103,527                $42,654            after 2000, the median homeowner could still afford the median home in Dutchess
                                                              County in 2019. In fact the median owner could afford more. (It is assumed that
                                                              an owner can afford a unit valued at three times annual income.) At the median,
Owner incomes may not have matched the                        county homeowners had no affordability problem in 2000 and, despite a run up in
increase in home values between 2000 and                      values in the late 2000s, continued high homeowner incomes and cooling home
2019, but they did exceed the rate of inflation.              values meant a return to affordability by 2019.
This was not true for renter incomes. In
both cases, housing costs grew faster than                    As the median gross rent rose at twice the rate of the median renter income
incomes.                                                      after 2000, the median renter could no longer afford the median gross rent. (It is
                                                              assumed that renters can afford to spend 30% of their income on housing costs
                                                              each month.)

Source: czb analysis of data from 2000 Census and 2015-2019   Source: czb analysis of data from 2000 Census, 2006-2010 and 2015-2019 ACS Five Year Estimates
ACS Five Year Estimates

20     Dutchess County Housing Needs Assessment March 2022
Too Few Units                                   A gap analysis measures the difference between the number of units in a
for the Lowest                                  given price range—values for ownership units and monthly gross rent for
                                                rental units—and the number of households for whom the price range
and Highest                                     is affordable. Affordability determinations for ownership are based on a
Incomes                                         rule of thumb that a household can afford to buy a unit three times their
                                                annual income. For rental, it is based on a household spending no more
                                                than 30% of its monthly income on gross rent.

Gap Analysis for Owner Households                                      UNITS      HOUSEHOLDS   DEFICIT OF UNITS        SURPLUS OF UNITS
and Renter Households by Income, 2019

                                              OWNERS                                                                        RENTERS
            -1,447        -3,451         -1,790        +3,521         -9,265      -6,098       -6,163       -944       +4,952      +6,229      -1,648      -3,982
40,000

35,000

30,000

25,000

20,000
                                              SURPLUS
15,000                                         of units

10,000            DEFICIT
                  of units

5,000

0

            Less than       $20,000-       $35,000-      $50,000-      $75,000-    $100,000+   Less than    $20,000-    $35,000-    $50,000-    $75,000-    $100,000+
             $20,000        $34,999        $49,999       $74,999       $99,999                  $20,000     $34,999     $49,999     $74,999     $99,999

Gaps for Ownership                                                                              Gaps in Rentals
The county has a deficit of owner units affordable to households                                The county has a deficit of rental units affordable to
earning less than $50,000. The gaps represent owners in houses with                             households earning less than $35,000.
values that appear to be mismatches for their incomes. Some may be                              It also has a deficit of rental units matched to
cost burdened, but some may be low-income seniors who have paid                                 households with incomes at or above $75,000. In this
off their houses and others simply purchased years ago when the value                           case, there are not enough units that are expensive enough
was lower. These latter groups do not necessarily have an affordability                         to take up 30% of the monthly income of these high-income
problem.                                                                                        renter households.
It also has a deficit of owner units matched to households with                                 There is a surplus of units affordable to the income
incomes at or above $100,000. In this case, there are not enough units                          ranges $35,000-$74,999. As a result, many lower-income
expensive enough to be worth three times the income of these high-                              households are “renting up” into a unit that costs more than
income owner households.                                                                        they can afford, with a resulting rent burden, while higher-
There is a surplus of units affordable to the income ranges $50,000-                            income households are “renting down” into a unit that costs
$99,999. As a result, lower-income households below $50,000 and                                 less than 30% of their monthly income and are getting a
higher-income households at or above $100,000 are buying and/or living                          good deal. The greater the demand from the highest-income
in these units. The greater the demand from the highest-income group,                           group, the more pressure there will be on rents to increase
the more pressure there will be on home values to increase over time.                           over time.

Source: czb analysis of data from 2015-2019 ACS Five Year Estimates

                                                                                                        Dutchess County Housing Needs Assessment March 2022         21
PART 1: Market Conditions and Affordability

Housing cost burden, defined as a household spending
more than 30% of its income on housing, is another
way to examine affordability. The lowest-income
households will always spend the greatest percentage of
their incomes on housing costs and low-income renters
are likely to face the greatest struggles.

Owners                                                  Housing Cost Burdens, 2000, 2010 and 2019

The majority (72%) of Dutchess County
owners did not face a cost burden as of                                        Cost Burdened Owners 2000 2010 2019
2019. Of the estimated 21,410 households
that did, 50% had incomes under $50,000,
23% had incomes between $50,000 and                              # of 2019 Cost Burdened Owners                                                        #o
$74,999, and 27% had incomes of $75,000                                     3,779             3,795                 3,123         4,839        5,874
or more. The proportion of owners facing
a cost burden has risen in every income
category since 2000.
                                                                           96%

                                                          100%
Determining the circumstances of an
                                                                        88%

owner’s cost burden is not always easy.
Generally speaking, mortgage lenders
will not finance a home purchase if the
                                                          80%
                                                                                                  73%

borrower will face a cost burden. To do so
                                                                   72%

is to increase the lenders’ risk that the loan
will not be repaid. In addition, the costs of
                                                                                             63%

ownership are not usually subject to rapid
                                                                                                                   57%

increase.
                                                                                                                   55%

                                                          60%
Once a household already owns a home,
                                                                                                                              46%
                                                                                                                              45%

however, cost burden can result from
                                                                                        44%

                                                                                                              41%

a variety of factors that could reduce
household income without reducing
housing costs, including retirement,
                                                          40%
health issues, divorce, or job loss. Some
                                                                                                                            25%

housing costs, if they grow faster than a
                                                                                                                                            22%

household’s income, can contribute to a
cost burden. Examples include taxes and                   20%
                                                                                                                                                12%

utilities.
                                                                                                                                          6%

                                                          0%

                                                  Income Less than                       $20,000 to           $35,000 to    $50,000 to    $75,000+      L
                                                                     $20,000              $34,999              $49,999       $74,999

                                                 Source: 2000 Census, 2006-2010 and 2015-2019 ACS Five Year Estimates

22    Dutchess County Housing Needs Assessment March 2022
19               Cost Burdened Renters 2000 2010 2019                                                                   Renters
                                                                                                                         As of 2019, over half (52%) of all Dutchess
       # of 2019 Cost Burdened Renters                                                                                   County renter households faced a cost
 74              6,639               5,234                 3,403                1,850               505                  burden. Of the estimated 17,631 cost
                                                                                                                         burdened renters, 86% of them had
                                                                                                                         incomes under $50,000. Roughly 90% of
                                                                                                          100%           all renter households with incomes less
                                                                                                                         than $35,000 have faced a cost burden
            92%
            91%

                                 90%
                                 89%

                                                                                                                         since 2010, with high rates of cost burden
                                                                                                                         going back to at least 2000. Renter
                                                                                                                         households with incomes from $35,000
        78%

                                                                                                           80%           to $74,999, although cost burdened in
                                                              71%

                                                                                                                         smaller proportions than lower-income
                                                                                                                         renters, have seen steady increases in their
                                                                                                                         rates since 2000 as well. As rents increase,
                                                                                                                         cost burdens impact households at higher
                                                                                                           60%           and higher incomes.
                               48%

                                                                                                                         The reasons for rental cost burdens are
                                                          46%

                                                                                                                         easy to understand: rents are not fixed in
                                                                                                                         most cases for more than a single year,
                                                                                                           40%           and they go up regularly in line with
                                                                                 34%

                                                                                                                         market conditions and rental property
                                                                                                                         owner costs, while incomes do not.
                                                                                                                         Break even rents for newly constructed
                                                                             15%

                                                                                                           20%           market-rate units are usually between
12%

                                                                                                                         $1,500 and $2,000 per month and this
                                                     10%

                                                                                                                         range is not affordable until annual
                                                                                           6%
                                                                                         0.4%

                                                                                                                         household income reaches $60,000. Even
                                                                           3%

                                                                                          3%

                                                                                                                         older rental units are difficult to maintain
                                                                                                             0%          for much less than $1,000 per month,
 0+      Less than             $20,000 to            $35,000 to            $50,000 to     $75,000+                       affordable only at an income of $40,000. It
          $20,000               $34,999               $49,999               $74,999                                      is virtually impossible for the private sector
                                                                                                                         to provide a unit for $500 per month,
                                                                                                                         which defines affordability for more than
                                                                                                                         7,000 county renter households with
                                                                                                                         incomes below $20,000.

      Number of Cost Burdened Households by Tenure and Income, 2019
                                                  1,850 505

       Renters         6,639         5,234   3,403                     16,242

       Owners      3,779 3,795 3,123         4,839    5,874                                                   53,130

                   0                     10,000               20,000            30,000          40,000         50,000              60,000                  70,000   80,000

        Cost Burdened     ...Less than       $20,000 to       $35,000 to    $50,000 to   $75,000+
        with Income...       $20,000          $34,999          $49,999       $74,999

        No Cost Burden                                                                                         Source: 2015-2019 ACS Five Year Estimates

                                                                                                          Dutchess County Housing Needs Assessment March 2022        23
PART 1: Market Conditions and Affordability

Income Disparities
The housing market is working fine for some households
but not others. More than half of homeowners have
incomes above $100,000 and enjoy good affordability
while lower-income households, particularly renters
with variable housing costs, struggle. What are the
factors at play that cause such disparities?

Income Gains Flow to the Top

One way to look at the county’s
income distribution is to break it
                                                                                40th
                                      Dutchess County Income Quintiles, 2010 vs 2019                                    60th                          80th
into five equally sized groupings

                                                                                                    (50th Pctl)
                                                                                                     MEDIAN
of households called quintiles.
The Census Bureau’s American
Community Survey reports                               Percentile
                                                                  20th     Percentile
                                                                                      40th            Percentile
                                                                                                                  60th              80th
                                                                                                                                Percentile
                                                                                                                                                          95th
                                                                                                                                                         Percentile
the annual income at the very
top level of each one of the
five quintiles for both 2010 and            QUINTILE 1            QUINTILE 2           QUINTILE 3                   QUINTILE 4              QUINTILE 5
2019. The top levels of the five
quintiles are the 20th, 40th, 60th,

                                                                                                                                                               $250,000
80th, and 95th percentile (the
top of the highest quintile is

                                                                                                                                                            $202,905
reported as the 95th percentile

                                                                                                                                       $155,355
because the extreme variation                                                                                                         $124,500
                                                                                                                   $100,863
                                                                                                    $81,219

in the top 5% makes the data
                                                                                                    $69,838

                                                                                                                  $84,587

less useful if included). In the
                                                                                          $63,636
                                                                                         $56,158
                                                                   $32,225

                                           Annual
                                                                   $30,455

middle of the third quintile—the
50th percentile—is the county’s            Income
median household income.                 2010 2019
The relative differences between
low, median, and high incomes            % Change        5.8%                 13.3%       16.3% 19.2%                             24.8%                      23.2%
within this distribution were                                                                                                                           $3,925
already stark in 2010, but
between 2010 and 2019 the                                                                                                         $2,571
differences increased. The fourth            Extra
                                           Monthly                                                     $1,356
and fifth quintiles saw both
the greatest absolute increases
                                           Income
                                                                             $623
                                                                                         $948
                                         2019 vs 2010
and the greatest percentage                              $148
increases. While all income levels
got more money in their pockets                                                     Source: czb analysis of data from 2006-2010 and 2015-2019 ACS Five Year Estimates
each month to spend on housing
between 2000 and 2019, the amounts varied. The median household gained $800 more each month than
the household at the 20th percentile gained. The 80th percentile household gained over $1,600 more than
the median household gained. These differences matter because the housing market is a never-ending
series of auctions and those with more money to spend will bid up the prices. In recent years, the top half of
the market—especially the top 20-25%—has experienced income gains that allow it to bid up housing prices
and the bottom half of the market simply cannot compete.

24    Dutchess County Housing Needs Assessment March 2022
Higher Levels of                                     In the modern economy, “returns to education” have grown. The income benefits due to increased
                                                     educational attainment are indisputably clear, and data specific to Dutchess County tell the story.
Education Drive                                      Median earnings for college graduates in the county grew at almost twice the rate of those without
Higher Incomes                                       a degree between 2010 and 2019. Median earnings for those with advanced degrees grew nearly
                                                     twice as fast as those with only an undergraduate degree and over three times as fast as those with
                                                     just a high school education.
                                                     Almost all the increase in the adult population (aged 25 and older) between 2000 and 2019
                                                     consisted of college graduates, with more than half holding advanced degrees. This growth in well
                                                     educated adults helps drive higher incomes and greater purchasing power at the top of the income
                                                     distribution, putting pressure on housing values and rents and adding to the affordability challenge.

Median Earnings by Educational Attainment, 2010 vs 2019                                College Degree Attainment, 2000, 2010 and 2019

                                                                                                                                                                 Change,
$90,000                                               $86,078             % Change
                                                                                                                                                                2000-2019
                            Graduate or                                                                                                        205,613          +21,888
                            professional
                              degree
                                                                          21%                                              196,715
$80,000                                                                                  Population
                                                                                         Aged 25+ 183,725                                        32,935         +11,072
             $70,853                                                                                                         27,343
                                                                                         Advanced         21,863
$70,000                                                                                  degree

                Bachelor’s $61,644                                        11%            Four year                           35,802              39,123         +10,229
$60,000 $55,508 degree only                                                              degree           28,894
                                                                                         only

$50,000

$40,000     $33,527
                                                      $35,457               6%
$30,000                                                                                  No
                                          High School                                    college         132,968             133,570           133,555               +587
                                           graduate                                      degree
                                       (includes equivalency)
$20,000

$10,000

$0

              2010                                         2019                                         2000              2010                   2019

Source: czb analysis of data from 2006-2010 and 2015-2019 ACS Five Year Estimates       Source: czb analysis of data from 2000 Census, 2006-2010 and 2015-2019 ACS
                                                                                        Five Year Estimates

                                                                                                      Dutchess County Housing Needs Assessment March 2022                   25
PART 1: Market Conditions and Affordability

       How Different Areas of
       the County Compare
                                                                       When the county is divided into smaller urban, suburban, and rural sub-markets, it is
    Rental                                                             clear that countywide rental trends were evident everywhere as of 2019. The household
    Sub-Markets                                                        income segments most mismatched with existing rental housing supply were under
                                                                       $20,000 and $75,000 or more, with the towns surrounding Beacon and Poughkeepsie
                                                                       also displaying shortages for renters with incomes between $20,000 and $34,999. Those
                                                                       groups of households instead rent from the excess units affordable to income ranges in
                                                                       between. When this happens, it is a good deal for the higher-income households and
                                                                       results in cost burdens for the lower-income households. It also puts upward pressure
                                                                       on the rents for the “middle” units over time as landlords seek to cater to the higher-
                                                                       income renters.

                                       Poughkeepsie           Beacon         Beekman,           Dover,        Hyde Park,       Clinton, Milan,          Red Hook,            Amenia, North
                                           City                               Fishkill,      Pawling, Union   La Grange,          Stanford,             Rhinebeck              East, Pine
                                                                            East Fishkill,        Vale      Pleasant Valley,    Washington                                      Plains
                                                                             Wappinger                       Poughkeepsie
                                                                                                                 Town
                                                         Rental Gaps

                                       BY INCOME
                                          Less than $20,000
                                          $20,000 - $34,999
                                          $35,000 - $49,999
                                          $50,000 - $74,999
                                          $75,000+
                              2,000
Surplus of affordable units

                              1,000

                                 0
Deficit of affordable units

                              -1,000

                              -2,000

                                                                                                                          Source: czb analysis of data from 2015-2019 ACS Five Year Estimates

        26                       Dutchess County Housing Needs Assessment March 2022
Rates of cost burden, meaning renters pay more than 30% of their monthly incomes for
housing, were high around the county for all incomes under $50,000, but renters with
incomes between $50,000 and $74,999 were also cost burdened at fairly high rates in
Beacon, the sub-area around Beacon, and the suburban sub-area around the City of
Poughkeepsie.

                       Poughkeepsie               Beacon         Beekman,                Dover,      Hyde Park,      Clinton,     Red Hook,       Amenia,
                           City                                   Fishkill,             Pawling,     La Grange,       Milan,      Rhinebeck      North East,
                                                                East Fishkill,         Union Vale     Pleasant      Stanford,                    Pine Plains
                                                                 Wappinger                             Valley,     Washington
               3,000
                                                                                                    Poughkeepsie
               3,000                  BY INCOME                                                         Town
                                          Less than $20,000
                                      BY INCOME
                                          $20,000
                                          Less than- $20,000
                                                     $34,999
               2,000
                                          $35,000 -- $34,999
                                          $20,000    $49,999
               2,000                      $50,000  - $74,999
                                          $35,000 - $49,999
                                          $75,000+- $74,999
                                          $50,000
               1,000                      $75,000+

               1,000
Number
of Cost
Burdened       0
Renters        0

               100%
               100%

               50%
               50%
Percentage
of Renters
Cost
Burdened
               0%
               0%Source: czb analysis of data from 2015-2019 ACS Five Year Estimates

                                                                                                      Dutchess County Housing Needs Assessment March 2022   27
PART 1: Market Conditions and Affordability

       How Different Areas of
       the County Compare
                                                                    Across specific areas of the county, ownership markets were somewhat better balanced than rental
    Ownership                                                       markets in 2019, as determined by a gap analysis, but with a few exceptions. In the suburban and exurban
    Sub-Markets                                                     sub-markets of the west, southwest, and southeast parts of the county, there were clear shortages of units
                                                                    with values affordable to incomes below $50,000. The apparent excess of units affordable to households
                                                                    with incomes at or above $75,000 in the southeast, southwest, northwest, and north central parts of
                                                                    the county reflects the prevalence of home values at and above $225,000. As described on page 21, the
                                                                    households in those areas for whom there are not enough units matched to their incomes are living in
                                                                    more expensive units than their incomes indicate they can afford. In the sub-area surrounding the City of
                                                                    Poughkeepsie, units affordable to household incomes between $50,000 and $74,999 were oversupplied
                                                                    and those extra units were taken up by households in both higher and lower income ranges.

                                       Poughkeepsie            Beacon           Beekman,           Dover,        Hyde Park,       Clinton, Milan,          Red Hook,            Amenia, North
                                           City                                  Fishkill,      Pawling, Union   La Grange,          Stanford,             Rhinebeck              East, Pine
                                                                               East Fishkill,        Vale      Pleasant Valley,    Washington                                      Plains
                                                                                Wappinger                       Poughkeepsie
                                                                                                                    Town

                                                         Ownership Gaps

                              3,000

                                             BY INCOME
                                                Less than $20,000
                                                $20,000 - $34,999
                              2,000             $35,000 - $49,999
Surplus of affordable units

                                                $50,000 - $74,999
                                                $75,000+

                              1,000

                                 0
Deficit of affordable units

                              -1,000

                              -2,000

                                                                                                                             Source: czb analysis of data from 2015-2019 ACS Five Year Estimates

        28                       Dutchess County Housing Needs Assessment March 2022
Rates and patterns of cost burden, meaning owners pay more than 30% of their monthly incomes for
housing, are quite similar across the sub-markets. The reasons for cost burden are varied and difficult to
ascertain, as described on page 22.

                          Poughkeepsie            Beacon          Beekman,                Dover,      Hyde Park,      Clinton,     Red Hook,       Amenia,
                              City                                 Fishkill,             Pawling,     La Grange,       Milan,      Rhinebeck      North East,
                                                                 East Fishkill,         Union Vale     Pleasant      Stanford,                    Pine Plains
                                                                  Wappinger                             Valley,     Washington
                                                                                                     Poughkeepsie
                  3,000
                  3,000                                                                                  Town
                                BY INCOME
                                BY INCOME
                                    Less than $20,000
                                    Less than $20,000
                                    $20,000 - $34,999
                  2,000             $20,000 - $34,999
                  2,000             $35,000 - $49,999
                                    $35,000 - $49,999
                                    $50,000 - $74,999
                                    $50,000 - $74,999
                                    $75,000+
                                    $75,000+
                  1,000
                  1,000
Number
of Cost
Burdened          0
Owners            0

                  100%
                  100%

                  50%
                  50%

Percentage
of Owners
Cost
Burdened
                  0%
                  0%

                  Source: czb analysis of data from 2015-2019 ACS Five Year Estimates

                                                                                                       Dutchess County Housing Needs Assessment March 2022   29
PART 1: Market Conditions and Affordability

KEY TAKEAWAYS

What do these findings suggest
about “catching up” with
existing housing needs?

Ownership Market                                               Rental Market
The values and sales prices of ownership units (mostly         To some extent, gaps and cost burdens are much simpler
single-family houses) are now at levels that mean any          to understand in the rental market than in the ownership
household earning less than $100,000 will struggle to          market because the only real factors at play are monthly
purchase a home. Gap analysis indicates a shortage of          rent and income, as opposed to all the complexities of
6,688 ownership units for owner households with incomes        various ownership situations. Where unaffordability exists
of less than $50,000. The implication of the shortage is,      in the rental marketplace, it simply means that monthly
first, that the 6,688 owners represent a group who could       gross rent exceeds 30% of monthly gross income.
not afford to buy the homes they are living in today if they   The vast majority of renter households with incomes
had to purchase at today’s values and, second, that the        below $50,000 are cost burdened as of 2019 and
next buyer of a home owned by one of these households          gap analysis indicates a shortage of 2,155* rental
will need a higher income than the existing occupant.          units affordable to these households. The number of
Indeed this has been playing out across the county. The        renter households in this income range remained largely
only owner income category that grew between 2010 and          unchanged between 2010 and 2019 while nearly all renter
2019 was $150,000 or more, while every income category         household growth occurred in the income category at or
below that level decreased.                                    above $100,000 (85% increase).
Cost burden rates as of 2019 are high and/or rising for        While some households with annual incomes below
households with incomes below $75,000, with non-               $50,000 are likely chronically poor, others are working full
mortgage costs playing a larger role for the lowest-income     time or living on retirement income. In many cases, the
households. Amongst cost burdened households with              difference between affordability and cost burden will be
incomes below $20,000, 64% are not paying a mortgage.          but a few hundred dollars each month, and there are a
Amongst those with incomes between $20,000 and                 number of tried-and-true affordable rental housing tools
$34,999, 47% are not paying a mortgage. As incomes rise,       that suggest this group of renters should be a strong focus
the likelihood that a cost burdened owner household has        going forward.
a mortgage greatly increases. The lowest-income owner
households may be facing taxes and utility costs that
exceed 30% of their annual income even if their homes are      *This shortage is drawn from the gap analysis presented on page 21 for renting
paid off—fixed-income seniors may fit this profile. Higher-    households earning less than $50,000. The deficits and surpluses for the three
                                                               income categories below $50,000 were added together to arrive at this figure.
income households facing a cost burden likely do so at
least partially because of a mortgage payment, and this
could be due to households stretching to buy more than
they can really afford, or it could be due to a decrease in
income during the time they owned the home.

30   Dutchess County Housing Needs Assessment March 2022
KEY TAKEAWAYS

What are the key takeaways of Part 1?
                         Population growth, household growth, and employment growth are usually key drivers of
There are no clear       housing demand, but they have been gradual in Dutchess County in recent decades. There is
culprits in the rise     no clear evidence that Dutchess has an “underbuilding” crisis (although, all things being equal,
                         more housing certainly would be better for affordability). Rather, affordability challenges in the
of housing costs.        county resemble “death by a thousand cuts,” including the hard-to-quantify phenomenon of
But important long-      second or seasonal homes that reduce the housing supply for permanent residents.
term trends have         One clear demand-side story is that the top half of the market has done very well economically
                         in this century while the bottom has been stuck in place, and the middle is increasingly
matured, and they        squeezed. The top of the market is composed of many homeowning, well-educated, well-
are part of the cause.   compensated, married couple families and their housing demand is a powerful force impacting
                         those farther down the housing ladder.

                         There are thousands of owner and renter households in Dutchess County paying more than
“Missing Product” at     they can afford, as seen in both the gap analysis and the cost burden figures. The market-based
High and Low Ends        housing production system is not able to rectify these imbalances.
                         Meanwhile, Dutchess County’s housing market is growing at the upper end of the income
                         spectrum. Between 2010 and 2019, the county lost an estimated 9,399 owners with incomes
                         below $150,000 while gaining an estimated 8,461 owners with incomes at or above that amount.
                         During that time, the county gained an estimated 2,399 renter households, of which an estimated
                         2,370 had incomes of at least $100,000. There are thousands of owner and renter households
                         who are living in housing units that cost less than their capacity to pay for them.

                         The cost of new housing is hundreds of dollars per square foot, and costs have risen
More Housing Could       substantially over the years even as those with low incomes have not seen much in the way of
Help                     income growth. New affordable housing development, especially rental housing for households
                         with incomes below $50,000, if substantial enough, will help to meet what is clearly a deep
                         housing need. This housing cannot and will not be built without significant subsidy and other
                         public sector supports, such as zoning changes and infrastructure investment.
                         New market-rate housing for six-figure households, both renter and owner, could help relieve
                         pressure on rents and home prices in the middle if the addition of new supply outpaces growth
                         in demand.

                         The primary housing affordability problem for renters in Dutchess County is not that rents are
Getting More Money       incredibly high—the county’s 2019 median gross rent of $1,220 is not a figure that would make
into the Hands of        a new rental unit financially feasible for a developer, a builder, or a rental operator—but that
                         roughly half of Dutchess renter households do not have incomes high enough to pay the rent in
Renters                  the local marketplace. Programs such as Housing Choice Vouchers have been in place for many
                         years to effectively increase the amount of income that low-income renters have to procure
                         housing. Even if many more rental units are built, additional subsidies beyond the existing supply
                         of vouchers will still be necessary to close current affordability gaps.

                         The difficulty of different interventions, the associated costs, and the nature of the tools available
Intervention Requires    suggest that the County strongly focus on renters with incomes below $50,000 as its “catch
Pragmatic and            up” responsibility. This group represents 14% of Dutchess households, they do not have the
                         option to buy a home, and they are the most vulnerable to uncontrolled housing price increases.
Achievable Goals         The estimated number of interventions is 2,155 and more information about how the need might
                         be met will be discussed in Part 3.

                                                                    Dutchess County Housing Needs Assessment March 2022   31
PART 2
                          Housing
                          Needs
                          Tomorrow
                          There is no way to perfectly predict how the household
                          landscape in Dutchess County will change over the next two
                          decades and, consequently, how the housing needs of the
                          county will evolve. However, scenarios based on educated
                          assumptions about the future offer a way to understand the
                          range of possible issues the community might face.

                          The three scenarios summarized on the following pages
                          are meant to serve this purpose for Dutchess County. They
                          demonstrate how the household landscape in 2030 and 2040
                          might differ from conditions of today and the recent past,
                          as presented in Part 1. And they provide added context and
                          direction for the implementation of policies and strategies
                          outlined in Part 3.

32   Dutchess County Housing Needs Assessment March 2022
34 A Framework for Testing Alternative Futures
36 Baseline Scenario
38 Scenarios - Overview
40 Scenarios - Results and Analysis
42 Key Takeaways

                             Dutchess County Housing Needs Assessment March 2022   33
PART 2: Housing Needs Tomorrow

     A Framework for Testing
     Alternative Futures

                                                           A Focus on Six Household Types

     Projections of future
     housing needs mean
     very little unless                                    These six types are divided into two
                                                           categories by age. Two of the types represent
     they demonstrate                                      households where the householder is 65 or
     how the number and                                    older, and the other four represent households
     characteristics of the                                where the householder is under 65.
     consumers of housing
     units—households—
     might change over                                     Householder Under 65
     time. Every household
     translates to an occupied
     housing unit.
     The scenarios for
     this Housing Needs                                     Married       Married        Single   Single living
     Assessment are centered                                with kids   with no kids    parents      alone
     around the total number
     of households that might
     live in Dutchess County                               Householder 65+
     in 2030 and 2040. Six
     household types that
     represent over 90% of
     all households are used
     here to explore future                                  Married    Single living
     housing needs.                                                        alone

     Note: Household types that are not
     among the six used in Part 2 are fully
     considered by all analysis in Part 1 and
     strategy recommendations in Part 3.

34   Dutchess County Housing Needs Assessment March 2022
The Scenarios

                                     Three scenarios were
                                     designed to demonstrate
SCENARIO #1                          a range of potential
                                     changes that might occur
What if recent demographic and       to the six household
                                     types and to the county’s
household trends continue?           overall household
                                     landscape by 2030 and
                                     2040. Each is based
SCENARIO #2                          on distinct “What if?”
                                     assumptions and is
What if the population grows         grounded to two data
faster than expected?                sources: the American
                                     Community Survey
                                     for baseline conditions
                                     in 2010 and 2019 and
SCENARIO #3                          population projections
                                     for 2030 and 2040 from
What if traditional notions of       Cornell University’s
household formation change?          Center for Applied
                                     Demographics.

                                 Dutchess County Housing Needs Assessment March 2022   35
You can also read