How Computer Science Helps Feed the World - Bruce Yellin EMC - Dell EMC ...
←
→
Page content transcription
If your browser does not render page correctly, please read the page content below

How Computer Science Helps
Feed the World

Bruce Yellin           Stephen Yellin
EMC                    Independent Communications
bruce.yellin@emc.com   Consultant
                       StephenYellin@yahoo.com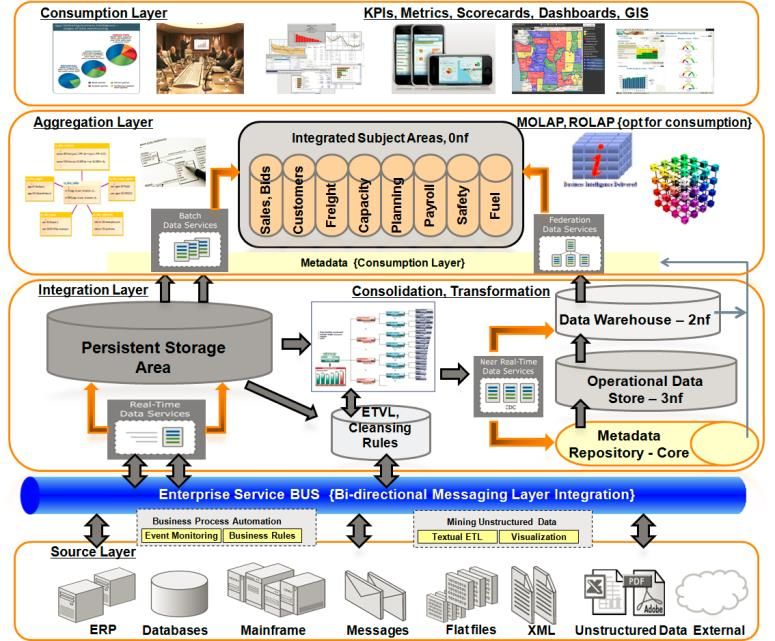
Table of Contents
Introduction ................................................................................................................................ 3
What is the Food Supply Chain? ................................................................................................ 3
   The Food Supply Chain .......................................................................................................... 4

Computer Science on the Farm ................................................................................................. 6
   Geotagging, Telematics, Precision Farming and Controlled Traffic Farming ........................... 6

   Robotics and Automated Milking ............................................................................................ 8

   Big Data on the Farm ............................................................................................................11

      Farmeron and Agrivi - Platform 3 Apps that Deliver Real-time Big Data .............................12

      Badger-Bluff Fanny Freddie – Big Data and Best of Breed ................................................14

      Seeds, Crop Insurance and Big Data .................................................................................16

      Big Data That Flies ............................................................................................................17

Computer Science and the Manufacturer ..................................................................................18
   ConAgra and Peanut Butter – A Visit to the Manufacturer .....................................................19

Computer Science and the Distributor .......................................................................................24
   The Food Supply Chain Depends on Trucking ......................................................................28

Computer Science in the Grocery Store ....................................................................................33
   The Barcode “Miracle” ...........................................................................................................33

   How does the Point of Sale Terminal work? ..........................................................................35

Data Warehousing and Big Data ...............................................................................................37
   Data Warehouse Basics ........................................................................................................38

   Hadoop Basics ......................................................................................................................42

Conclusion ................................................................................................................................45
Appendix – List of Abbreviations ...............................................................................................47
Footnotes ..................................................................................................................................48

Disclaimer: The views, processes or methodologies published in this article are those of the authors.
They do not necessarily reflect EMC Corporation’s views, processes or methodologies.

2015 EMC Proven Professional Knowledge Sharing                                                                                               2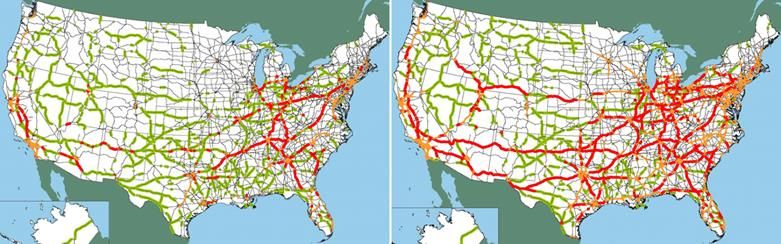
Introduction
Food is essential to life. Our ancestors originally hunted and gathered food, plucking fruit from a
tree, throwing a spear at an animal, or even clubbing a fish. Eventually humans learned to grow
crops and breed livestock, not just hunt, marking the birth of agriculture and civilization. As time
went on, the number of people needed to sustain everyone else began to decrease. The
expansion of science and technology beginning in the Industrial Era greatly reduced the number
of people actively involved in creating food. Technological innovation in machinery and methods
has allowed society to advance where only a minority is needed to feed the rest of the planet.

These technological breakthroughs, together with other improvements such as the motorized
combine have made it possible to feed a global population of billions1. As the global population
has more than doubled from 1961 to 2012, the United Nations Food and Agriculture
Organization shows that various food groups have maintained or exceeded the population’s
growth rate as farmers attempt to feed the world. While food distribution still limits the ability to
                                                  World Yield (metric tons)               1961        2012 Growth
feed everyone properly, crops like sugar          Sugar Cane                     447,977,522 1,842,266,284   411%
                                                  Milk (Cow)                     313,626,619 625,753,801     200%
cane have increased 4-fold, wheat has             Wheat                          222,357,231 671,496,872     302%
tripled, soybeans have increased 9-fold, and      Potatoes                       270,552,196 365,365,367     135%
                                                  Soybeans                         26,882,808 241,142,197    897%
the metric ton production of cow milk has         Population (billion)                 3.0775       7.0431   229%
                                                  http://faostat.fao.org/site/339/default.aspx
doubled.

Yet new innovations will be needed to meet an ever-increasing demand for food. Today over 7.5
billion people inhabit Earth, and by 2050 that number could approach 9-10 billion2. Along the
way, the number of farms is expected to continue to decline in favor of large, corporate-run
entities that perform the same function. Computer science will be critical in pointing the way
forward. This is what makes studying the role of computer science in today’s agricultural
process so important and why we have chosen to write about it.

What is the Food Supply Chain?
Henry Ford’s 1913 Model T assembly line is an early example of how a supply chain helped
make cars affordable3. To feed the                                    Information
                                                                       Information Flow
                                                                                   flow
world’s population in an efficient
and profitable manner, food
production must follow a multi-
                                         farmer        manufacturer          distributor   supermarket   consumer
sourced food supply line process

2015 EMC Proven Professional Knowledge Sharing                                                                      3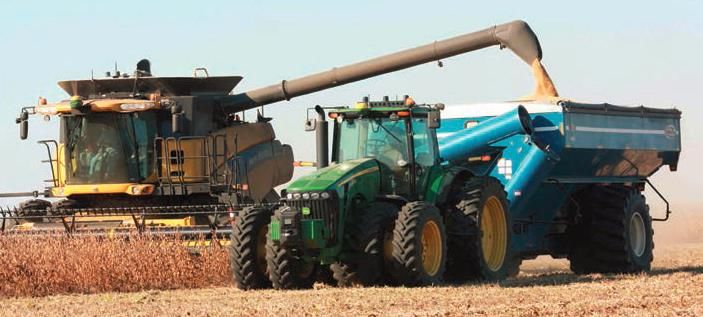
that integrates all facets of this illustration. Most supply chains follow similar paths, such as
producer manufacturer distributor wholesaler retailer consumer. Rewards like
money flow in the opposite direction. To keep the chain optimized, information must also flow.
With food, there are many interactions just at the farm phase alone. For example, there are the
sales of heavy equipment, telephony and communications gear, computer equipment, apparel,
insurance, electricity, gas, government permits and regulations, real estate transactions, and
many more. Depending on the farm product, veterinary service, research and consulting, and
feed production are involved. At the production phase, the meat packing can be labor-intensive,
and many forms of packaging are required along with the plant infrastructure itself, which again
needs equipment, power, technology, etc. Connecting the farmer to the plant requires trucks or
other transportation, workers, roads and infrastructure, police, etc. The amount and types of
detailed interaction that goes on with a supply chain such as food is almost inconceivable. Once
the product is produced the next phase of food distribution kicks in with more of the same
interactive complexity as the process moves one step closer to the grocery store and the
consumer. The grocery store accepts deliveries from the distributor in a just-in-time (JIT)
manner as there is little back room storage at the store – most of the space is dedicated to
shelves and customers. As shelf inventory runs low or in advance of anticipated demand,
additional quantities are ordered, which triggers the distributors to put more goods on trucks.
Communications along the food supply chain (FSC) keeps all players aware of consumer
demand so production can ramp up or down as the entire market dynamics runs 24 hour a day.
Throughout the chain, tracking food throughout the processes is critical to food safety. At the
end of the cycle is waste disposal and recycling.
The Food Supply Chain
The process of taking food from “farm to fork” is a complex chain of steps that stretches from
the creation of the product to its consumption by consumers all over the globe. The FSC
process varies from foodstuff to foodstuff, but each product’s supply chain shares common
characteristics with the others. In order to illustrate the essential role of computer science in
today’s FSC, let’s examine the steps of the chain themselves.
Growing/Rearing - A farmer decides to grow certain crops or livestock, usually based
on market demand. Crops such as grains, fruits, and vegetables are grown and
cultivated from planted seeds, while livestock is bred then reared on the farm.
Harvesting - Crops are collected from the fields, either by harvesting grains and
vegetables from the ground or picking fruits from a tree. Livestock is either chosen for
slaughter or, in the case of cows, milked either by hand or by automated machines.
2015 EMC Proven Professional Knowledge Sharing 4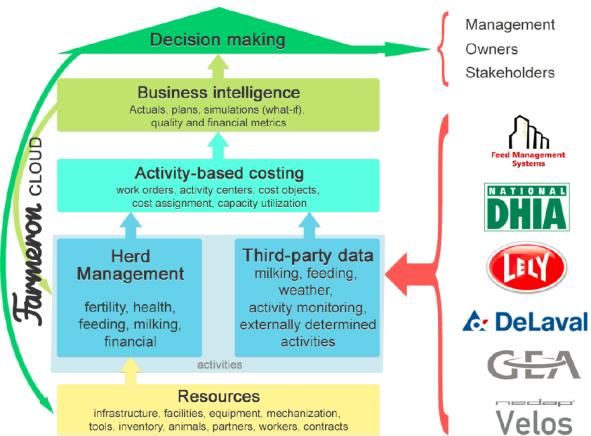
Storing - Foodstuffs are stored in different containers or silos, varying in size and
temperature based on the product being created. For example, milk is stored at a
minimum of 39oF for 48 hours, and with ice cream, the milk is frozen and not chilled 4.
Processing/Testing - Foodstuffs are taken to a processing plant to convert the raw
material into products for public consumption. While at the factory the raw material is
tested to ensure it meets legal quality standards.
Packaging/Selling - Workers package most products, adding required consumer
information such as expiration dates, ingredients and calorie counts. Finished products
are sent to a warehouse for distribution to grocery stores, restaurants, etc.
Consumption - Customers purchase and consume the finished products.
Throughout this process, trucks or other transport are employed to deliver goods to the right
location, on time, in sequence, and at the right price. Items may require packaging, internal
movement on conveyor belts, forklifts or overhead monorails, storage, and retrieval. Items then
may need to be sorted, picked, prepared for shipment, and dispatched to outgoing transports.
All this activity is closely monitored through computer science methods employing concepts like
barcodes, radio frequency identification tag (RFID), magnetic strips, camera vision, and more.
The farmer, manufacturer,
warehouse, and store are highly
dependent on transportation for
each step, data to relay Food Supply Chain
A complex, dynamic transportation system delivering food and ingredients from
quantities, locations, and timing, producer to manufacturer to distributor to grocer
all while minimizing overall costs and adhering to regulations to deliver the food to the
consumer. This seamless, complex interaction of renewable and non-renewable resources
(such as the people, ground, water, air, seed, fossil fuels, solar and wind power) involves whole
foods as well as the creation and formulation of ingredients that are key to what the world
consumes. No single stage in this process operates in isolation. For example, the farmer needs
equipment, workers, fuel, seed, water, sunlight, and more, and consumers interact with the
grocer in terms of workers, selection, payment, parking, etc. Some food follows a direct path as
when the consumer visits a farm to pick strawberries or sticks a fishing line in the ocean.
Consumers also get food from service industries, like one of McDonald’s 35,000 restaurants
that interact with utilities, governments and the media, in addition to their own labor force and a
supplier chain that buys food and ingredients. Computer science is fundamental to this entire
set of supply chains.
The FSC needs continuous feedback to allow the farmer to gauge market conditions, the
manufacturer and distributor to forecast market demand, and the retailer to know what
2015 EMC Proven Professional Knowledge Sharing 5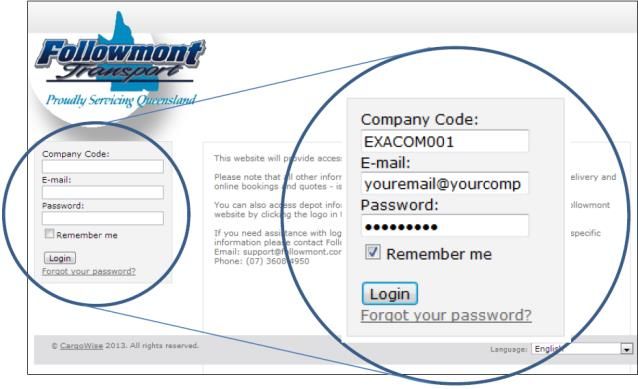
customers like to buy. With approximately 40% of the world’s population involved in agriculture,
data plays a critical role in the FSC5. The many variables in the FSC must all come together to
optimize production and reduce costs, all the while adjusting to a decrease in the number of
farmers and farms – a big data problem. The FSC is focused on the grocery store where
maintaining JIT delivery and high volume are critical to this low profit margin industry6.
Computer science helps this chain reduce risks and costs, increase yield, streamline complex
logistics, and help provide more nutrition to the world. Let’s start with the farm.

Computer Science on the Farm
Farming is historically labor intensive and involves a fair amount of risk. Farmers need to
monitor and react to the weather as well as the market for their products. They must optimize
yield, reduce waste, maintain food safety, and understand the environmental impact, supplier
interaction, and product delivery along the FSC. Let’s explore three areas where computer
science helps the farmer improve productivity and greatly lowers risk – telematics and
geotagging, automated milking, and big data seeding.

Geotagging, Telematics, Precision Farming, and Controlled Traffic Farming
Geotagging is a process of adding latitude, longitude and other geographical metadata to an
object such as a tractor. Telematics is a combination of telecommunications and informatics that
gives a machine geotagged location information, fuel consumption, vehicle safety, quantity of
crop harvested, and more, helping a farmer optimize yield and lower expenses. Precision
farming takes into account that crops have non-uniform needs based on variability of the fields,
and by using Global Positioning System (GPS) navigation, geotagging and telematics, it can
”…apply the right treatment in the right place at the right time…”7. With transponder-equipped
farm machinery, an interactive map can be established with space-based accuracy that
delineates areas of a field that need more (or less) water, pesticide, fertilizer, etc. Together,
these technologies increase crop production, improve profitability, and conserve water and
chemicals because they are focused just on the crops that need them. Equipment such as a
John Deere combine equipped with JDLink Telematics can have its mechanical health, fuel
utilization, maintenance status, operator alerts, and the number of machine hours logged8,9.

The computer science that enables the GPS and Russian Global Navigation Satellite System
(GLONASS) is really a modern marvel. A network of satellites equipped with synchronized
atomic clocks constantly broadcasts their current time and position. GPS employs 32 satellites

2015 EMC Proven Professional Knowledge Sharing                                                      6
while GLONASS uses 2410. A GPS receiver picks up the transmission from a minimum of four
satellites 12,600 mi above Earth to compute the distance to each satellite11. Radio signals travel
at the speed of light (186,000 MP/s), so a farmer can determine where GPS-enabled equipment
is from a desktop application that displays the time it takes to receive the transmission divided
by the speed of light. The distance from the four satellites and a high school math concept
called “trilateration” gives you the data points to let you know exactly where you are.

To illustrate how it works, here is a simple two--dimensional trilateration
problem. Suppose you were lost and someone says you are 625
                                                                                         Boise
                          miles from Boise, Idaho. Good information, but
                                                                                                 625
                                                                                           X
       Boise                            all you would know was that you                          miles
               625
         X                                    were somewhere along this
               miles     Minneapolis
                                               circle 625 away from Boise12. If
               Denver         X     690
                 X                  miles      you were then told you were also 690
        Tucson                                 miles from Minneapolis and 615 miles from Tucson,
    615
          X                                 trilateration would tell you are in Denver. This concept also
    miles
                                  works in three dimensions enabling a farmer to find their GPS-
                        enabled tractor based on satellite transmissions.

This science all culminates in the discipline of Controlled Traffic Farming (CTF). Equipment can
have sets of massively wide tires that crush plants, and in excess of 25% of a field
can easily be trampled13. Land is needlessly compressed and unable to grow crops
                              when a farmer manually steers a tractor and tries to drive
                              in an absolutely straight line. Technology has been
                              developed to minimize the compression by allowing the machinery to
                              be driven by a computer in the driver’s cab. The computer takes in
                              telemetry signals and precisely guides the machine to follow the
exact same path it did the last time it circumnavigated this field. With equipment path tracks
precisely and permanently chosen, and all heavy machinery using the same track width, field
yields have increased by an average of 12% from the same amount of land14. As yields
increase, less seed is needed, fertilizer and pesticide use is reduced, water seeps into the
ground easier, and erosion is reduced. Fewer hours are also placed on the machinery, allowing
the farmer to spend less time in the fields and save as much as 30-50% in fuel costs. As one
farmer noted, before CTF, they needed 120 liters of diesel fuel per hectare (about 2.5 acres).
Using CTF cut their fuel need in half15.

2015 EMC Proven Professional Knowledge Sharing                                                              7
What makes this approach feasible is “autosteer” machinery
enabled by GPS and Real Time Kinematic (RTK) systems. While
standard GPS signals are suitable for tillage, planting, and pre-
emergence spraying, RTK-enabled equipment can operate within
“…one inch pass-to-pass and year-to-year” of a perfect route16.
RTK enhances the GPS accuracy by augmenting the satellite signal with an earth-bound fixed
point base station that transmits tiny differential corrections.

Crops harvested by a combine need a grain truck to capture
the product. With GPS/RTK operated equipment, the
repository truck can be autonomously driven next to the
combine, mirroring the combine’s path without the need for
an operator. As a truck is filled, another can
automatically be brought into play. For example, Kinze
Manufacturing created an Autonomous Harvest System
that uses a driverless tractor and a computerized grain
                                                              Look carefully at this photo. No
cart to work with a human combine driver17.                    one is driving this tractor!
Autonomous Tractor Corporation created a robot tractor that can operate
24x7 precisely following a path and taking the burden out of farming while
dramatically increasing productivity. A farmer “trains” the tractor what to
do and it repeats those steps based on a laser-guided Area Positioning
System (APS) rather than a GPS system.

Robotics and Automated Milking
For most of human history the process of getting milk from the dairy farm to the kitchen table
has begun with long, hard hours of a farmer and his helpers milking cows by hand. Keeping
reliable employees that will show up whenever the cows need milking – each cow’s “milking
speed” differs based on their physical activity and consumption on a given day – is costly, and
the work of milking a cow by hand, tedious18. Sickness and insufficient production means cow
herds often have to be culled, making it hard for dairymen to turn a profit in today’s milk market.

Milk is vital to feeding the world over the next few decades. Production of milk is expected to
grow 19% by 2020, from 692 million tons to 827 million tons, while the number of dairy farms
has declined 30% over the last decade and over 60% in the last thirty years19,20,21. In the United

2015 EMC Proven Professional Knowledge Sharing                                                    8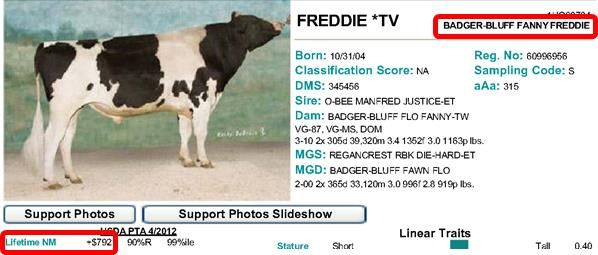
States, almost 60% of milk production comes from large dairies of 500+ cows. In general, a cow
produces 8 gallons/day (about 70 pounds of milk)22. The most productive      Top Milk Production   Pounds
                                                                             Saudi Arabia           23,011
cows are found in Saudi Arabia, Israel, and the Republic of Korea. A cow     Israel                 22,788
                                                                             Republic of Korea      22,153
in the U.S. produces over 21,000 pounds of milk a year.                      United States          21,335
                                                                             Canada                 19,178

Since 1944 the U.S. cow population has shrunk by two-
thirds from 25.6 million cows to 9.3 million cows, but
produces 59% more milk thanks to technological
improvements23. Automated Milking Systems (AMS) were
introduced in the late 20th century as automation and
computer science began replacing human labor in the
milking process24. According to the U.S. Department of
Agriculture's National Agricultural Statistics Service, “… the
average annual milk production per cow in 1950 was 5,314 pounds. By 2000, it had more than
tripled to 18,204. By 2011, as the graphic shows, it had topped 21,000”25.

How does it work?
When “Elsie” the cow feels the need to excrete milk, she follows the training she
was given and walks into a large barn and up to an automated gate. If the milking
               stall is empty, the AMS detects Elsie’s unique transponder which she is wearing
               around her neck, and since the database shows she
               has not been milked in a few hours it lets her in. Cows
               coming in after Elsie naturally queue up until she is
               done milking. If the machine determines Elsie has
been milked too often, she is guided through the stall without being
milked and not given a treat.

Once in the stall, Elsie starts eating a specific amount
of her favorite corn meal or roasted soybeans
pellets26. The AMS knows where Elsie’s teats are
located based on past milking history. As an added
precaution, the robot may use ultrasound, laser
sensors, or 3-D camera imagery to detect, accurately
scan, and map her udder for reference points for the
robotic arm. The robot then uses this Elsie-specific

2015 EMC Proven Professional Knowledge Sharing                                                          9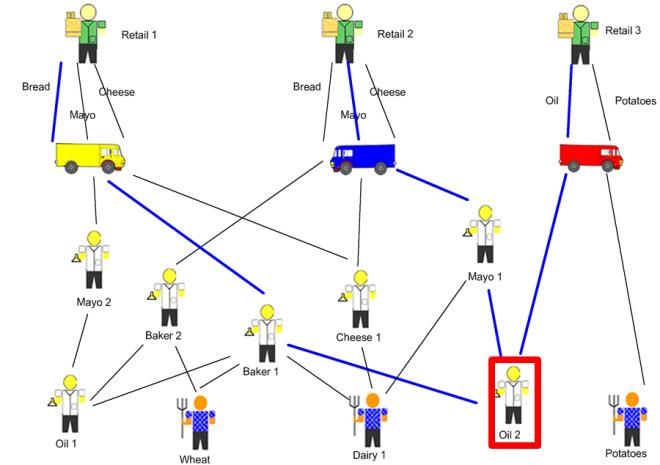
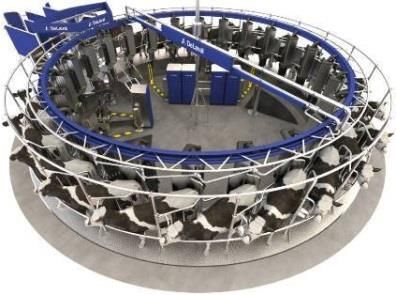
data to move a computer controlled mechanical arm equipped with teat cleaning brushes from
outside the stall to underneath Elsie, and cleans her four teats. After cleaning, the robot then
attaches the teat milking cups to Elsie one at a time based on the mapped coordinates.

This basic flowchart from
patent EP0360354A1
illustrates the steps and
decisions the AMS must
take in instructing the laser
beams to gather
information, guide motor
actuators to move to the
correct coordinates to
ensure the equipment
hooks up to Elsie properly,
and record data about the
event. The AMS then
starts the milking and turns off when the milk flow stops. In essence, Elsie is milking herself. In
the photo of Lely’s Astronaut A4 AMS on the previous page, you can see how the robot arm has
positioned itself under the cow’s udders. When the milking ends, the robot retracts the teat
attachments, cleans Elsie’s teats, and opens a gate for her to leave.

The robot steam cleans the attachments in preparation for the next queued
cow. Her milk is tested, and data is sent to a central computer and database
with information on flow rates, elapsed time, milking speed, milk quality,
how much each cow has eaten, their weight, milk fat content, and even how
many steps it took today. AMS is said to improve a cow’s health with a
reduction in instances of mastitis (inflammation of the cow’s udder). At any
time, the farmer can get a detailed report on Elsie using their smartphone.

Cows are individually milked by AMS as many as 5-6 times a day, 24
hours a day with each machine milking 60-105 cows a day27. One
robot can also serve two cows at the same time when the system is
placed between two stalls. The latest systems are circular allowing
for more robots and thus more cows are milked simultaneously28.

2015 EMC Proven Professional Knowledge Sharing                                                     10
AMS brings significant benefits to the dairy farming industry. For people like Tom Borden, a
sixth-generation New York dairy farmer, AMS is the difference between higher production with
much less physical labor, or going out of business. “Either we were going to get out, we were
going to get bigger, or we were going to try something different”, said Borden, who like many
dairy farmers is now trying “something different” 29.

The AMS increases efficiency, reduces costs (especially labor              Robotic Milking Productivity
costs which often includes room and board, insurance, etc.),               # cows milked per employee
                                                                    1200

improves product quality, reduces environmental impact, and         1000

                                                                    800
improves animal health and welfare. With an AMS, the farmer
                                                                    600
no longer needs to get up at 4AM to begin milking, nor do they      400
                                                                                                    # Cows
                                                30                  200
have to continue working until 10PM at night . As farm labor
                                                                      0
costs rise, AMS naturally looks attractive. This chart shows the             1     1.5    2     3        5

labor gains through automation as milk production increases faster than its labor component31.

AMS also has some drawbacks, however. At $200,000-$250,000 a machine plus the potential
cost of redesigning the barn where milking is done, AMS is expensive. The Bordens, for
example, spent $1.2 million on 2 machines and rebuilding their barns to accommodate them32.
A greater reliance on machinery also means increased operational costs. These startup costs
may prevent small-business dairy farmers from purchasing AMS systems.

Each cow’s milk is held in the farm’s giant chilled storage tank.
After the tank is emptied into a milk truck, it is brought to the
manufacturer/producer where the milk undergoes further
testing; the milk fat is separated, homogenized, pasteurized,
and chilled again. It is then packaged, labeled, and dated with an expiration date, then stored or
loaded on a distribution truck to the distributor or grocery store. If the manufacturer needs
butterfat for other products, it is separated from milk using a centrifuge. If they are using the milk
to make yogurt, they pasteurize and homogenize the milk, then chill it, add culture and perhaps
some fruit or flavoring, and package it33.

Big Data on the Farm
There is a mountain of raw data coming out of the FSC with much of it originating on the farm.
The data is from the fields, barn, and the tractor, and is critical in helping to feed the world over
the next few decades. Farmers want to analyze the data to improve productivity and profitability.
Seed, fertilizer, chemical, and equipment companies use data for product development and

2015 EMC Proven Professional Knowledge Sharing                                                               11
placement, and increased profits. Land owners, insurance companies, and financial institutions access data for risk assessments and pricing. From automated soil analysis that leads to soil composition decision making, real-time actionable data by the farmer, breeding cows that give the highest milk production, financially protecting the farmer from droughts, to making better decisions with seed and crop sensing, big data promises some incredible farm innovation. Farmeron and Agrivi - Platform 3 Apps that Deliver Real-time Big Data Imaginary farmer “Steve” leads a hectic life. He enjoys getting his hands dirty in the field, but he also knows he has to get them even “dirtier” in his farm’s data. In addition to growing vegetables Steve has administrative duties related to hiring additional workers at harvest time, tracking the weather, creating farm progress reports, working with an agronomist (a specialist in soil management and crop production), and meeting with his business coordinator and accountant. Steve has basic sales skills and knows he needs to be more computer-savvy. Steve’s answer is a “platform 3” (cloud) application34. They represent an easy, graphical way to gain valuable insights into his online farm data and other information so he can produce actionable real-time metrics and recommendations, all through his smartphone, tablet, or personal computer. Farmeron Matija Kopić is the CEO of the four year old Croatian-based Software-as-a-Service (SaaS) cloud computing company called Farmeron, which brings a powerful yet easy to use platform 3 app to a farmer’s smart device. It allows Steve the farmer to keep all his dairy data in one place free of the complexity of running his own farm management system on the premises. The system aggregates aspects like feeding and milking to allow for better decision making, leveraging a knowledge base that encompasses over 1,000 farmers. It tracks partners, physical plant infrastructure like the farmer’s barns and equipment, feed orders, and more. One farmer found that just 5 months of Farmeron use helped improve milk production by 34%. Another farmer was able to record herd events in less than 5 minutes in contrast to an older, time-consuming set of complex Excel spreadsheets35. Farmeron analytics features include “…an intelligent weighing system that lets farmers track animal weights against feed mix in order to optimize diets. Farmers also can log medical records for each animal, and get insights into cow breeding cycles and milking, among many other uses.”36 Farmeron can display a herd’s conception rate, number of calvings, milk protein, fat, Somatic Cell Count (SCC shows milk quality), lactation yield, and other trends, or drill-down into a cow’s 2015 EMC Proven Professional Knowledge Sharing 12
health and medical history, diet, and milk production, and tie all that into a farmer’s finances.
The app interfaces with RFID readers and leverages a smart device’s Bluetooth to record
data37. It also has cloud-based analytics and simulations of likely outcomes of management
decisions. "For example, you can see what would happen if you add 50 to 100 cows to your
operation or if you made a significant change in your feeding program."38 It can also answer big-
data questions like “How will an increase in corn prices impact my farm operations?” and “If my
cows eat an additional pound of food, how much more milk production can I expect?”39
                                                                               Decision making
Behind the scenes, Farmeron administrators are
                                                                            Business intelligence
doing the “heavy lifting” of database design, defining                   Actuals, plans, simulations (what-if),
                                                                             quality and financial metrics

procedures, scripting, database administration,                            Activity-based costing
                                                                      work orders, activity centers, cost objects,
                                                                        cost assignment, capacity utilization
optimization, configuring software, replication, and
                                                                     Herd                      Third-party data
more40. As shown on the right, their cloud interfaces             Management
                                                                                              milking, feeding, weather,
                                                                                                 activity monitoring,
                                                                    fertility, health,
with many external systems such as the Lely AMS                feeding, milking, financial
                                                                                               externally determined
                                                                                                       activities
                                                                                       activities
and other farm activities41.                                                        Resources
                                                                 infrastructure, facilities, equipment, mechanization,
                                                                tools, inventory, animals partners, workers, contracts

Farmeron’s web-based dashboard provides real-time data about a farm, even down to the level
of each individual cow. The data is presented in bright
graphs and charts. This cloud-derived chart shows herd
and fertility metrics and information on a herd’s
productivity in contrast to their gynecological status42.

The service costs 25 cents a cow per month for farms with up to 75 cows, or 45 per cow/month
in a 600 animal herd. They estimate the farm management software market at over $12B
annually as 14 million medium-sized and larger corporate farms spend $900 annually on
software costs, together with 150 million small farms who may or may not use software43.

Agrivi
Another Croatian startup, Agrivi, has a platform 3 app that focuses on cloud-based farm
management with an integrated knowledge base “…for over 60 crops.”44 The app coordinates
tasks and expenses, such as the purchase and application of fertilizers and pesticides,
expenditures for fuel, and logging work hours. When products are bought or sold, they are
entered into the app. Agrivi keeps the inventory, provides
weather forecasting information and history for the fields,
and alerts concerning plant disease or pests. All of this is

2015 EMC Proven Professional Knowledge Sharing                                                                             13
through a visual farm manager dashboard on the farmer’s smartphone or tablet, helping
alleviate the farmer’s bottlenecks and increasing profitability.
Using a farmer-task approach, Agrivi uses a project approach to
simplify and make quick work of planning, monitoring, and tracking farm
activities and other variables such as fuel consumption, fertilizer and
pesticide application, inventory with alarms, and hours worked. The
system easily generates reports focused on:
Farm management based on expert templates
Field utilization and efficiency
Inventory tracked to prevent waste and aid in reordering
Finances covering what was sold and what was purchased
Full and part-time workers, and their assigned tasks
Maintenance and fuel consumption
Calendar for personal and company tasks
Details on each field45
The system keeps the farmer aware of the weather with 7-day forecasts, and comparisons to
the past 3 years are made readily available to leverage disease risks. In the field, the farmer can
tap into a knowledge base of best-practices and access all the necessary documents since they
are stored in the cloud. Data is kept in secure data centers with daily backups46. The app is
downloadable from the iTunes app store or Agrivi Version Free Standard Professional Premium
Cost per month* free €15 / $19 €35 / $44 €75 / $93
Google Play, and it is free for one farm and Annual cost* free €150 / $187 €350 / $436 €750 / $935
# Farms 1 3 10 25
one user (see chart at right)47. The pricing for # Users 1 3 10 25
Document storage 50MB 3GB 10GB 50GB
additional users and farms is very straight- *Nov 9, 2014 Euros/Dollars http://www.agrivi.com/pricing/
forward. No contract is required and paid plans can be charged to a credit card or PayPal.
Badger-Bluff Fanny Freddie – Big Data and Best of Breed
Cows produce milk when they are lactating, so they
must be bred and give birth to calves. Farmers often
use artificial insemination to keep the cycle productive.
They have found that they can selectively breed dairy
cows that excel at milk production. Recent studies have
shown that selective breeding can boost milk production
by 8%, and that 500 U.S. bulls are used to inseminate 9 million cows48.
Over the last few years, the amount of livestock data has skyrocketed – from genetics, real-time
RFID inputs with data from automated milking systems and meters that record milk yield and
2015 EMC Proven Professional Knowledge Sharing 14The Number of Records in the U.S.
speed, temperature, fat and protein concentrations, and other data National Dairy Database
Type of record # records
like eating habits and exercise. Most of the data originates on the Cow with lactation data 28,394,976
Lactations 68,373,863
Individual test days 508,574,732
farm and contains animal identification, production environment, and Dystocia records 20,770,758
Animals in pedigree file 58,893,009
performance, with a lot of it stored in a national dairy database49. Bull genotypes 50,393
Cow genotypes 70,687
The biggest issue is how to analyze it and create actionable results. Data mining has turned out
to be one of the primary use cases for this big data challenge. The goal is to perform cluster
analysis, data classification, and regression analysis to discover data relationships. Hadoop
plays a big part in processing the huge amount of raw data. As Cole et al. write, classification
models like these are easily transformed by computer programs like MapReduce to accurately
predict data such as breeding values, feed intake or milk yield50.
Key to increasing milk production is the use of computer science and big data to select the
appropriate genes that help females produce milk, out of a cow’s genome of 3 billion base pairs
and 22,000 genes. In 2009, the USDA examined the 50,000 markers of a Holstein bull’s DNA
that led to the creation of a bull named Badger-Bluff Fanny Freddie. This bull’s semen is in big
demand for artificial-insemination. Before big data, a bull named Pawnee Farm Arlinda Chief
had been recognized as the best for milk and protein production with over 16,000 daughters,
500,000 granddaughters, and 2 million great granddaughters51. So naturally the expectations for
Badger-Bluff Fanny Freddie were dramatically higher.
Similar to baseball statistics
that assign a value to a
player’s total contributions to
a team (Wins Above
Replacement), the key
statistic used to compare a
bull’s real net worth is a
single dollar value that is
called lifetime net merit (LNM). A bull that helps a cow produce an extra 1,000 pounds of milk in
her lifetime has a LNM of $152. Badger-Bluff Fanny Freddie sets the world’s record with a LNM
of $79253. John Cole, an animal scientist, estimates through genetic fine tuning and big data
analysis that the next “Freddie” could be 10 times “better” than Freddie with a LNM in excess of
$7,000. Techniques like this will boost milk production and help feed the world, even with a
smaller dairy herd.
2015 EMC Proven Professional Knowledge Sharing 15Seeds, Crop Insurance and Big Data Big data-based farming is a big business. Monsanto, the seed and biotech giant with annual sales of $16 billion, set a new direction for its company as it sought to leverage big data by providing its customers with “…agronomic practices, seed genetics and innovative on-farm technology to deliver optimal yield to farmers while using fewer resources.”54 Monsanto sees a market for delivering customized reports and products tailored to a farmer’s soil conditions. As a result, they acquired Precision Planting in 2012 and The Climate Corporation in 2013. Precision Planting was known for improved seed spacing, better depth control, and producing plants with better root systems. The Climate Corporation, an agriculture data sciences company, was founded by Google data scientists. Brought together, they introduced Monsanto FieldScripts to tackle the problem that “Corn yield varies across a field. Even in a good year, there are above- and below-average sections of a field. Varying the seeding rate across the different sections of the field may increase yield potential for farmers.”55 FieldScripts allows for the planting of “…less seed in low potential areas and more seed in high potential areas.”56 A two-year test shows corn yields increase by 5% or 5 to 10 bushels per acre57. A 10 bushel increase per acre, at $6/bushel on a 2,000 acre farm, could boost the farmer’s income by $120,000. Field “prescriptions” are stored in the FieldScript cloud, and when the farmer connects their iPad to a Precision Planting seed drill pulled by a GPS guided tractor, varieties of specially engineered Monsanto seeds are precisely deposited in the correct proportions, spacing, and depth according to The Climate Corporation’s big data weather analysis58. FieldScripts is expected to help increase field yield by 25%. They charge $10 per FieldScript acre and believe the market to be in excess of 1 billion acres. This precision agriculture – using computer science technology – goes a long way to help feed the growing population. The Climate Corporation, with over 200 scientists on staff, also insures farmers against the loss of profits because of bad weather. Their mathematical data scientists, agronomists, and climatologists build advanced data models that deliver valuable field-level information to the farmer, leveraging the public cloud computing model. They use Amazon Web Services’ Elastic 2015 EMC Proven Professional Knowledge Sharing 16
Compute Cloud (EC2) for server compute power, Elastic MapReduce (EMR) to process the
data, and store information on the Amazon Simple Storage Service (S3)59.
Using EMR, analytics, and modeling, they issue insurance policies for freezes, daytime and
nighttime heat stress, drought, and heavy rain. The same models help The Climate Corporation
simulate weather patterns and understand their risks should bad weather result in farmer-
initiated claims. “For each point on a grid, it has come up with 10,000 scenarios that could affect
a grower two years out.”60 Eventually they expect to be able to model 100,000 such scenarios.
Their model uses 60 years of crop data, 14 TBs of soil data, and 1 million government Doppler
radar points, all procesed by 50 EMR clusters every day61. They also batch process 20-30 TB
data sets a month that can run for days and use thousands of instances of AWS’s tuned version
of MapReduce. The business’s asymmetric nature is well suited to the public cloud.
Big Data That Flies
Farmers generate an incredible amount of data every year through the care, feeding, protection
and harvesting of their crops. When dynamic conditions are factored in, such as the weather,
crop yield, market fluctuations, machinery upkeep, soil type, soil moisture, soil nutrients, pest
conditions, and satellite and drone data, it is difficult to make sound business decisions. Simply
knowing what seed to plant in a specific field becomes complex as different varieties exhibit
specific genetic traits, such as their water consumption and resistance to insects. The vast
amount of information doesn’t stop there – companies that specialize in custom seed, fertilizer,
chemicals, and machinery use data to develop and market new products, while land owners,
financial institutions, and insurance companies base risk assessments and pricing on big data.
In the past, farmers optimized farm activity using satellites or manned aircraft to collect images.
A plane could cost $1,000 an hour to photograph a field62. For under $1,000, they can use an
airplane or helicopter drone to accomplish the same mission. Drone supplier examples include:
3D Robotics X8-M - can map 25 acres and fly for up to 14
minutes63. With a 12 MP camera and image processing
software, it creates georeferenced and orthorectified maps
based on a farmer’s specified route64.
PrecisionHawk - automatically surveys a field with 12 different
sensors including a camera, multispectral, thermal, LiDAR, and
hyperspectral65. It can stay aloft for an hour and produce a 3D
terrain map showing plant height, weeds, and plant counts, and compute a “health
2015 EMC Proven Professional Knowledge Sharing 17index”66. The drone uses an embedded 600 MHz processor running Dronecode open-
source Linux and cloud-software to
collect, process, and analyse the
data67. The plane takes off in step #2
of this illustration and streams data
when it reaches the target.
Terra8 Agricultural Drone - in Japan, this drone hovers a few
meters over a crop and precisely sprays pesticide over 33 acres in
one hour. Some farms use 10 or more of these simultaneously68.
Yamaha gas-powered drones can spray 8 liters of pesticide and
seed, and use sensors and GPS navigation for precision agriculture69.
Drones can also help with water management. Researchers at Texas A&M used a drone to
image 7 acres of wheat to find crop disease and avoid putting water on the affected area70.
Computer Science and the Manufacturer
Farmers also grow the raw ingredients that go into more complex food staples. An
example of this is Campbell’s “Chunky Beef with Country Vegetables”. This product
contains 27 ingredients including beef, carrots, celery, peas, potatoes, salt, wheat flour,
and more. Many of the foods we eat contain multiple ingredients and those foods must
be prepared using an assortment of inputs from various parts of the FSC. There is also
preparation equipment involved in producing the product like ovens, conveyor belts, labeling
machines, weighing and packaging machines, and more. Another major step involves the basic
manufacturing infrastructure of the factory building: power and cooling, workers, a cafeteria for
the workers, building insurance, and loading docks for the trucks, among others.
Computer science plays a big role in this part of the complex supply chain. Huge amounts of
information flow through the manufacturing process to coordinate all the moving parts, such as:
Ingredients that may arrive JIT or are warehoused somewhere
Man-machine coordination
Orders from distributors that need to be priced and sourced to create delivery schedules
Orders placed with the farms and other sub-contractors, and more
Companies have relied on On-line Transactional Processing (OLTP), Enterprise Resource
Planning (ERP) systems, and Enterprise Data Warehouses (EDW) to help operate their
organization in these data-rich environments. We are now witnessing the shift from data to
2015 EMC Proven Professional Knowledge Sharing 18information. Coupled with advances in computer science like cloud computing, big data,
platform 3 mobile apps, and others, we soon realize the FSC simply would not work without the
technology we often take for granted.
There are many food manufacturing processes that are found in other manufacturing systems.
At a high level, a manufacturer uses “ingredients” to “make something”
out of them before “shipping” finished products to market. Manufacturers
People
are concerned about the same basic issues such as providing an
excellent customer experience, ensuring high quality, efficient
operations, inventory control, adherence to rules and regulations, Technology Process
performing required maintenance, and profitability.
Supply chain management (SCM) is critical to keeping a manufacturing plant running at top
performance. Demand from the consumer can trigger a wave of demand through the distributor,
manufacturer, and the farmer. Rather than just send documents, SCM uses Electronic Data
Interchange (EDI) to streamline the information flow so computers can “talk” to other computers
in a common language. This helps tighten the vast FSC so information can flow in the chain
faster than the goods themselves, making the supply chain more responsive to the consumer.
Customer service goes up, data volumes become huge, and the world becomes a smaller
place. Here’s an example of a manufacturing process.
ConAgra and Peanut Butter – A Visit to the Manufacturer
People all around the world rightfully regard peanuts as a great source of nutrition. As the
Wikipedia entry for peanuts shows, they are nutrient rich and a good source of “…niacin, folate,
fiber, vitamin E, magnesium and phosphorus. They also are naturally free of trans-fats and
sodium, and contain about 25% protein (a higher proportion than in any true nut).”71
Peter Pan peanut butter is owned by ConAgra Foods, a $16 billion-dollar company with two
dozen food brands and 33,000 employees around the world72. Peter Pan makes five
types of creamy peanut butter, three types of crunchy, and three all-natural varieties.
Based on point of sale (POS), past demand, marketing campaigns, seasonal forecasts, and
other data, ConAgra determines what regions of a country will consume specific varieties and
quantities of Peter Pan during a specific time period, such as during the school year. Depending
on a farm’s lead time, which could be impacted by conditions such as weather, pests, etc.,
ConAgra “communicates” with all members of its FSC that it needs large quantities of peanuts.
2015 EMC Proven Professional Knowledge Sharing 19One factory may use over 100 million pounds of peanuts a year and, during peak demand, produce over 500,000 jars of peanut butter a day73. Peanuts need five months of warm weather and an annual rainfall of 20 to 39 inches to grow, with a lead time from planting to harvesting of at least five months74. In the U.S., peanut planting is done in April and harvested in the fall75. The nature of a peanut is that it doesn’t “store” well, meaning poor storage makes it susceptible to mold; as such the farmer isn’t likely going to grow an enormous amount of peanuts unless they know there is market demand. ConAgra also knows there are multiple suppliers of peanuts in the world with their own market prices. In the U.S. the market price for peanuts as of December 23, 2014 was $427.79 per ton of “Virginia” peanuts (other varieties of peanuts include “Runner”, “Spanish” and “Valencia”)76. A year earlier, the same variety were priced at $468.38 a ton. The market demand is not just for raw peanuts, but for all of the ingredients that peanuts make such as peanut butter, peanut oil, peanut flour, boiled peanuts, dry roasted peanuts, and industrial medicines and textiles. For example, ConAgra’s Wesson cooking oil division markets peanut oil. The harvested peanuts are loaded on trucks, ship, or rail, and shipped to the plant. ConAgra keeps track of the peanuts en-route to the plant as it does not want its entire order arriving at the same time, and for food safety reasons. Communication is essential to the process ensuring that the right number of trucks with the right tonnage of peanuts arrives at the right time to the right factory. After unloading at the factory, peanuts are roasted in a 150 foot-long oven. From there, they are blanched (to remove the outer skin), color sorted, grounded twice, homogenized for a smooth texture, and poured into jars moving on a conveyor belt. The modern packaging is a complex process that starts with an injection-molded plastic jar made from super-heated plastic pellets and recycled plastic77. The product is then safety sealed, and given a lid and label. Amazingly, an entire Peter Pan factory is run with just 12 workers78. The finished peanut butter jars are then automatically placed in cardboard boxes. Depending on the factory, boxes are made on premise or come by truck from a box supplier, the latter having their own supply chain. The boxed product is put on a pallet, given a RFID chip to aid its automated tracking, and shipped to waiting warehouses. An RFID is a microchip with an antenna that broadcasts a unique code to a receiver without a visual scan. There are three types of RFID – passive, which are powered from the magnetic 2015 EMC Proven Professional Knowledge Sharing 20
field generated by the RFID reader, semi-passive, which has a
small battery and is activated by a reader, and active, which
has internal power and is always broadcasting79. RFID chips
hold 96 data bits, which can be sent up to 20 feet to a
receiver/PC that would identify the boxes of food on a pallet80.

Automated manufacturing generates data in every step of the process, and when every
machine is digitally networked, it allows the company to have a complete, measurable view of
the processes and materials. It goes beyond running the assembly line or growing and
increasing market share, to regulatory requirements and consumer demand. A top priority for a
food manufacturer is producing safe products, and the data generated during the manufacturing
process helps ensure that. Quality controls are integral to the entire process and encompass the
entire FSC. In 2007, ConAgra had a major food safety problem when Salmonella was found in
their peanut butter. It caused all Peter Pan and rebranded products to be recalled from grocery
shelves. ConAgra lost over $150M in monetary damages and additional indirect brand damage.
To help avoid similar issues, ConAgra uses International Compliance Information Exchange
(iCiX) to automate and manage the collaboration process.

iCiX is used by many industries to help coordinate retailers, manufacturers, distributors, and
suppliers throughout their varied supply chains. Using cloud computing, iCiX shares and
manages information amongst 20,000 businesses and 70,000 facilities while handling 3 million
transactions across 40 countries81. With a worldwide set of producers and suppliers, keeping
the flow of information running smoothly is a major computer science problem. As supply chains
grow, the increased need for documents and information results in a higher risk of errors and
the management of these interdependent processes becomes a big data problem.

The iCiX cloud securely stores, manages, and shares documentation and information between
business partners. Through digital rights metadata, the originator specifies which partners can
access information. A supplier compliance matrix is established, perhaps with electronically
signed and encrypted insurance certificates, product specifications, audit results, and even
qualifiers to ensure products are organic or kosher82. Independent inspectors store reports in
the iCiX repository so critical data can be immediately acted upon83. Suppliers down to the
factory level tie the iCiX data directly into their proprietary systems and a SupplyTrace function
creates a map of the food chain. A dashboard shows the originator and suppliers “in” and “out”
of compliance, allowing buyers, risk managers, and compliance officers access to relevant data.

2015 EMC Proven Professional Knowledge Sharing                                                   21
Let’s say there was a peanut butter snack cracker recall – a food traceability problem. iCiX’s
Rapid Identification of Food Contamination
(RIFCOP) tool would broadcast an alert allowing the manufacturer to see who has received it,
taken ownership of it, and completed the recall – management by exception84. iCiX uses
collaborative social media at a product level to achieve a
critical goal. The alert may begin with a member’s product inquiry using their iCiX ID and a
description of the problem. iCiX responds with a unique tracking ID – i.e. a support ticket. An
email is sent to the inquirer, asking for the
iCiX IDs for the customers and supplier who
had raw ingredients that went into the item or
contained in the item, including ITEM#s and
LOT#s.
The process continues until all impacted
organizations have been notified. This sleuthing
approach can prove quite useful when trying to find
the source of a problem when many consumers
have the same complaint across multiple retailers.
RIFCOP can help deduce the common element to
the retailers involved – in this example, the
highlighed square in the diagram to the right.
Much of the data generated on the assembly line comes from mechanical, electrical, and
thermal sensors. A mechanical sensor can gather data on an item’s position or
measure its velocity. Electrical sensors can determine voltage, current, and resistance.
For example, this sensor measures the presence of liquid with a certain electrical
conductivity and can be used in the manufacturing of peanut butter85.
Sensors attach to the input module of a programmable logic controller (PLC). A PLC is a small
processor with memory, networking, and a special operating
Power supply
Inputs
system that collects analog and digital measurements and Input
modules
from
process
Programming
forwards them to a master computer and database. This device
Processor Outputs
Output to
modules process
PLC block diagram shows the I/O modules, CPU, memory, Memory
86
power supply, and non-volatile memory . A sensor would signal the PLC when a jar is full.
Output modules could turn on or off a mixing motor, or a peanut butter pump that fills a jar.
2015 EMC Proven Professional Knowledge Sharing 22A program tells the PLC what to do based on sensor input signals. For example, if a sensor
reports a jar is full, the PLC turns off the filling pump, tells the conveyor belt motor to advance,
then turns on the pump to fill the next empty jar. “Ladder logic” is a PLC programming language.
Assume you had a simple circuit. The battery is wired to the
switch and then to the bulb. Closing the switch turns on the
bulb. The ladder diagram shows switch S1 and lamp PL1. The
horizontal line is like a ladder rung and the side power rails L1
and L2 are the ladder rail. Ladder programs use uniquely
addressed graphical symbols for a switch, motor, lamp, etc. For example, with two switches the
first would be S1, and the next one S2, allowing the program to uniquely refer to the component
being controlled. In this diagram, a
mixer motor stirs the liquid in the
container when the temperature and
pressure sensors reach a preset value,
or with a manually operated switch87.
Some modern factories are evolving beyond the simple PLC to a PAC. A Programmable
Automation Controller (PAC) is essentially a personal computer with a self-contained set of
PLCs that could control multiple sets of devices. A PAC can be programmed in languages like C
or C++ rather than the graphical ladder logic representation of coils and contacts88.
The data collected by PLCs and PACs is sent to a transactional database. While not a typical
OLTP, the database nonetheless would capture the details of what the sensors have sent to the
controllers with full timestamps, lot numbers, temperatures, and other statistics.
Some of the collected data is used in higher level systems that help run a Finance and
Accounting
business, such as an ERP system. An ERP is a very large database
that holds a single master record for items like products and Sales and
Production
and
ERP Data
Marketing Repository Materials
employees, with transactional data records for all company Management
activity. It collects, stores, manages, and helps derive business value Human
Resources
from sales, invoicing, shipping, inventory management, product planning,
marketing, manufacturing, procurement, and accounting daily activities. It can also tie all
business functions together through add-on modules such as sales and marketing, finance and
accounting, production and materials management, and human resources89. Using ERP as a
base, additional functionality can be added to encompass areas such as Customer Relationship
2015 EMC Proven Professional Knowledge Sharing 23You can also read