How Equitable Are the Distributions of the Physical Activity and Accessibility Benets of Bicycle Infrastructure?
←
→
Page content transcription
If your browser does not render page correctly, please read the page content below
How Equitable Are the Distributions of the Physical Activity and Accessibility Bene ts of Bicycle Infrastructure? Christopher Standen ( c.standen@unsw.edu.au ) UNSW: University of New South Wales https://orcid.org/0000-0002-8027-6773 Melanie Crane The University of Sydney School of Public Health Stephen Greaves The University of Sydney Business School Andrew Collins The University of Sydney Business School Chris Rissel The University of Sydney School of Public Health Research Article Keywords: health equity, physical activity, accessibility, bicycle Posted Date: June 2nd, 2021 DOI: https://doi.org/10.21203/rs.3.rs-560002/v1 License: This work is licensed under a Creative Commons Attribution 4.0 International License. Read Full License
1 Title

2 How equitable are the distributions of the physical activity and accessibility benefits of bicycle

3 infrastructure?

4 Authors

5 Christopher Standen (corresponding author)a

6 c.standen@unsw.edu.au

7 Melanie Craneb

8 melanie.crane@sydney.edu.au

9 Stephen Greavesc

10 stephen.greaves@sydney.edu.au

11 Andrew T. Collinsc

12 andrew.collins@sydney.edu.au

13 Chris Risselb

14 chris.rissel@sydney.edu.au

 a
15 Centre for Primary Health Care and Equity, School of Population Health, University of New

16 South Wales, NSW 2052, Australia

 b
17 Sydney School of Public Health, The University of Sydney, NSW 2006, Australia

 c
18 Institute of Transport and Logistics Studies, The University of Sydney, NSW 2006, Australia

 1
19 Abstract

20 Background

21 Cycling for transport provides many health and social benefits – including physical activity

22 and independent access to jobs, education, social opportunities, health care and other

23 services (accessibility). However, inequalities exist for some population groups in the

24 opportunity to reach everyday destinations, and public transport stops, by bicycle – owing in

25 part to their greater aversion to riding in amongst motor vehicle traffic. Health equity can

26 therefore be improved by providing separated cycleway networks that give people the

27 opportunity to access places by bicycle using traffic-free routes. The aim of this study was to

28 assess the health equity benefits of two bicycle infrastructure development scenarios – a

29 single cycleway, and a complete network of cycleways – by examining the distribution of

30 physical activity and accessibility benefits across gender, age and income groups.

31 Methods

32 Travel survey data collected from residents in Sydney (Australia) were used to train a

33 predictive transport mode choice model, which was then used to forecast the impact of the

34 two scenarios on transport mode choice, physical activity and accessibility. Accessibility was

35 measured using a utility-based accessibility measure derived from the mode choice model.

36 The distribution of forecast physical activity and accessibility benefits was then calculated

37 across gender, age and income groups.

38 Results

39 The modelled physical activity and accessibility measures improve in both intervention

40 scenarios. However, in the single cycleway scenario, the benefits are greatest for the male,

41 high-income and older age groups. In the complete network scenario, the benefits are more

42 equally distributed. Forecast increases in cycling time are largely offset by decreases in

 2
43 walking time – though the latter is typically low-intensity physical activity, which confers a

44 lesser health benefit than moderate-intensity cycling.

45 Conclusions

46 Separated cycleway infrastructure can be used to improve health equity by providing greater

47 opportunities for transport cycling in population groups more averse to riding amongst motor

48 vehicle traffic. Disparities in the opportunity to access services and economic/social activities

49 by bicycle – and incorporate more physical activity into everyday travel – could be addressed

50 with connected, traffic-free cycleway networks that cater to people of all genders, ages and

51 incomes.

52 Keywords

53 health equity, physical activity, accessibility, bicycle

54 1 Background

55 Transport is one of the main social determinants of health [1]. The way transport systems are

56 designed, and the resources allocated to them, have the potential to disproportionately

57 benefit or negatively impact certain population groups or neighbourhoods [2]. For example,

58 building a transport system based on roads and private motor vehicles favours those people

59 who can afford to own, and are able to drive, motor vehicles – while the external effects of

60 motor vehicle traffic, such as air and noise pollution, affect the health of disadvantaged

61 groups more [3].

62 Giving more people the opportunity to ride a bicycle for everyday transport – through

63 providing connected networks of quiet streets and paths protected from motor vehicle traffic

64 – has well-documented public health, sustainability and economic benefits [4–6]. However,

65 the equity impacts of bicycle infrastructure projects or plans are rarely assessed. While there

66 is a considerable literature on the equity of road pricing schemes and public transport, there

 3
67 is a smaller body of knowledge on the equity impacts of bicycle policies. The literature here 68 includes studies on the use of bicycle share schemes by different population groups [7], but 69 has largely failed assess health aspects, including health equity [8]. 70 Lee et al. [9] developed a theoretical framework for assessing the broad equity impacts of 71 active transport (e.g., walking and cycling) policies and plans, which is summarised in Table 72 1. The first step within this framework is to choose a model of distributive justice, e.g., 73 whether resources should be targeted to address inequality, inequity or need [10]. The 74 second step is to choose the equity lens(es), i.e., whether to assess the distribution of 75 benefits and costs between different population groups or between geographic areas. The 76 final step is to select which benefits and/or costs to measure. 77 Table 1: Theoretical framework for equity in active transport planning – adapted from Lee et al. [9] Models of distributive justice Equality rule Benefits and costs of active transport should be the same for everyone. Equity rule Benefits and costs of active transport should be distributed proportionally, e.g., provide infrastructure where demand is highest. Needs rule The greatest benefit should be provided to the most disadvantaged population groups or geographical areas. Social Assesses how active transport benefits or costs are distributed between different population groups. Focus is typically on disadvantaged population groups, e.g., low-income, indigenous, women. Disadvantaged population groups sometimes have the most to gain from active transport policies, due to lower levels of physical activity, vehicle ownership and Approaches to identifying access to public transport. inequities in measured benefits Spatial Assesses how active transport benefits or costs are distributed between different or costs of active transport geographical areas (e.g., neighbourhoods). Modal Assesses whether users of a given mode of transport are better/worse off than others, or disproportionately affected by a transport project policy or project, e.g., pedestrians having longer average waiting times at signal-controlled intersections. Procedural Assesses the fairness of decision making, e.g., whether disadvantaged groups/areas/modes are considered in, or disproportionately affected by, strategies, plans, designs, etc. Measures of the benefits and Benefits Availability or accessibility of active transportation infrastructure. costs of active transport Walking/cycling accessibility to employment, education, public transport stops, supermarkets and other activity destinations. Active transportation infrastructure quality, e.g., kerb ramps and pavement quality. Physical activity associated with active transport. Costs Exposure to air pollution. Risk of being killed/injured by a motor vehicle. Individual Benefits of active transport less the costs, from the user’s perspective. welfare 78 79 The health benefits and costs measured in assessments of active transport interventions 80 (whether equity-focused or not) typically include changes in physical activity, road trauma 81 and air pollution exposure [4,11,12]. One example of a health equity-focused assessment of 4
82 active transport infrastructure is that by Wu et al. [13], who developed a model to forecast

83 changes in disability-adjusted life years (DALYs) attributable to changes in physical activity

84 and road trauma, across race/ethnicity and income groups.

85 Given the physical and mental health consequences of social/economic isolation and

86 loneliness [14], and poor access to services (including health care) [15], another important

87 benefit of bicycle infrastructure is improved accessibility, i.e., more opportunities to access

88 jobs, education, social opportunities, services, healthy food options, etc. There are several

89 established ways of measuring accessibility [16]. Contour measures simply count the number

90 of opportunities that can be reached within a given travel time or distance of an origin (e.g., a

91 residential neighbourhood). Gravity-based measures are similar but, instead of specifying a

92 maximum distance/time, give greatest weight to opportunities that are closest to an origin.

93 Utility-based measures are founded in welfare economics and attempt to place a monetary

94 value on the range of destination and mobility choices available to an individual. Kent and

95 Karner [17] used a contour measure to assess how accessibility to supermarkets, libraries

96 and businesses would improve with a range of proposed bicycle infrastructure projects – and

97 how these accessibility improvements would be distributed according to poverty status, race,

98 and motor vehicle ownership status. We are aware of no equity-focused health assessment

99 of an active transport intervention that has measured changes in accessibility using a utility-

100 based measure.

101 In Australia, cycling for transport is often viewed as the preserve of male, inner-city white-

102 collar workers [18]. This view is supported by Census data, which show that bicycle

103 commuters are most likely to have an above-average income, be male, and be aged 20 to 49

104 years [19–21]. However, it is older adults and women who are more likely to be inactive or

105 only moderately active (Australian Bureau of Statistics, 2019), and therefore have most to

106 gain – physical activity-wise – from having more opportunities to cycle for everyday transport.

107 Spatially, planning of, and investment in, bicycle transport paths and networks (as opposed

 5

108 to recreational paths and rail trails) has been concentrated in gentrified, inner-city areas. Yet,

109 it is suburban residents who are less likely to be achieving sufficient physical activity [22].

110 2 Methods

111 2.1 Aim

112 In this study, we assess the health equity impacts of planned bicycle infrastructure in Sydney

113 (Australia) by comparing two intervention scenarios – a single cycleway and a complete,

114 connected bicycle network – with a business-as-usual scenario. Within the Lee at al. [9]

115 equity framework (Table 1), we adopt a social equity lens, assessing how benefits are

116 distributed among gender, age and income groups. The benefits we consider are physical

117 activity and accessibility.

118 2.2 Setting

119 The study area was the City of Sydney local government area (LGA), which is situated in the

120 eastern part of the Greater Sydney metropolitan area in the Australian state of New South

121 Wales (NSW). It comprises Sydney’s main central business district (CBD) and the

122 surrounding inner-city suburbs. It has a diverse population and has experienced significant

123 gentrification in recent years, though pockets of socio-economic disadvantage remain.

124 Greater Sydney is car-oriented and not conducive to everyday transport cycling, for several

125 well-documented reasons [23]. Among these are a lack of traffic-separated/protected cycling

126 facilities and a high default residential speed limit (50 km/h). State laws mandate the use of

127 bicycle helmets, which can represent a barrier to participation in transport cycling [24]. These

128 laws are zealously enforced, with young Aboriginal people – who are less likely to have the

129 means to pay the A$344 fine – targeted in particular [25,26]. Despite these laws, cycling

130 injury risk is relatively high for a high-income country [27,28]. Adults are not permitted to

 6

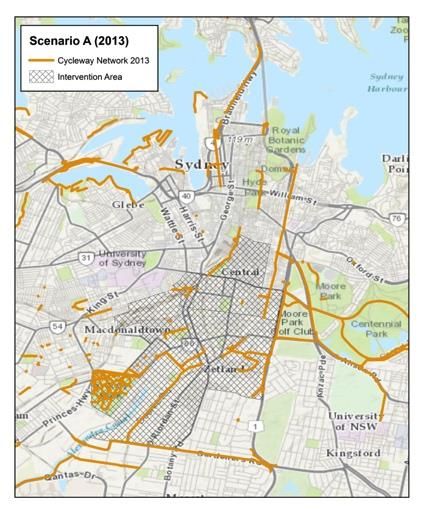
131 cycle on footpaths, unless accompanying a child or riding on a shared pedestrian and bicycle

132 path.

133 Some arterial and collector roads have paint-marked bicycle lanes, but these are often

134 situated in the hazardous ‘door zone’ between parked vehicles and general traffic lanes. At

135 the time of data collection, the few existing separated bicycle paths (also known as cycle

136 tracks) and shared pedestrian and bicycle paths were disconnected and lacked continuity,

137 with very poor level of service at signal-controlled intersections. The City of Sydney LGA is

138 relatively hilly, which may partly explain the boom in e-bike sales in recent years [29]. The

139 climate is temperate with hot, humid summers and mild winters, and an average of 144 rainy

140 days and 1,211 mm of rain per year [30].

141 On the day of the 2016 Census, 4% of males and 1.8% of females in the City of Sydney LGA

142 commuted to work using a bicycle as their main transport mode. The respective values for

143 Greater Sydney were 1.1% and 0.3% [31].

144 As part of a policy to give more people the option to use a bicycle for everyday transport, City

145 of Sydney Council has a Cycle Strategy and Action Plan [32]. The centrepiece of this

146 strategy is a planned 200-km bicycle network, including 55 km of separated cycleways

147 (made up of bicycle paths and shared pedestrian and bicycle paths).

148 2.3 Intervention scenarios

149 To assess the distribution of the health impacts of proposed new bicycle infrastructure in the

150 City of Sydney LGA, and how they might differ between piecemeal and complete bicycle

151 network development, we modelled three scenarios, described below and mapped in Figure

152 1.

153 1. Business as Usual: The bicycle network as it existed in 2013.

154 2. Single Cycleway: The 2013 network, plus a single 2.4-km cycleway along George Street,

155 connecting the Green Square urban redevelopment area in Sydney’s Inner South with

 7
156 the CBD, and passing through suburbs with a large amount of public and Aboriginal

157 housing (Waterloo and Redfern).

158 3. Complete Network: The 2013 network, plus completion of the bicycle network proposed

159 in the Cycle Strategy and Action Plan [32].

160 Figure 1: Scenarios

161 2.4 Sample

162 Data collection is described in detail elsewhere [33] but, for the benefit of the reader, a brief

163 synopsis follows. Participants were recruited between September and November 2013.

164 Eligibility was based on residential location (City of Sydney LGA only), age (18–55 years

165 only) and self-reported ability to ride a bicycle. Recruitment was via several methods,

166 including consumer panels, random digit dialling, intercept surveys, letterbox drops, social

167 media and electronic mailing lists.

168 Achieving recruitment quotas for some population groups proved challenging, resulting in a

169 convenience sample not representative of the population on certain demographics. However,

170 this does affect not our equity analyses, because changes in outcome measures are

171 averaged for each population group.

172 Following recruitment, participants were asked to complete an online questionnaire and

173 seven-day travel diary. Participants were given the option to download a smartphone tracking

 8
174 app to record their travel and assist them in completing their travel diaries. Those completing

175 both the questionnaire and the travel diary were given a financial reward of $A65.

176 2.5 Variables

177 In the questionnaire, participants were asked about their age, gender, household income,

178 and education level. For the gender question, only two response options were available

179 (female and male).

180 Physical activity in the previous week was measured using the Active Australia Survey [34].

181 Participants were also asked what type of bicycle rider they most identified as. Response

182 options were:

183 a) ‘A low intensity recreational bike rider – you like the fresh air and exercise, and cycle at

184 an enjoyable pace’;

185 b) ‘A high intensity recreational bike rider – you like to ride hard and fast’;

186 c) ‘A low intensity transport bike rider – you are about just getting to places, and you travel

187 at a more comfortable speed’; and

188 d) ‘A high intensity transport bike rider – you are a fast rider who likes to keep up a fast pace

189 throughout your journey’.

190 For data analysis and presentation purposes, this variable was dichotomised as ‘high-

191 intensity’ and ‘low-intensity’.

192 The seven-day travel diary collected, for each activity of each day: activity type (e.g.,

193 ‘commute to work/study’ or ‘shopping’), mode of transport, access and egress modes of

194 transport (for public transport), origin, destination, departure time and arrival time [35].

195 Daily rainfall data were obtained from the Bureau of Meteorology [36].

 9
196 2.6 Analysis

197 Analysis comprised three main steps: (1) using the collected data to train a predictive

198 transport mode choice model; (2) using this model to forecast the impact of the two

199 intervention scenarios on transport mode choice, physical activity and accessibility; and (3)

200 assessing how the forecast physical activity and accessibility changes are distributed across

201 gender, age and income groups. More detail on each step is provided below.

202 2.6.1 Predictive transport mode choice model

203 For each trip reported in the travel diary, the travel time/distance attributes (i.e., features or

204 independent variables) of four transport mode alternatives (walk, bicycle, public transport,

205 car) were imputed from the reported origin and destination, using ArcGIS Network Analyst

206 software [37] and the Google Directions application programming interface (API) [38].

207 Mode choice (the label/dependent variable) was coded as the reported transport mode for

208 the trip – or, for multimodal trips, the mode with the highest priority in the hierarchy used by

209 the NSW Bureau of Transport Statistics [39].

210 For each choice situation (i.e., trip) t, it was assumed that the observed utility (i.e., the

211 relative attractiveness) of transport mode alternative j to individual n is given by:

 = + ′ , = 1, … , , (1)

212 where is a vector of individual characteristics, trip attributes and contextual factors, ′ is

213 a vector of parameters to be estimated, and are alternative-specific constants.

214 The mixed logit model was chosen because it can account for panel data, i.e., correlation

215 between multiple choice situations (trips) for one individual. Separate models were estimated

216 for commuting and non-commuting trips. The alternative-specific constant for the walk

217 alternative was normalised to zero. For the random parameters, it was found that a triangular

218 distribution – with spread constrained to be half the mean – gave the best behavioural

 10
219 interpretation. Models were estimated by simulated maximum likelihood using NLOGIT

220 version 6 choice modelling software [40].

221 The modelled attributes of bicycle utility included distance, which was broken down into

222 cycleway distance and non-cycleway distance. Thus, if the parameter estimate for non-

223 cycleway distance is more negative than that for cycleway distance, then interventions that

224 allow more of a trip to be undertaken on cycleways will increase the utility of cycling, and the

225 probability of bicycle being chosen for that trip:

 ( , = )
 , = = . (2)
 ( , = )+ ( , = )+ ( , = )+ ( , = )

226 The bicycle utility function also included as trip attributes dummy variables for daily rainfall

227 greater than 3 mm (Rain > 3 mm (Bicycle)) and whether the trip began or ended in the CBD

228 (CBD (Bicycle)). The car utility function included as trip attributes travel time and a dummy

229 variable for whether the trip began or ended in the CBD (CBD (Car)). Only travel time was

230 retained as a trip attribute in the walk and public transport utility functions. Non-statistically

231 significant attributes and individual characteristics were omitted from the final models.

232 2.6.2 Forecasting

233 For all three scenarios, it was assumed that each participant would make the same trips they

234 reported in their seven-day travel diary, with the same origins and destinations, and that the

235 attributes for the walk, public transport and car alternatives would be the same. For the

236 bicycle alternative, the imputed cycleway and non-cycleway distances could differ in each

237 scenario, due to the addition of new cycleways to the network.

238 For each trip in each scenario, the expected values of walking time and cycling time were

239 calculated using a simulation model developed using Microsoft Excel [41] – with the

240 probability of a transport mode being chosen calculated using Equation (2) and daily rainfall

241 simulated at random based on the historical rainfall data. Cycling time was derived from

 11
242 cycling distance, assuming an average cycling speed of 15 km/h (the value used by the UK

243 Department of Transport for inexperienced adults [42]). Differences in annual walking time

244 and annual cycling time between each intervention scenario and Business as Usual were

245 calculated and multiplied by 52.1 to obtain annual forecasts.

246 Following Train [43], de Jong et al. [44] and Geurs and van Wee [16], differences in utility-

247 based accessibility between each intervention scenario (s = 2) and Business as Usual (s

248 = 1) were calculated as:

 =2 =1
 Δ ( ) = (1/α ) ln (∑ ) − (∑ ). (3)

249 The marginal utility of income is, by definition, the negative of the parameter of any

250 monetary variable in a mode choice model, e.g., public transport fare [43]. Because there

251 were no monetary variables in our model, a time variable with a well-established monetary

252 valuation was chosen; namely, the value of travel time savings, which the NSW Government

253 valued at an average of $A15.14/hour [45].

254 2.6.3 Equity analysis

255 The resulting outcome variables of annual walking time (hours), cycling time (hours) and

256 utility-based accessibility changes (A$) were aggregated by participant and averaged for

257 each gender, age and income group (as listed in Table 2). Forecast changes in physical

258 activity for each population group were compared across the two intervention scenarios

259 using slope graphs. Forecast increases in cycling time and utility-based accessibility per

260 person per year per kilometre of new cycleway were compared across population groups for

261 each intervention scenario using grouped bar charts. This analysis was performed using

262 Microsoft Excel [41] and Tableau Desktop [46].

 12
263 3 Results

264 3.1 Descriptive data

265 Table 2 shows the characteristics of the 267 participants. The high proportion of female and

266 older participants is not an issue for equity analyses, because changes in outcome measures

267 are averaged for each population group. Only 204 participants reported their income, so

268 analyses involving income are limited to this subsample. The majority of participants reported

269 at least 150 minutes of moderate to vigorous activity, which the Department of Health [47]

270 considers to be sufficient weekly physical activity for adults aged 18–64. Of the 267

271 participants, 229 reported at least one commuting trip and 259 reported at least one non-

272 commuting trip. Between them, they reported 4,936 trips.

273 Table 2: Sample characteristics

 n Average self- % that are Average (self- Average number
 reported minutes sufficiently reported) body of reported trips
 of physical activity physically active mass index (BMI)a (seven days)
 per week
 Gender
 Female 212 (79%) 557 95 20.9 18.7
 Male 55 (21%) 533 82 26.3 17.7
 Age (years)
 18–29 78 (29%) 598 95 19.1 17.7
 30–44 56 (21%) 577 84 24.8 18.9
 45–55 133 (50%) 515 95 22.3 18.8
 Household income ($A)
 < 80,000 101 (38%) 467 93 22.1 17.7
 >= 80,000 103 (39%) 755 93 24.3 18.9
 Prefer not to say 63 (24%)
 a
 For most people, a BMI of 18.5 to 24.9 is within the healthy weight category.

274

275 3.2 Predictive transport mode choice model results

276 The final transport mode choice models for commuting and non-commuting are presented in

277 Table 3. The models are a significant improvement over constants only ones (p < 0.01) and

278 fit the data well (pseudo-R2 ≥ 0.56).

279 The two bicycle distance parameters have the expected negative sign. As expected,

280 cycleway distance is preferred over non-cycleway distance, and the difference between them

281 in both models is statistically significant (t-statistic ≥ 2.36). Marginal rates of substitution (βNon-

 13
282 cycleway distance / βCycleway distance) indicate that people will cycle for up to 1.4 km on cycleways

283 instead of riding for 1 km on facilities not protected from traffic when commuting, and up to

284 1.6 km when cycling for other purposes.

285 Table 3: Mixed logit models of transport mode choice

 Commuting (1,788 trips) Non-commuting (3,148 trips)
 β 95% confidence t-statistic β 95% confidence t-statistic
 interval interval
 Alternative-specific constants
 Bicycle -4.92 -5.62 to -4.21 -13.66 -2.77 -2.99 to -2.55 -24.86
 Public transport -4.70 -5.55 to -3.85 -10.83 -5.59 -6.02 to -5.16 -25.25
 Car -2.79 -3.41 to -2.16 -8.76 -2.61 -2.81 to -2.41 -25.96
 Random parameters
 (specific alternative)a
 Cycleway distance (Bicycle) -1.89 -2.16 to -1.6 -13.15 -2.07 -2.35 to -1.78 -14.24
 Non-cycleway distance (Bicycle) -2.65 -3 to -2.3 -15.05 -3.35 -3.84 to -2.86 -13.37
 CBD (Bicycle) -1.52 -2.06 to -0.98 -5.52 -2.31 -3.18 to -1.44 -5.19
 Time (Walk) -0.41 -0.45 to -0.37 -22.88 -0.37 -0.39 to -0.36 -49.39
 Time (Public transport) -0.44 -0.46 to -0.41 -40.26 -0.32 -0.34 to -0.29 -25.02
 Time (Car) -1.17 -1.23 to -1.10 -36.13 -0.76 -0.79 to -0.73 -47.47
 CBD (Car) -5.66 -6.18 to -5.13 -21.07 -3.71 -4.21 to -3.2 -14.39
 Non-random parameters
 (specific alternative)
 Non-cycleway distance x Low-intensity (Bicycle) -1.16 -1.38 to -0.92 -9.68 -0.99 -1.25 to -0.74 -7.76
 Rain > 3 mm (Bicycle) -0.79 -1.16 to -0.43 -4.26
 Model fit statistics
 Log likelihood -2478.7 -1928.8
 Chi-square 2887.5 (p < 0.01) 4878.7 (p < 0.01)
 Degrees of freedom 11 12
 Pseudo-R2 0.58 0.56
 Akaike information criterion (AIC) 2091.9 3881.6
 a
 All random parameters have a triangular distribution with spread equal to half the mean.

286

287 Self-reported bicycle rider type has a significant influence on sensitivity to non-cycleway

288 distance (i.e., aversion to cycling in traffic), with respondents identifying as ‘low intensity’

289 having a higher sensitivity.

290 The parameters for household income, education level, gender and age are not statistically

291 significant; therefore, these variables are omitted in the final models.

292 3.3 Physical activity forecasts

293 Figures 2–5 show the forecast hours of physical activity per person per year for the two

294 intervention scenarios, relative to Business as Usual. In the Single Cycleway scenario,

295 average cycling hours per person per year are forecast to increase by 18.9%. The forecast

 14
296 increase for males (19.0%) is almost identical to that for females (18.9%) and marginally

297 greater for the high-income group (20.2% versus 18.6%) and the 45–55 age group (21.8%

298 versus 17.8% for the 18–29 age group and 16.9% for the 30–44 age group).

299

300 Figure 2: Forecast changes in physical activity – aggregated

301

302 Figure 3: Forecast changes in physical activity – grouped by gender

 15
303

304 Figure 4: Forecast changes in physical activity – grouped by age

305

306 Figure 5: Forecast changes in physical activity – grouped by income

307 In the Complete Network scenario, average cycling hours are forecast to more than double

308 (111.7% increase). As with the Single Cycleway scenario, the forecast increase is greatest

309 for the 45–55 age group (119.1%). However, in this scenario, the forecast increase is greater

 16
310 for females than males (115.1% versus 99.5%) and greater for the low-income group than

311 the high-income group (117.2% versus 112.0%).

312 In the Complete Network scenario, the average cycling time for females (53.3 minutes/week)

313 is brought almost to the same level as that for males (53.9 minutes/week). This finding could

314 be partly explained by the transport mode choice model – which indicates people identifying

315 as low-intensity bicycle riders have a greater aversion to riding in amongst traffic – and the

316 high correlation between respondents identifying as low-intensity and female (Χ2 = 26.4, p <

317 0.001). Similarly, the greater physical activity gains for the 45–55 age group in the Complete

318 Network scenario could be due to respondents in this group being more likely to identify as

319 low-intensity bicycle riders (Χ2 = 10.5, p = 0.001) and having a greater aversion to riding in

320 amongst traffic.

321 In both intervention scenarios, increases in cycling time for all groups are partially offset by

322 forecast decreases in walking time – which can be attributed to (a) some of the new cycling

323 trips having previously been made by walking, and (b) those new cycling trips having a

324 shorter travel time than the walking trips they replace, owing to the higher speed of bicycle

325 (assuming destination choice is independent of transport mode choice).

326 However, in both intervention scenarios, there is still an increase in combined walking and

327 cycling time: 2.0% in the Single Cycleway scenario and 6.6% in the Complete Network

328 scenario, albeit with little difference between gender, age and income groups.

 17
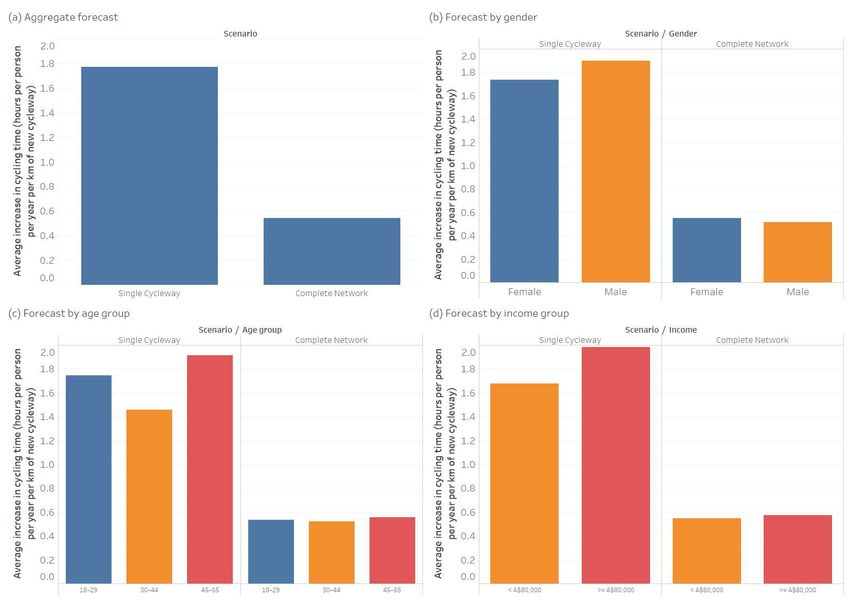
329

330 Figure 6: Forecast increase in cycling hours

331 Figure 6 shows the forecast increase in cycling physical activity per person per year for each

332 kilometre of new cycleway built. In the Single Cycleway Scenario, each new kilometre of

333 cycleway is forecast to result in greater increases in cycling physical activity among males

334 than among females, among the 18–29 and 45–55 age groups, and among the high-income

335 group. In the Complete Network scenario, forecast increases in cycling physical activity are

336 roughly equal for all groups. While the Complete Network scenario is forecast to have a

337 greater overall cycling physical activity benefit than the Single Cycleway scenario, the benefit

338 per new cycleway kilometre is less, indicating diminishing returns as the network grows.

339 3.4 Accessibility forecasts

340 Figure 7 shows the forecast value of accessibility improvements per person per year for each

341 kilometre of new cycleway built. Overall, the Complete Network scenario has a 76% greater

342 accessibility benefit per cycleway kilometre than the Single Cycleway scenario.

 18
343 With the Single Cycleway, the accessibility benefit per cycleway kilometre is 37% greater for

344 males than females, and 50% greater for the high-income group than the low-income group.

345 These differences reduce to 5% and 11% respectively in the Complete Network scenario.

346

347

348 Figure 7: Forecast value of improved accessibility

349 4 Discussion

350 This study explored the potential impacts of new bicycle infrastructure on physical activity

351 and accessibility across gender, age and income groups – for both a small-scale intervention

352 (Single Cycleway) and a large-scale one (Complete Network).

353 The results suggest that: (a) the overall physical activity and accessibility benefits of new

354 cycleways increase when they are joined into a fully-connected network that allows end-to-

355 end, traffic-free cycling between multiple origins and destinations; (b) the accessibility

 19
356 benefits are amplified (due to network effects), but with a diminishing return in the physical

357 activity benefits; and (c) the physical activity and accessibility benefits of new cycleways are

358 much more equally distributed when they are joined into a complete network.

359 The forecasts are consistent with empirical cycling participation data from other high-income

360 countries, which show that, in cities with sparse/disconnected cycling infrastructure, transport

361 cycling is predominantly an option for young and middle-aged adult males. Whereas, in cities

362 with connected, low-stress bicycle networks, people of all genders and ages cycle for

363 everyday transport [48–51].

364 The predictive transport mode choice model we developed for this study reflects previous

365 studies indicating that people, and females in particular, prefer cycling on protected

366 cycleways over cycling in traffic, and will take a less direct/more time-consuming route to do

367 so [52,53]. That people willingly choose a slower route for greater journey utility raises

368 questions about the implied objectives of speed increases and ‘travel time savings’ in much

369 traffic engineering and transport economics practice and research [54].

370 Using our model to forecast the physical activity benefits of two bicycle infrastructure

371 intervention scenarios, we estimate the Single Cycleway would increase average weekly

372 cycling time per person from 25 to 30 minutes, while the Complete Network would more than

373 double it, to 53 minutes. In both scenarios, some walking trips would be replaced by cycling

374 trips (of similar distance and therefore reduced duration), resulting in a reduction in walking

375 time. However, there is still a net increase in average weekly walking and cycling time, from

376 146 to 149 minutes in the Single Cycleway scenario, and to 156 minutes in the Complete

377 Network scenario.

378 For reference, Australia’s Department of Health recommends a minimum of 150 minutes of

379 moderate-intensity physical activity per week [55], which is in accordance with World Health

380 Organization guidelines [56]. While (non-brisk) walking is not considered in the guidelines to

381 be a moderate-intensity activity, cycling is. Thus, in the Complete Network scenario, the

 20
382 proportion of the recommended 150 minutes that could be achieved through transport cycling

383 alone would increase from 17% to 35%.

384 The finding that, in the Complete Network scenario, greater physical activity benefit accrues

385 to females and the 45–55 age group is encouraging from a health equity perspective – given

386 that females and older adults in Australia are more likely to be inactive or only moderately

387 active [57] and therefore have a greater risk of heart disease, type II diabetes and some

388 cancers [58]. However, it should be noted that, in our small sample, 95% of females were

389 already sufficiently active to begin with. Future assessments of this type should attempt to

390 collect data from a more representative sample of the general population.

391 The greater accessibility benefit forecast for the high-income group and the older age group

392 can be partly explained by the greater number of trips reported by these groups (see Table

393 2), and we have assumed that the number of trips each person makes would be the same in

394 all scenarios. In practice, new bicycle infrastructure may enable people in the other groups to

395 make more trips.

396 The disaggregate transport demand forecasting model used for this study enables greater

397 insight into health equity outcomes than would be possible using the type of aggregate

398 demand model typically used by transport authorities [44]. However, like all predictive

399 models, it involves many assumptions and several limitations. We have assumed that

400 changes in a person’s cycling physical activity resulting from an infrastructure intervention

401 may affect only their walking physical activity. However, it is also possible that a person

402 spending more time cycling may replace other types of physical activity, e.g., working out at

403 a gym. A systematic review of studies of the impact of built environment changes on physical

404 activity and active transport [59] found largely positive effects for cycling physical activity, but

405 was inconclusive in relation to overall physical activity.

406 We have also assumed that only transport mode choice and bicycle route choice would be

407 affected by a bicycle infrastructure intervention. However, it is also likely that home location,

 21
408 work location, number of trips, departure time and destination choices would also be

409 affected. E.g., a person switching from driving to cycling for grocery shopping may opt for

410 more frequent trips to a closer supermarket without car parking. Or, a person financially

411 constrained from using public transport may make more trips and visit more distant

412 destinations, given the option to get around by bicycle.

413 The forecast benefits are likely to be conservative because they do not include those

414 accruing to people living outside the City of Sydney LGA nor people aged less than 18 or

415 more than 55 years. Nor do they include potential benefits associated with increased

416 recreational cycling or improved opportunities to access/egress public transport.

417 Data were collected before the introduction of dockless bicycle share and widespread e-bike

418 adoption in Sydney. While riding an e-bike is still a form of physical activity, it is generally

419 lower intensity than riding a conventional bicycle; however, e-bike use is associated with

420 more overall minutes of physical activity because users cycle more frequently and further

421 [60]. Future transport demand models used to predict impacts of bicycle infrastructure could

422 include e-bike as a distinct transport mode alternative, or as an attribute in the bicycle

423 alternative.

424 Despite the limitations and conservative estimates of this study, we have demonstrated how

425 the distribution of physical activity and accessibility benefits of bicycle infrastructure can be

426 assessed. While the findings are specific to inner-city Sydney, where most everyday

427 destinations are within cycling distance, the method could be used anywhere that

428 disaggregate travel demand data linked with personal characteristics (e.g., household travel

429 survey) are available.

430 The study indicates that bicycle infrastructure projects are likely to improve physical activity

431 and accessibility for some population groups more than others, but that the benefits may be

432 more evenly distributed with a fully connected, low-stress bicycle network. Thus, it could be

433 argued that failure to provide a connected, low-stress bicycle network is an example

 22
434 structural discrimination [61], as doing so limits the physical activity and access opportunities

435 of women and other population groups most averse to cycling in traffic.

436 As such, we suggest that planning and assessment of major bicycle projects in future should,

437 where possible, consider the distribution of key benefits (and costs), especially (a) how much

438 physical activity benefit accrues to population groups with higher incidence of inadequate

439 physical activity (these being females and older adults in Australia); and (b) to what extent

440 they could narrow existing disparities between population groups in opportunities to access

441 economic/social opportunities and services.

442 5 Conclusions

443 In a traffic-dominated city such as Sydney, certain population groups, notably women, have

444 less opportunity to access everyday destinations by bicycle – and, therefore, incorporate

445 moderate/high-intensity physical activity into their daily schedules – because of their greater

446 aversion to riding in traffic. This inequity can be addressed with connected bicycle networks

447 that provide opportunities to cycle to multiple destinations in a traffic-free environment.

448 List of abbreviations

449 AIC Akaike information criterion

450 API Application programming interface

451 BMI Body mass index

452 CBD Central business district

453 DALY Disability-adjusted life year

454 LGA Local government area

455 NSW New South Wales

456 UK United Kingdom

 23
457 Ethics approval and consent to participate

458 All procedures were performed in compliance with relevant laws and institutional guidelines

459 Ethics approval for the study was granted by the University of Sydney's Human Research

460 Ethics Committee (Project No. 2012/2411). Informed consent was obtained for

461 experimentation with human participants.

462 Availability of data and materials

463 The datasets used and/or analysed during the current study are available from the

464 corresponding author on reasonable request.

465 Competing interests

466 The authors declare that they have no competing interests.

467 Funding

468 Data collection was supported by the Australian Research Council (grant number

469 LP120200237).

470 Authors' contributions

471 Chris Rissel, Stephen Greaves, Melanie Crane and Christopher Standen contributed to the

472 study design and data collection. Andrew Collins advised on the predictive transport mode

473 choice modelling methodology and results interpretation. Christopher Standen performed all

474 analyses and drafted the manuscript. All other authors contributed to the manuscript.

475 Acknowledgements

476 We would like to thank members of the study advisory committee: Michelle Daley (Heart

477 Foundation of Australia), Ben Cebuliak (Transport for NSW), Fiona Campbell (City of Sydney

478 Council), Lyndall Johnson (Transport for NSW), Peter McCue (Premier’s Council for Active

479 Living) and Rema Hayek (NSW Health).

 24
480 References

481 1. Marmot M. Social determinants of health inequalities. Lancet. 2005;365:1099–104.

482 2. Litman T. Evaluating transportation equity: Guidance for incorporating distributional
483 impacts in transportation planning [Internet]. Victoria, Canada; 2021. Available from:
484 https://www.vtpi.org/equity.pdf

485 3. Feitelson E. Introducing environmental equity dimensions into the sustainable transport
486 discourse: Issues and pitfalls. Transp Res Part D Transp Environ. 2002;7:99–118.

487 4. Mueller N, Rojas-Rueda D, Cole-Hunter T, de Nazelle A, Dons E, Gerike R, et al. Health
488 impact assessment of active transportation: A systematic review. Prev Med (Baltim)
489 [Internet]. Elsevier Inc.; 2015;76:103–14. Available from:
490 http://dx.doi.org/10.1016/j.ypmed.2015.04.010

491 5. Rabl A, de Nazelle A. Benefits of shift from car to active transport. Transp Policy [Internet].
492 Elsevier; 2012;19:121–31. Available from: http://dx.doi.org/10.1016/j.tranpol.2011.09.008

493 6. Garrard J, Rissel C, Bauman A, Giles-Corti B. Cycling and health. In: Buehler R, Pucher J,
494 editors. Cycl Sustain Cities. MIT Press; 2021. p. 35–56.

495 7. Fishman E, Washington S, Haworth N. Bike share: A synthesis of the literature. Transp
496 Rev [Internet]. 2013;33:148–65. Available from:
497 https://www.scopus.com/inward/record.url?eid=2-s2.0-
498 84876309616&partnerID=40&md5=203d07daf1ab0a52bf5d2b472360c54c

499 8. Bauman A, Crane M, Drayton BA, Titze S. The unrealised potential of bike share schemes
500 to influence population physical activity levels – A narrative review. Prev Med (Baltim).
501 Academic Press Inc.; 2017;103:S7–14.

502 9. Lee RJ, Sener IN, Jones SN. Understanding the role of equity in active transportation
503 planning in the United States. Transp Rev [Internet]. Taylor & Francis; 2017;37:211–26.
504 Available from: http://dx.doi.org/10.1080/01441647.2016.1239660

505 10. Cook KS, Hegtvedt KA. Distributive justice, equity, and equality. Annu Rev Sociol.
506 1983;9:217–41.

507 11. de Hartog JJ, Boogaard H, Nijland H, Hoek G. Do the health benefits of cycling outweigh
508 the risks? Environ Health Perspect. 2010;118:1109–16.

509 12. Schepers P, Fishman E, Beelen R, Heinen E, Wijnen W, Parkin J. The mortality impact of

 25
510 bicycle paths and lanes related to physical activity, air pollution exposure and road safety. J
511 Transp Heal [Internet]. Elsevier; 2015;2:460–73. Available from:
512 http://linkinghub.elsevier.com/retrieve/pii/S2214140515006842

513 13. Wu Y, Rowangould D, London JK, Karner A. Modeling health equity in active
514 transportation planning. Transp Res Part D Transp Environ. 2019;67.

515 14. Leigh-Hunt N, Bagguley D, Bash K, Turner V, Turnbull S, Valtorta N, et al. An overview of
516 systematic reviews on the public health consequences of social isolation and loneliness.
517 Public Health [Internet]. Elsevier Ltd; 2017;152:157–71. Available from:
518 https://doi.org/10.1016/j.puhe.2017.07.035

519 15. Rosano A, Loha CA, Falvo R, Van Der Zee J, Ricciardi W, Guasticchi G, et al. The
520 relationship between avoidable hospitalization and accessibility to primary care: A systematic
521 review. Eur J Public Health. 2013;23:356–60.

522 16. Geurs KT, van Wee B. Accessibility evaluation of land-use and transport strategies:
523 Review and research directions. J Transp Geogr [Internet]. 2004 [cited 2013 Oct 21];12:127–
524 40. Available from: http://linkinghub.elsevier.com/retrieve/pii/S0966692303000607

525 17. Kent M, Karner A. Prioritizing low-stress and equitable bicycle networks using
526 neighborhood-based accessibility measures. Int J Sustain Transp [Internet]. 2019;13:100–10.
527 Available from: https://www.tandfonline.com/action/journalInformation?journalCode=ujst20

528 18. Wade M. How riding to work is becoming a pursuit of the wealthy. Sydney Morning Her.
529 Sydney, Australia; 2017 Dec;

530 19. Australian Bureau of Statistics. Method of Travel to Work (MTW15P) by Age (AGE10P)
531 [Census TableBuilder]. 2016.

532 20. Australian Bureau of Statistics. Method of Travel to Work (MTW15P) by Sex (SEXP)
533 [Census TableBuilder]. 2016.

534 21. Australian Bureau of Statistics. Method of Travel to Work (MTW15P) by Total Personal
535 Income (INCP) [Census TableBuilder]. 2016.

536 22. Beavis MJ, Moodie M. Incidental physical activity in Melbourne, Australia: Health and
537 economic impacts of mode of transport and suburban location. Heal Promot J Aust.
538 2014;25:174–81.

539 23. Pucher J, Garrard J, Greaves S. Cycling down under: A comparative analysis of bicycling
540 trends and policies in Sydney and Melbourne. J Transp Geogr. Elsevier Ltd; 2011;19:332–

 26
541 45.

542 24. Rissel C, Wen LM. The possible effect on frequency of cycling if mandatory bicycle
543 helmet legislation was repealed in Sydney, Australia: A cross sectional survey. Heal Promot
544 J Aust [Internet]. 2011;22:178–83. Available from:
545 http://www.ncbi.nlm.nih.gov/pubmed/22730946

546 25. Hogg R, Quilter J. Policing mandatory bicycle helmet laws in NSW: Fair cop or unjust
547 gouge? Altern Law J. 2020;45:270–5.

548 26. Quilter J, Hogg RG. Over-the-top policing of bike helmet laws targets vulnerable riders
549 [Internet]. 2019. Report No.: 3983. Available from: https://ro.uow.edu.au/lhapapers/3983

550 27. Garrard J, Greaves S, Ellison A. Cycling injuries in Australia: Road safety’s blind spot? J
551 Australas Coll Road Saf. 2010;21:37–43.

552 28. Poulos RG, Hatfield J, Rissel C, Flack LK, Murphy S, Grzebieta R, et al. An exposure
553 based study of crash and injury rates in a cohort of transport and recreational cyclists in New
554 South Wales, Australia. Accid Anal Prev. 2015;78:29–38.

555 29. Keoghan S. “The perfect storm”: Demand for e-bikes surges in Sydney amid pandemic.
556 Sydney Morning Her [Internet]. Sydney, Australia; 2020 May 5; Available from:
557 https://www.smh.com.au/national/nsw/the-perfect-storm-demand-for-e-bikes-surges-in-
558 sydney-amid-pandemic-20200501-p54p1t.html

559 30. Weatherzone. Sydney Climate [Internet]. 2021 [cited 2021 Jan 4]. Available from:
560 http://www.weatherzone.com.au/climate/station.jsp

561 31. Australian Bureau of Statistics. Method of Travel to Work (MTW15P) by LGA (UR) and
562 Sex (SEXP) [Census TableBuilder]. 2016.

563 32. City of Sydney. Cycling Strategy and Action Plan [Internet]. Sydney, Australia; 2018.
564 Available from: https://www.cityofsydney.nsw.gov.au/strategies-action-plans/cycling-strategy-
565 and-action-plan

566 33. Rissel C, Greaves S, Wen LMLM, Capon A, Crane M, Standen C. Evaluating the
567 transport, health and economic impacts of new urban cycling infrastructure in Sydney,
568 Australia: Protocol paper. BMC Public Health [Internet]. BMC Public Health; 2013 [cited 2013
569 Nov 22];13:1–8. Available from: http://www.ncbi.nlm.nih.gov/pubmed/24131667

570 34. Australian Institute of Health and Welfare. The Active Australia Survey: A Guide and
571 Manual for Implementation, Analysis and Reporting. Canberra, Australia; 2003.

 27
572 35. Greaves S, Ellison AB, Ellison RB, Standen C. Development of online diary for
573 longitudinal travel and activity surveys. Proc 93rd Annu Meet Transp Res Board [Internet].
574 Washington, D.C.; 2014. Available from: http://amonline.trb.org/trb-59976-2014-1.2467145/t-
575 1112-1.2488871/378-1.2490420/14-4834-1.2490446/14-4834-1.2490449?qr=1

576 36. Bureau of Meteorology. Climate Data Online [Internet]. 2017 [cited 2017 Jan 10].
577 Available from: http://www.bom.gov.au/climate/data/

578 37. ESRI. ArcGIS Network Analyst, computer software [Internet]. [cited 2021 May 7].
579 Available from: https://www.esri.com/en-us/arcgis/products/arcgis-network-analyst/overview

580 38. Google Inc. The Google Maps Directions API [Internet]. 2021 [cited 2021 May 7].
581 Available from: https://developers.google.com/maps/documentation/directions/intro

582 39. Bureau of Transport Statistics. 2011 Journey to Work User Guide [Internet]. Sydney,
583 Australia; 2014. Available from: http://www.bts.nsw.gov.au/ArticleDocuments/84/TR2013-
584 12_2011_JTW_User_Guide_v1_3.pdf.aspx

585 40. Econometric Software Inc. NLOGIT6, computer software [Internet]. 2016. Available from:
586 http://www.limdep.com/

587 41. Microsoft. Excel, computer software [Internet]. 2021. Available from:
588 https://www.microsoft.com/en-au/microsoft-365/p/excel

589 42. Parkin J, Rotheram J. Design speeds and acceleration characteristics of bicycle traffic for
590 use in planning, design and appraisal. Transp Policy [Internet]. Elsevier; 2010;17:335–41.
591 Available from: http://dx.doi.org/10.1016/j.tranpol.2010.03.001

592 43. Train KE. Discrete Choice Methods with Simulation. 2nd ed. Cambridge, UK: Cambridge
593 University Press; 2009.

594 44. de Jong G, Daly A, Pieters M, van der Hoorn T. The logsum as an evaluation measure:
595 Review of the literature and new results. Transp Res Part A Policy Pract [Internet]. 2007
596 [cited 2014 Jan 13];41:874–89. Available from:
597 http://linkinghub.elsevier.com/retrieve/pii/S0965856407000316

598 45. Transport for NSW. Principles and Guidelines for Economic Appraisal of Transport
599 Investment and Initiatives [Internet]. Sydney, Australia; 2013. Available from:
600 https://www.transport.nsw.gov.au/newsroom-and-events/reports-and-publications/principles-
601 and-guidelines-economic-appraisal-of

602 46. Tableau Software. Tableau Desktop, computer software [Internet]. Seattle, WA, US;

 28
603 2020. Available from: https://www.tableau.com/

604 47. Department of Health. Physical Activity and Exercise Guidelines for all Australians
605 [Internet]. 2021 [cited 2021 May 7]. Available from: https://www.health.gov.au/health-
606 topics/physical-activity-and-exercise/physical-activity-and-exercise-guidelines-for-all-
607 australians

608 48. Goel R, Goodman A, Aldred R, Nakamura R, Martin L, Garcia T, et al. Cycling behaviour
609 in 17 countries across 6 continents: Levels of cycling, who cycles, for what purpose, and how
610 far? 2021; Available from:
611 https://www.tandfonline.com/action/journalInformation?journalCode=ttrv20

612 49. Garrard J, Handy S, Dill J. Women and cycling. In: Pucher J, Buehler R, editors. City
613 Cycl. Cambridge, MA: The MIT Press; 2012. p. 211–34.

614 50. Garrard J, Conroy J, Winters M, Pucher J, Rissel C. Older adults and cycling. In: Buehler
615 R, Pucher J, editors. Cycl Sustain Cities. Cambridge, MA: MIT Press; 2021.

616 51. Garrard J. Women and cycling: Addressing the gender gap. In: Buehler R, Pucher J,
617 editors. Cycl Sustain Cities. Cambridge, MA: MIT Press; 2021.

618 52. Wardman M, Tight M, Page M. Factors influencing the propensity to cycle to work.
619 Transp Res Part A Policy Pract [Internet]. 2007 [cited 2013 May 24];41:339–50. Available
620 from: http://linkinghub.elsevier.com/retrieve/pii/S0965856406001212

621 53. Börjesson M, Eliasson J. The value of time and external benefits in bicycle appraisal.
622 Transp Res Part A Policy Pract [Internet]. 2012 [cited 2014 May 12];46:673–83. Available
623 from: http://linkinghub.elsevier.com/retrieve/pii/S0965856412000079

624 54. Tranter P, Tolley R. Slow Cities: Conquering our Speed Addiction for Health and
625 Sustainability [Internet]. Elsevier Science; 2020. Available from:
626 https://books.google.com.au/books?id=2pLhDwAAQBAJ

627 55. Department of Health. Australia’s Physical Activity and Sedentary Behaviour Guidelines
628 and the Australian 24-hour Movement Guidelines. 2019.

629 56. Bull FC, Al-Ansari SS, Biddle S, Borodulin K, Buman MP, Cardon G, et al. World Health
630 Organization 2020 guidelines on physical activity and sedentary behaviour [Internet]. Br. J.
631 Sports Med. 2020 [cited 2021 May 6]. p. 1451–62. Available from: http://bjsm.bmj.com/

632 57. Australian Bureau of Statistics. 4324.0.55.001 - Microdata: National Health Survey, 2017-
633 18. 2019.

 29
634 58. Nazzari H, Isserow SH, Heilbron B, Chb MB, McKinney J, Lithwick DJ, et al. The health
635 benefits of physical activity and cardiorespiratory fitness. B C Med J. 2016;58:131–7.

636 59. Stappers NEH, Van Kann DHH, Ettema D, De Vries NK, Kremers SPJ. The effect of
637 infrastructural changes in the built environment on physical activity, active transportation and
638 sedentary behavior – A systematic review. Heal Place [Internet]. Elsevier Ltd; 2018;53:135–
639 49. Available from: https://doi.org/10.1016/j.healthplace.2018.08.002

640 60. Sundfør HB, Fyhri A. A push for public health: The effect of e-bikes on physical activity
641 levels. BMC Public Health. BMC Public Health; 2017;17:1–12.

642 61. Braveman P, Arkin E, Orleans T, Proctor D, Plough A. What is Health Equity? And What
643 Difference Does a Definition Make? [Internet]. Princeton, NJ; 2017. Available from:
644 https://www.rwjf.org/en/library/research/2017/05/what-is-health-equity-.html

645

 30
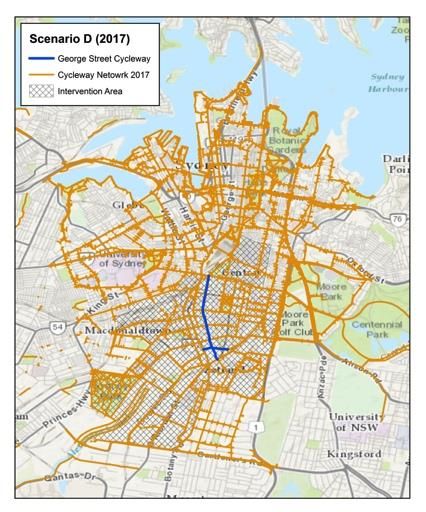
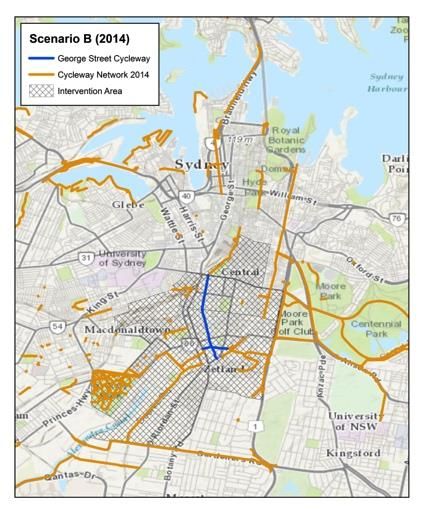
Figures

Figure 1

Scenarios. Note: The designations employed and the presentation of the material on this map do not
imply the expression of any opinion whatsoever on the part of Research Square concerning the legal
status of any country, territory, city or area or of its authorities, or concerning the delimitation of its
frontiers or boundaries. This map has been provided by the authors.

Figure 2
Forecast changes in physical activity – aggregated

Figure 3

Forecast changes in physical activity – grouped by gender

Figure 4
Forecast changes in physical activity – grouped by age

Figure 5

Forecast changes in physical activity – grouped by income
You can also read