Cold Regions Science and Technology - NTNU Open
←
→
Page content transcription
If your browser does not render page correctly, please read the page content below
Cold Regions Science and Technology 187 (2021) 103282
Contents lists available at ScienceDirect
Cold Regions Science and Technology
journal homepage: www.elsevier.com/locate/coldregions
Bicycle rolling resistance under winter conditions
Mathis Dahl Fenre *, Alex Klein-Paste
Department of Civil and Environmental Engineering, Norwegian University of Science and Technology (NTNU), 7491 Trondheim, Norway
A R T I C L E I N F O A B S T R A C T
Keywords: In many cold regions of the world, the percentage of trips made by bicycle drops drastically during the winter
Winter cycling months. To facilitate increased bicycle usage during the winter, we studied the effect of typical winter conditions
Bicycle rolling resistance on bicycle rolling resistance and cycling comfort. An instrumented bicycle was used to measure bicycle rolling
Winter maintenance
resistance under various winter conditions on streets and cycleways in Trondheim, Norway. The rolling resis
Cycling comfort
tance was estimated by first measuring propulsive and resistive forces on a moving bicycle and then solving the
force equilibrium. Simultaneously, the test cyclist subjectively evaluated the level of cycling comfort, and video
recordings were made to document the conditions. Data were collected on 103 road sections, including three
levels of service (maintenance standards). The results showed that rolling resistance increased significantly in
accordance with increasing loose snow depths. Dry and wet snow leads to a higher rolling resistance than slush
does at the same depth. Similarly, increased rolling resistance correlates with reduced cycling comfort. Rolling
resistance coefficients (Crr) higher than 0.025 noticeably reduce cycling comfort. The road sections that were
maintained with a bare road winter maintenance strategy (using anti-icing chemicals, brushing and/or plowing)
provided significantly lower rolling resistance and higher levels of cycling comfort than the sections maintained
with a winter road strategy (only plowing and sanding). This study shows that rolling resistance measurements
may be used to estimate winter cycling comfort indirectly. Therefore, rolling resistance may be useful for
improving winter maintenance operations and controls. Better winter maintenance is essential for increasing
bicycle usage in the winter.
1. Introduction share rate drops to only 2% in December, January, and February, falling
from 7% in May through August (Ellis et al., 2016). Cold temperatures,
As a means of transportation in urban areas, cycling has received increased precipitation, reduced visibility, and inclement road condi
increased attention for its benefits in terms of public health and eco tions have been identified as “barriers” to winter cycling (Bergström and
nomics (Fishman et al., 2015; Gössling et al., 2019; Teschke et al., 2012). Magnusson, 2003; Brandenburg et al., 2007; Godavarthy and Rahim
A higher rate of cycling also reduces the use of private cars, thereby Taleqani, 2017; Nahal and Mitra, 2018; Spencer et al., 2013). Thus, in
reducing pollution and congestion (Gössling et al., 2016; Koska and order to increase the bicycle share rate, the number of barriers to winter
Rudolph, 2016). Cycling also shows excellent potential as pandemic- cycling must be reduced.
resilient transportation (De Vos, 2020; Litman, 2020). During the winter, inclement road conditions are usually caused by
Due to cycling’s acknowledged benefits, several governments are snow and ice covering the road surface. The presence of snow and ice on
facilitating increased bicycle usage, especially in urban areas (BMVI, the surface leads to reduced friction. Rekilä and Klein-Paste (2016)
2012; NMoT, 2016-2017). In Norway, the official goal is to increase the measured bicycle braking friction under winter conditions. Reduced
nationwide bicycle share rate from its current level of 5% to 8% by 2023. friction leads to reduced safety for cyclists (Niska, 2010; Sørensen and
The term “bicycle share” is the percentage of total trips made by bicycle, Mosslemi, 2009). Moreover, snow and ice on the roads often lead to
and the largest metropolitan areas’ goal is to reach a bicycle share rate of bumps, ruts and other irregularities, which induces vibrations for bi
20% (Lunke and Grue, 2018). One challenge to achieving these goals is cycles and cyclists alike. Cyclists tend to avoid roads with irregular
cold winters, which have led to a significant drop in the bicycle share surfaces because these vibrations make the cycling experience less
rate (Flynn et al., 2012; Nahal and Mitra, 2018). In Norway, the bicycle comfortable (Bíl et al., 2015).
* Corresponding author.
E-mail addresses: mathis.fenre@ntnu.no (M.D. Fenre), alex.klein-paste@ntnu.no (A. Klein-Paste).
https://doi.org/10.1016/j.coldregions.2021.103282
Received 3 November 2020; Received in revised form 11 March 2021; Accepted 28 March 2021
Available online 30 March 2021
0165-232X/© 2021 The Author(s). Published by Elsevier B.V. This is an open access article under the CC BY license (http://creativecommons.org/licenses/by/4.0/).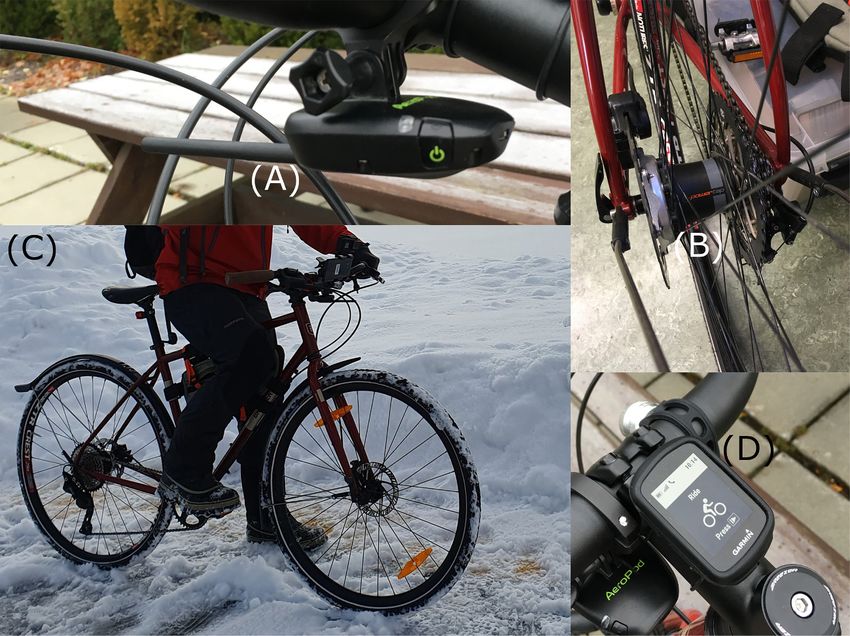
M.D. Fenre and A. Klein-Paste Cold Regions Science and Technology 187 (2021) 103282
Fig. 1. Schematic of the forces considered in the rolling resistance measurement method.
Another interesting parameter in cycling is rolling resistance, which The effect of snow on a bicycle’s rolling resistance depends on its
acts in opposition to the cycling direction. Rolling resistance is a com depth, density and mechanical properties in addition to vehicle speed
plex phenomenon that occurs because of deformations in the rolling tire (Lidström, 1979). The most significant properties affecting snow’s me
or the traction surface or because of contaminations between the tire chanical characteristics are grain size and formation, density, tempera
and the road surface (Mitschke and Wallentowitz, 2004). These de ture and liquid water content (Pytka, 2010). Further, variations in wind,
formations or contaminations cause the vertical reaction of the ground, temperature, rain, time (sintering) and humidity continuously transform
acting on the wheel, to offset in front of the wheel’s center. This vertical snow’s characteristics. It is therefore challenging to determine the
reaction offset creates a rolling resistance moment acting against the characteristics of snow at any given time. Hence, models for predicting
wheel’s driving torque. However, for mathematical descriptions, rolling rolling resistance are often simplified and based solely on parameters
resistance is commonly expressed as a force (Andersen et al., 2015; that are easily measured, such as snow depth and density, rather than
Volskaia et al., 2018). The rolling resistance force is equal to the force the mechanical properties of the snow layer itself (Shoop, 2001). Be
needed to push (or tow) a wheel (or a vehicle) forward at a constant sides, existing models of rolling resistance in snow have been restricted
speed on a level surface, with zero air resistance. A higher level of rolling to unprocessed, dry snow. On actual winter roads, the snow is usually
resistance may extend the duration of cyclists’ regular routes, increase processed in some way, having been compressed or made uneven by
their energy expenditure, making them sweat more and/or cause them traffic, partially melted and re-frozen, mixed with dirt or anti-icing
to have a less comfortable ride. The presence of snow and ice on the chemicals, or a combination of these factors. Models for predicting
surface leads to increased rolling resistance. Depending on the liquid rolling resistance under winter conditions are therefore not well-suited
water content of the snow and contact pressure between the snow and to obtaining useful information for winter cyclists. So in order to un
tire, increased rolling resistance occurs when the snow is either com derstand the real effect of snow and ice on bicycle rolling resistance,
pressed under the tire or squeezed to the side of the tire (Lidström, 1979; field measurements must be performed under actual winter conditions.
Shoop et al., 2006; van Es, 1999). The presence of bumps, ruts and ir Field measurements of bicycle rolling resistance have previously been
regularities on the road surface also leads to increased rolling resistance performed by measuring deceleration over a stretch (coast-down
(Andersen et al., 2015; Descornet, 1990). testing) (Steyn and Warnich, 2014; Tengattini and Bigazzi, 2018), and
Fig. 2. Airspeed, air density, and road slope sensor (A) Pedaling power sensor (B) Instrumented bicycle under winter conditions (C) GPS tracking device (D).
2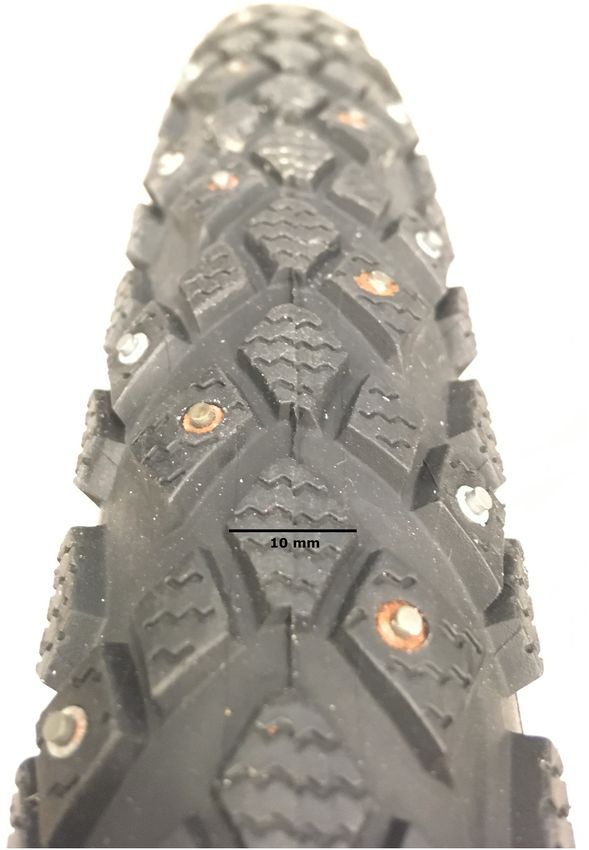
M.D. Fenre and A. Klein-Paste Cold Regions Science and Technology 187 (2021) 103282
conditions, we documented the maintenance standard on the investi
gated roads.
This article wants to answer the following research questions: (1)
How do typical winter conditions affect bicycle rolling resistance? (2)
Are there any correlations between bicycle rolling resistance and cy
clists’ perceptions of steerability, unevenness, and general cycling
comfort? (3) What would be a realistic maximum allowable bicycle
rolling resistance level? (4) How do different winter maintenance stra
tegies affect bicycle rolling resistance?
2. Method
Rolling resistance was estimated using the method described and
tested in Fenre and Klein-Paste (2021), a method which uses an
instrumented bicycle equipped with sensors to measure pedaling power
and pedaling cadence (Powertap G3 hub), road slope and airspeed
(Velocomp Aeropod), and bicycle speed and acceleration (Garmin Edge
130) to estimate the rolling resistance rate. This rate was found by using
the force equilibrium on the moving bicycle:
Fp = Fr + Fg + Fa + Fi + Ff + Fb # (1)
where Fp represents the propulsion force, Fr is the rolling resistance force
and Fg is the component of the gravity force acting in the opposite di
rection of the movement of the bicycle. Fa is the air drag force, Fi is the
inertia force due to acceleration, Ff is the internal friction force (mainly
caused by friction in the drive chain, and, to some extent, the wheel
bearings) and Fb is the braking force. Fig. 1 shows a schematic of the
forces considered.
The propulsion force was measured between the rear wheel
sprockets and rear wheel hub; thus, internal friction resistance from the
drivetrain did not affect the force equilibrium. Because the bicycle was
new, the drivetrain friction loss was assumed to be negligible, and the
resulting internal friction force was neglected in the force equilibrium.
Measurements were only included when the pedaling cadence was
higher than zero. It was assumed that braking only occurs either while
Fig. 3. Tread of the tire used in the experiments (Schwable Marathon the cyclist is not pedaling or the pedaling cadence is zero. The braking
Winter Plus). force was therefore set at zero in the force equilibrium. By removing the
internal friction force and braking force, the force equilibrium equating
by measuring pedaling power versus speed relationship (Fenre and the rolling resistance force is shown here:
Klein-Paste, 2021; Lim et al., 2011; Meyer et al., 2016). However, none ( )
of these tests have been performed under actual winter conditions. Fr = Fp − Fg + Fa + Fi # (2)
The winter conditions cyclists encounter depends on weather events The component of the gravity force acting in the opposite direction of
and performed winter maintenance operations. The Norwegian Public the movement of the bicycle was calculated as a function of road slope, s,
Roads Administration (NPRA) specifies two standards for winter main the combined mass of the bicycle and rider, m, and the gravitational
tenance of bicycle roads: GsA and GsB. GsA is a bare road standard that acceleration, g:
allows the use of anti-icing chemicals. GsB is a winter road standard ( ( s ))
comprised of strict performance requirements with respect to minimum Fg = mg*sin arctan # (3)
100
friction level, loose snow depth, unevenness and crossfall, which
generally does not allow the use of anti-icing chemicals (NPRA, 2014). The air drag force was calculated as a function of air density, ρair, the
While GsA and GsB are usually assigned to high-priority cycleways, air-drag coefficient, Cd, frontal area, A, and airspeed, vair:
winter maintenance is constricted by the local municipality’s guidelines 1
on other less prioritized cycleways. Trondheim municipality’s guide Fa = ρair *Cd A(vair )*vair 2 # (4)
2
lines for winter maintenance on cycleways specifies the maximum
amount of loose snow depth allowed before maintenance actions are where CdA was determined in a wind tunnel test at NTNU. The CdA value
taken, as well as general instructions for sanding and using anti-icing was also confirmed in a separate outdoor test.
chemicals (Trondheim Municipality, 2020). This municipal standard The inertia force was calculated as a function of the combined mass
(MUN) does not have performance requirements and is a significantly of the bicycle and cyclist, m, the rotational inertia of the front (Iwf) and
“cheaper” standard than the GsB. In practice, this means that more snow rear (Iwr) bicycle wheel, the wheel radius, rw, and the rate of change in
may be present before an area is cleared. bicycle velocity, vb, i.e., the bicycle acceleration:
In this study, we measured rolling resistance under various winter ( )
Iwf + Iwr dvb
conditions. Appreciating the complexity of factors determining whether Fi = m + 2
* # (5)
a person is likely to use a bicycle for transportation or not, we simul rw dt
taneously recorded the cyclists’ subjective feelings of unevenness, Rolling resistance is highly dependent on the wheel load (Baldissera
steerability and overall cycling comfort. Secondly, since a local munic and Delprete, 2016; Clark, 1978; Gent and Walter, 2006; Gillespie,
ipality’s chosen maintenance standard determines winter cycling 1992). Due to this fact, it is commonly represented as the ratio between
3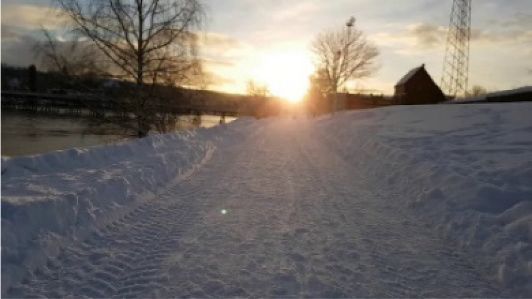
M.D. Fenre and A. Klein-Paste Cold Regions Science and Technology 187 (2021) 103282
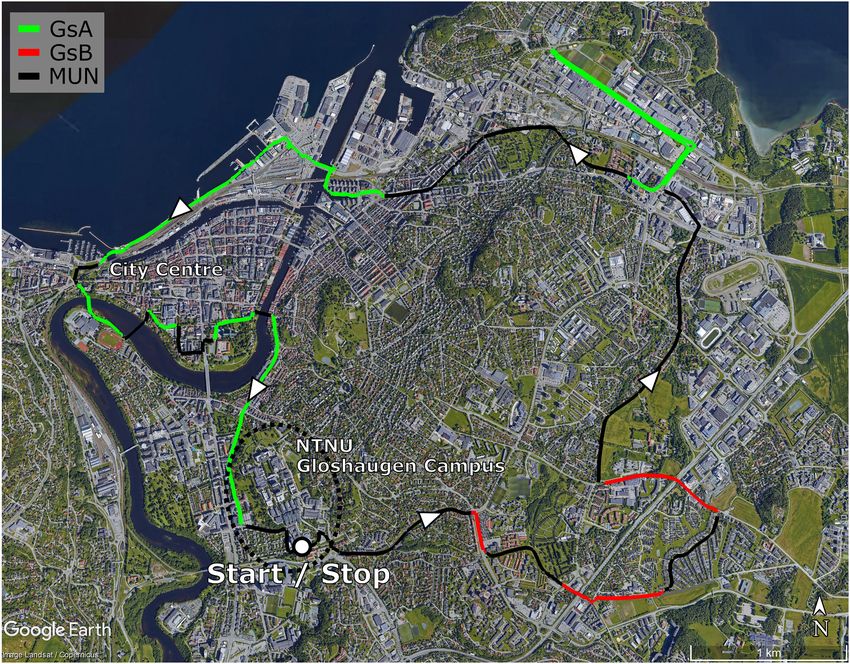
Fig. 4. Map of the test route indicating the locations of the different winter maintenance standards.
Table 1 standard error of the mean (SEM) of the estimated Crr. Upon completion
Climatic details from the field measurements. of verification testing on bare asphalt, the method precision was found
Day Date Time of day Tair (◦ C) Precipitation to be ±0.005, ± 0.002, and ± 0.001 for sample sizes of 9, 55, and 220,
respectively. The Crr on hard, smooth pavements for bicycles with high-
During 24 h During 24 h prior to
test prior to test test (mm, quality racing tires may be as low as 0.002 and as high as 0.008 for
test Min Cumulative) utility tires at low pressure (Wilson et al., 2004). On soft ground, such as
- Max sand or snow, the Crr is 10–100 times higher (Michelin, 2003). A Crr
(Mean) measurement precision of ±0.003 (24 samples) should therefore be
Wed Jan 08:39–10:01 0.1 − 1.2 to Rain 5.9 (rain) adequate to differentiate the rolling resistance under different types of
02, 3.8 (0.9) winter conditions.
2019
The measurement frequency is 1 Hz. A handlebar-mounted smart
Mon Jan 07:58–09:05 − 3.7 − 6.9 to – –
28, − 3.7 phone makes video recordings of the test rides and tracks the route via
2019 (− 5.6) GPS. Before any field measurements were collected, information about
Mon Feb 08:03–09:28 − 1.8 − 3.6 to Snow 4.2 (snow) air temperatures and precipitation levels over the previous 24 h was
11, 1.4 recorded from the Norwegian Meteorological Institute (NMI, 2019).
2019 (− 0.7)
Wed Feb 10:33–11:55 4.4 − 0.1 to Rain 9.0 (snow) +
The test bicycle was a Breezer Radar Café, equipped with 29”
13, 4.9 (2.2) 7.3 (rain) Schwalbe Marathon Winter Plus, 42 mm wide, studded winter tires. Fig. 3
2019 shows a photo of the tire tread. The tire inflation pressure was set at 2
bar (200 kPa) and checked at the beginning of every test round. This was
the lowest recommended level of inflation pressure for this tire. The
the rolling resistance force and wheel load, or the coefficient of rolling
maximum recommended pressure was 5 bar. The low pressure was
resistance, Crr:
chosen to increase the contact area and reduce contact pressure and
Fr deformation of soft ground, such as compacted snow. This would not
Crr = # (6)
FN only reduce rolling resistance on soft surfaces but also increase it on hard
surfaces due to increased tire deformations. In very soft snow conditions,
Fig. 2 shows the bicycle with instruments and measurement sensors.
such as slush, the tire will disperse the snow to the sides and gain contact
The method estimates the Crr on a given road surface based on
with the asphalt surface regardless of the inflation pressure. In this case,
measurements of 4 variables (propulsion force, road slope, airspeed and
an increased inflation pressure will, in addition to less tire deformation,
bicycle speed). It is therefore necessary to determine an average over a
give the tire a narrower contact area, leading to less snow dispersion and
stretch of road in order to obtain a precise estimation of the Crr.
lower rolling resistance. All measurements were conducted using the
Increased sample sizes improve the method’s precision, i.e., the
same bicycle and cyclist. The test cyclist was a 28-year-old male, active
4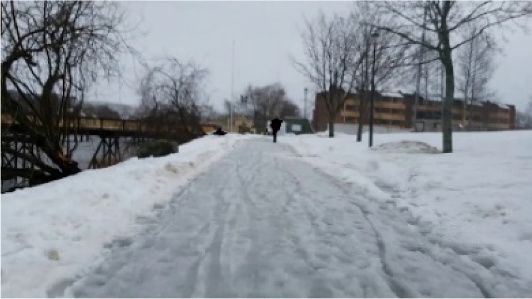
M.D. Fenre and A. Klein-Paste                                                                                                 Cold Regions Science and Technology 187 (2021) 103282

Table 2
Photos, description and location of typical winter cycling conditions.
  Classification                Description                                                  Typical areas                           Example photo

  Wet asphalt                   Moist or wet asphalt. In generally good condition with       High-priority cycleways and roads.
                                few cracks and potholes.

  Dry asphalt                   Dry asphalt in mostly good condition.                        High-priority cycleways and roads.
                                                                                             The asphalt usually dried during
                                                                                             long periods of cold and dry weather.

  Compact snow                  Sections with a solid layer of compact snow. Seemingly       Typically found in high-priority
                                compacted by snowplows, cars, bicycles, and                  cycleways or side streets outside the
                                pedestrians. Probably also affected by thaw-freeze           city center.
                                cycles.

  Slush (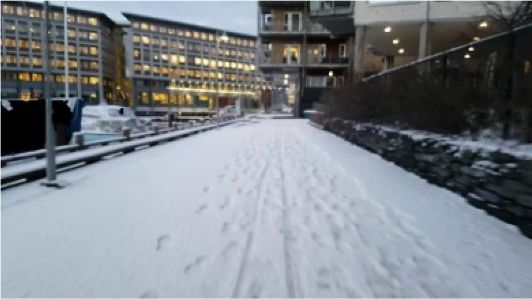
M.D. Fenre and A. Klein-Paste Cold Regions Science and Technology 187 (2021) 103282
Table 3 maintenance standards along the route, but not whether maintenance
Detailed description of the scale used to evaluate unevenness, steerability and was performed as planned on the test days. The length of the test route
cycling comfort. was 20.3 km, and the route was traveled on four separate days. The
Score Unevenness Steerability Cycling comfort sections of the test route were always cycled in the same sequence. Fig. 4
5 Smooth, hard, road Good steerability; Very good cycling
shows a map of the test route. The measurements were taken under cold,
surface. comparable to smooth comfort. Comparable stable winter conditions both during and after a snowfall, and under soft
pavement. to smooth pavement. conditions when the snow melted after a cold period. Detailed infor
4 Small, visible Slightly reduced Visible snow, ice or mation about the climatic conditions during field measurements is
irregularities in the steerability. Requires gravel on the road, but
shown in Table 1.
road surface that are more attention but still feels almost like a bare
barely felt when easy to steer. surface. Each test route was split into 38 or 39 sections on which the road
cycling. conditions were reasonably constant. The surface conditions on each
3 Uneven surface with Medium steerability. Visible and tangible stretch were visually determined according to the classification pro
noticeable vertical Some sudden steering snow, ice or gravel on vided in Table 2. Because the uncertainty of the estimated Crr decreases
vibrations. deflections that need to the road, but no
be counteracted. noticeable reduction
with larger sample sizes, sections containing less than 24 samples were
in cycling efficiency. removed from the results. When there is a sample size of 24 observations
2 Very uneven surface; Challenging to keep Speed is clearly on a smooth, bare asphalt road, the estimated Crr has a precision
unpleasantly large going straight because reduced, and cycling (standard error of the mean (SEM)) close to ±0.003 (Fenre and Klein-
vertical vibrations of snow or ice tracks. is a lot more
Paste, 2021). During the rolling resistance measurements, the uneven
Front wheel may slide physically
when trying to change demanding. ness, steerability and cycling comfort were rated subjectively by the
direction. cyclist on a scale from 1 to 5, where 5 indicated optimal cycling con
1 Severe unevenness; Very difficult to keep Particularly ditions and 1 very poor conditions. Table 3 provides a detailed
challenging to keep the bicycle steady. challenging to keep description of this scale.
cycling Constantly balancing the bicycle stable as
Video recordings of each test ride were analyzed to separate, classify
and turning from side the speed is very low.
to side to prevent and judge the sections correctly. The same cyclist evaluated the un
falling. evenness, steerability and cycling comfort for all test rides. The purpose
of evaluating the cycling comfort was to provide a more detailed
description of the road conditions and an indication of the cycling ex
cyclist. To ensure that the CdA and combined bicycle/rider mass were
perience’s overall quality.
kept constant, the same outer clothes were always worn, and the cyclist
tried to sit in the same position on the bicycle during each ride.
3. Results
2.1. Field measurements Data were collected on a total of 103 road sections, the length of
which varied between 80 m and 1520 m. Fig. 5 presents the measured
The bicycle rolling resistance measurements were performed using rolling resistance on the ten different types of surface conditions. The
an instrumented bicycle during the winter of 2019 in Trondheim, Nor whiskers in the boxplot mark the center 90% of the measurements.
way. It was desirable to measure rolling resistance on as many different Measurements outside this range are identified as outliers and have not
types of winter conditions as possible; therefore, the test route included been included in the plot. The box contains the interquartile range
sections that were maintained through applying three different main (IQR), and the vertical lines illustrate the first 25%, 50% (median) and
tenance standards: GsA, GsB, and MUN. The test cyclist was aware of the
Fig. 5. Distribution of the measured Crr for each road condition group.
6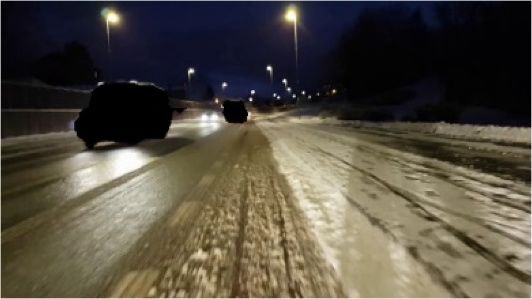
M.D. Fenre and A. Klein-Paste Cold Regions Science and Technology 187 (2021) 103282
Table 4
Median, standard deviation (SD) and standard error of the mean (SEM) of the estimated Crr for all groups in addition to section and sample count (N), mean air
temperature (Tair), unevenness (U), steerability (S) and cycling comfort (C).
Road condition Count Crr Tair (◦ C) U* S* C*
Sections N Median SD SEM Mean Min – Max (Mean)
Wet asphalt 37 4234 0.010 0.017 0.0003 1.3 5–5 (5.0) 5–5 (5.0) 5–5 (5.0)
Dry asphalt 5 317 0.012 0.014 0.0008 − 3.5 5–5 (5.0) 5–5 (5.0) 5–5 (5.0)
Compact snow 17 1177 0.014 0.020 0.0006 − 1.1 3–5 (4.6) 3–5 (4.3) 3–5 (4.0)
Slush (5 cm) and increased Crr. However, a threshold was reached at unevenness
lies between 0.010 and 0.035. Increasing depths of loose snow and slush score = 3, where an even lower (worse) unevenness score led to lower
lead to increased rolling resistance. Each section’s road conditions had (improved) rolling resistance. There was a clear correlation between a
natural variations, which in turn caused variations in Crr. This fluctua decrease in cycling comfort and an increase in rolling resistance.
tion led to measurement outliers and at times a skewed measurement Fig. 7 shows the measured Crr on cycleways with GsA, GsB, and
distribution, which most often occurred under conditions having the municipal (MUN) winter maintenance standards for each individual test
highest estimated Crr. The standard deviation (SD) range for the esti day and the four test days combined. The field measurements showed a
mated Crr for all road condition groups was 0.014–0.027. The uncer significantly lower Crr on the roads with winter maintenance standard
tainty range of the average Crr (SEM) for each group varied between GsA than what was found on roads with GsB and MUN. Although there
0.0003 and 0.0019. was no significant difference between the estimated Crr on GsB and
There is no overlap among the majority of the 95% confidence in MUN, there was a clear difference in the conditions that occurred on the
tervals (width of the notches) in the medians for each road condition roads having distinctive winter maintenance standards. For example, on
group. While the measured Crr for groups with non-overlapping confi GsA the road conditions were dominated by wet asphalt and combined
dence intervals is statistically different, these intervals did overlap be asphalt and slush. There were also dry asphalt patches and ones covered
tween “Loose snow (< 2cm) on compact snow” and “Slush (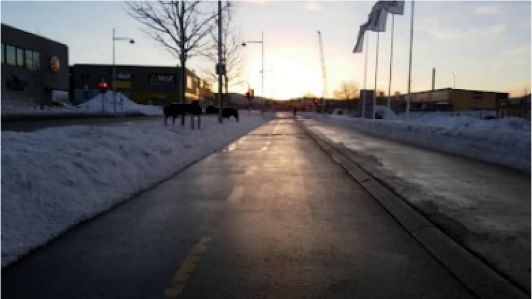
M.D. Fenre and A. Klein-Paste Cold Regions Science and Technology 187 (2021) 103282
Fig. 7. Estimated Crr on bicycle areas with GsA (bare road), GsB (winter road), and Municipal winter maintenance standard for four different dates during
winter 2019.
conditions are distributed over the different winter maintenance compared to wet asphalt. The same depth of dry or wet snow on top of
standards. asphalt led to a Crr of 0.027, causing a 170% higher rolling resistance
than wet asphalt. Larger depths of slush and snow indicated the same
4. Discussion finding: between 2 and 5 cm of slush on top of ice yielded a Crr of 0.030,
whereas 2-5 cm of dry or wet snow on top of compact snow led to a Crr of
The rolling resistance measurements taken from an instrumented 0.035. Slush has a higher liquid water content than dry or wet snow,
bicycle under winter conditions yielded median Crr values between giving it a significantly higher density, meaning that more mass must be
0.010 and 0.056. To place these numbers in perspective, Crr = 0.01 is compacted/displaced to move slush than the same volume of snow,
equivalent to the resistance felt on a flat road, while Crr = 0.056 feels like suggesting a higher rolling resistance increase. However, the high level
a 4.6% uphill slope. This range of resistance is noticed by any bicycle of water content also lubricates the bonds between the snow crystals,
commuter, irrespective of their fitness level. The Crr for bicycles with which makes the slush behave more like a liquid than a deformable
high-quality racing tires on hard road surfaces can be as low as 0.002 solid. Therefore, the slush is easily squeezed out to the tires’ sides rather
and as high as 0.008 for utility tires at low inflation pressure (Wilson than compressed under the tire like dry snow. Giudici et al. (2019)
et al., 2004). The average Crr on wet and dry asphalt found in this study discovered that this squeeze-out effect is dominant in snow having a
lay between 0.010 and 0.012. This seems like a relatively high reading; a liquid water content level higher than 10% by weight. This fact can
probable reason for this was the low air and pavement temperatures, explain why slush offers less additional rolling resistance than dry or wet
each around 0 ◦ C, which led to decreased elasticity in the tire rubber. In snow despite its higher density level.
addition, at only 2 Bar, the inflation pressure was low, a situation which In addition to snow type and depth, we also found correlations be
caused larger deformations in the tire, in turn increasing the effect of low tween perceived steerability and rolling resistance, as seen in Fig. 6a.
tire elasticity. The most important reason for the seemingly high Crr on Table 4 shows that deep slush on top of ice and deep loose snow caused
bare asphalt was probably the fact that the tires had steel studs for the worst steerability. This correlation was expected because, in addi
increased traction on icy surfaces. The studs improve safety and tion to increased rolling resistance, loose snow (dry, wet or slush) causes
maneuverability on ice. However, when there is no ice or snow on the increased steering resistance. Energy is needed to displace or compress
road surface for the studs to penetrate, they are instead pushed into the snow in order to change the front wheel’s direction in loose snow.
tire, causing more tire rubber deformations. Also, the energy loss from Steering can also be problematic in very wet snow because it offers a low
tire slippage on bare asphalt is probably higher for studded tires than for level of friction, even with studded tires. So in compacted, wet snow, the
regular tires, leading to a larger measured Crr. Further, the Crr was front wheel can slip when the cyclist initiates a turn. When cycling up
significantly lower on wet asphalt compared to dry asphalt. This can be hill, this can also allow the rear wheel to spin, significantly increasing
explained by the surface water acting as a lubricating agent, reducing the energy output and therefore the rolling resistance.
both slippage friction - and abrasion in tire studs and pavement alike. Fig. 6b shows that the correlation between increased unevenness and
The average Crr on compact snow was 0.014, a reading only slightly rising rolling resistance was clear for the three “best” grades of un
higher than that found on asphalt. This was expected because even evenness (3, 4, and 5). For the “worst” given grade of unevenness (2),
though the surface is relatively hard, a cyclist expends a certain amount the rolling resistance decreased to about the same level as for uneven
of pedaling energy on deforming compact snow. The low Crr shows that ness grade 4. Surfaces comprised of the worst grade of unevenness (1)
compact snow is not only an efficient surface for winter cycling, but it is were nearly impossible to cycle on; hence, the number of collected
also available without the use of anti-icing chemicals. A smooth layer of samples on these surfaces was too low to achieve statistically reliable
compact snow is, however, dependent on having consistently cold data. The power lost when cycling over bumps is determined by the
winter conditions. amplitude and frequency of the bicycle’s and cyclist’s vertical
The rolling resistance increased along with snow depth. This incre displacement. At amplitudes less than 60 mm and frequencies lower
ment concurs with the literature: in snow with similar density and than 6 Hz, the power loss has been found to be less than 2.7 W, corre
strength, increased snow depths lead to higher levels of rolling resis sponding to an increase in Crr of 0.0012 (at 10 km/h and a combined
tance due to a larger volume of deformable snow (Lidström, 1979; van bicycle and cyclist mass of 84 kg). Higher frequencies and amplitudes
Es, 1999). Compared to loose snow (dry or wet), increasing depths of quickly increase this power loss by several magnitudes (Pradko and Lee,
slush led to a smaller rise in Crr. When a maximum of 2 cm of slush lay on 1966). Most human limbs and organs have frequencies between 0.5 and
top of asphalt, this only led to a Crr of 0.016, or a relative rise of 60% 10 Hz, and this is also the frequency spectrum that causes most human
8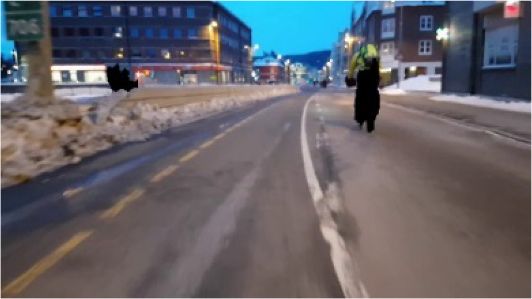
M.D. Fenre and A. Klein-Paste                                                                                   Cold Regions Science and Technology 187 (2021) 103282

Table 5
Distribution of road conditions over three different winter maintenance standards: GsA, GsB, and municipal standard.
  Road conditions                                        GsA                          GsB                        Municipal                    Total

                                                         N              %             N            %             N             %              N               %

  1             Wet asphalt                              3908           70.7          0            0             326           11.4           4234            47.0
  2             Dry asphalt                              292            5.3           0            0             25            0.9            317             3.5
  3             Compact snow                             88             1.6           388          62.5          701           24.5           1177            13.1
  4             Slush (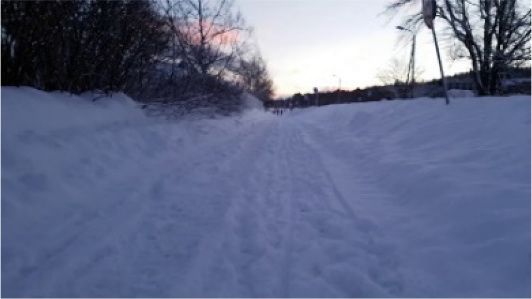
M.D. Fenre and A. Klein-Paste Cold Regions Science and Technology 187 (2021) 103282
subjective overall feeling of cycling comfort. High levels of rolling Bíl, M., Andrášik, R., Kubeček, J., 2015. How comfortable are your cycling tracks? A new
method for objective bicycle vibration measurement. Transport. Res. C Emerging
resistance were also found to correlate with reduced steerability and
Technol. 56, 415–425. https://doi.org/10.1016/j.trc.2015.05.007 (Record #382 is
increased unevenness. This finding means that the method offers an using a reference type undefined in this output style).
objectively measured parameter that can indirectly indicate levels of BMVI, 2012. National Cycling Plan 2020. Joining forces to evolve cycling. 2. Edition. htt
cycling comfort under winter conditions. Objectively measured perfor ps://repository.difu.de/jspui/handle/difu/232116.
Brandenburg, C., Matzarakis, A., Arnberger, A., 2007. Weather and cycling—a first
mance parameters are preferred when road owners outsource winter approach to the effects of weather conditions on cycling. Meteorol. Appl. 14 (1),
maintenance services to contractors. 61–67. https://doi.org/10.1002/met.6.
A rolling resistance of Crr = 0.025 seems to be a reasonable threshold Broach, J., Dill, J., Gliebe, J., 2012. Where do cyclists ride? A route choice model
developed with revealed preference GPS data. Transp. Res. A Policy Pract. 46 (10),
to indicate whether or not the conditions are satisfactory for bicycle 1730–1740. https://doi.org/10.1016/j.tra.2012.07.005.
commuters. However, as this statement is based on the subjective Clark, S.K., 1978. Rolling Resistance of Pneumatic Tires. Tire Sci. Technol. 6 (3),
perception of one person, more data is needed to confirm or adjust this 163–175. https://doi.org/10.2346/1.2151003.
Clevenson, S.A., Dempsey, T.K., Leatherwood, J.D., 1978. Effect of Vibration Duration on
criterion. Human Discomfort. NASA. https://www.semanticscholar.org/paper/Effect-of-vibra
Winter maintenance of cycleways using a high standard such as the tion-duration-on-human-discomfort-Clevenson-Dempsey/e1c95d59ed3434cfb124f
bare road strategy (GsA) keeps the rolling resistance at a tolerable level, e3046987d9f6dda2af5?p2df.
De Vos, J., 2020. The effect of COVID-19 and subsequent social distancing on travel
even during heavy snowfalls. Further, while a winter road strategy with behavior. Transp. Res. Interdiscip. Perspect. 5, 100121. https://doi.org/10.1016/j.
strict performance criteria (GsB) keeps the rolling resistance tolerable trip.2020.100121.
during stable winter weather, GsB roads offered rolling resistance worse Descornet, G., 1990. Road-surface influence on tire rolling resistance. In: Meyer, W.,
Reichert, J. (Eds.), Surface Characteristics of Roadways: International Research and
or much worse than the tolerable threshold during and after heavy
Technologies. ASTM International, West Conshohocken, PA, pp. 401–415. https://
snowfalls. doi.org/10.1520/STP23377S.
Finally, while it may not be practically feasible for most cities to Ellis, I.O., Amundsen, M., Høyem, H., 2016. Utvikling og variasjon i sykkelomfanget i
undertake frequent rolling resistance control rides using an instru Norge - En dybdeanalyse av den norske reisevanundersøkelsen. U. Analyse Rapport
78. https://hdl.handle.net/11250/2679638.
mented bicycle like the one employed in this study, this type of bicycle is Fenre, M.D., Klein-Paste, A., 2020. Bicycle rolling resistance measurements and video
a powerful research tool that can be applied to classify several winter recordings under winter conditions in Trondheim 2019. In: Mendeley Data, V1.
cycling conditions through utilizing rolling resistance data, written de https://doi.org/10.17632/gd9hjw997f.1.
Fenre, M.D., Klein-Paste, A., 2021. Rolling Resistance Measurements on Cycleways using
scriptions and high-definition video recordings. All of these factors may an Instrumented Bicycle. J. Cold Reg. Eng. https://doi.org/10.1061/(ASCE)
be useful for both evaluating different maintenance standards or CR.1943-5495.0000244.
methods and labelling images used in machine learning algorithms. Fishman, E., Schepers, P., Kamphuis, C.B.M., 2015. Dutch Cycling: Quantifying the
Health and Related Economic Benefits. Am. J. Public Health 105 (8), e13–e15.
https://doi.org/10.2105/AJPH.2015.302724.
Data availability Flynn, B.S., Dana, G.S., Sears, J., Aultman-Hall, L., 2012. Weather factor impacts on
commuting to work by bicycle. Prev. Med. 54 (2), 122–124. https://doi.org/
10.1016/j.ypmed.2011.11.002.
All data and code that support the findings of this study are freely Gent, A.N., Walter, J.D., 2006. Pneumatic Tire. The University of Akron. https://ideae
available as an online Mendeley dataset (Fenre and Klein-Paste, 2020). xchange.uakron.edu/mechanical_ideas/854.
Gillespie, T.D., 1992. Fundamentals of Vehicle Dynamics, vol. 400. Society of
Automotive Engineers.
CRediT authorship contribution statement Giudici, H., Wåhlin, J., Klein-Paste, A., 2019. Tire-Pavement Interaction in contact with
Salted Snow: how an Aqueous solution Affects Compression, Squeeze-out, and
Mathis Dahl Fenre: Conceptualization, Methodology, Software, Compaction of Snow. J. Cold Reg. Eng. 33 (4), 04019011 https://doi.org/10.1061/
(ASCE)CR.1943-5495.0000192.
Validation, Formal analysis, Investigation, Resources, Data curation,
Godavarthy, R.P., Rahim Taleqani, A., 2017. Winter bikesharing in US: User willingness,
Writing - original draft, Writing - review & editing, Visualization. Alex and operator’s challenges and best practices. Sustain. Cities Soc. 30, 254–262.
Klein-Paste: Conceptualization, Methodology, Validation, Writing - https://doi.org/10.1016/j.scs.2017.02.006.
review & editing, Supervision, Project administration, Funding Gössling, S., Schröder, M., Späth, P., Freytag, T., 2016. Urban Space distribution and
Sustainable Transport. Transp. Rev. 36 (5), 659–679. https://doi.org/10.1080/
acquisition. 01441647.2016.1147101.
Gössling, S., Choi, A., Dekker, K., Metzler, D., 2019. The social cost of automobility,
cycling and walking in the European Union. Ecol. Econ. 158, 65–74. https://doi.org/
Declaration of Competing Interest
10.1016/j.ecolecon.2018.12.016.
Griffin, M.J., 1990. Handbook of Human Vibration. Academic Press.
The authors declare that they have no known competing financial Koska, T., Rudolph, F., 2016. The role of walking and cycling in reducing congestion : a
portfolio of measures. https://epub.wupperinst.org/frontdoor/index/index/docId
interests or personal relationships that could have appeared to influence
/6597.
the work reported in this paper. Lidström, M., 1979. Aircraft rolling resistance in loose dry snow: a theoretical analysis.
Statens Väg-och Trafikinstitut. Report nr 173A.
Acknowledgments Lim, A.C., Homestead, E.P., Edwards, A.G., Carver, T.C., Kram, R., Byrnes, W.C., 2011.
Measuring changes in aerodynamic/rolling resistances by cycle-mounted power
meters. Med. Sci. Sports Exerc. 43 (5), 853–860. https://doi.org/10.1249/
This study has been supported by the Norwegian Public Roads MSS.0b013e3181fcb140.
Administration (NPRA) through the research project BEVEGELSE. The Litman, T., 2020. Pandemic-Resilient Community Planning. Victoria Transport Policy
Institute.
authors particularly wish to thank the valuable expert input they Lunke, E.B., Grue, B., 2018. Cycling and Cycling Goals (English summary) (1676/2018).
received from Katja Skille, Bård Nonstad and Johan Wåhlin (NPRA). The (TØI Report 1676/2018, Issue). https://www.toi.no/getfile.php/1349555/
authors also wish to thank Karin Lee for proof reading and improving the Publikasjoner/T%C3%98I%20rapporter/2018/1676-2018/1676-2018-sum.pdf.
Menghini, G., Carrasco, N., Schüssler, N., Axhausen, K.W., 2010. Route choice of cyclists
language of the article. in Zurich. Transp. Res. A Policy Pract. 44 (9), 754–765. https://doi.org/10.1016/j.
tra.2010.07.008.
References Meyer, D., Kloss, G., Senner, V., 2016. What is slowing me down? Estimation of rolling
resistances during cycling. Proc. Eng. 147, 526–531. https://doi.org/10.1016/j.
proeng.2016.06.232.
Andersen, L.G., Larsen, J.K., Fraser, E.S., Schmidt, B., Dyre, J.C., 2015. Rolling
Michelin, 2003. The Tyre - Rolling Resistance and Fuel Savings.
Resistance Measurement and Model Development. J. Transp. Eng. 141 (2) https://
Mitschke, M., Wallentowitz, H., 2004. Dynamik der Kraftfahrzeuge. Springer, Berlin.
doi.org/10.1061/(asce)te.1943-5436.0000673.
Nahal, T., Mitra, R., 2018. Facilitators and barriers to winter cycling: case study of a
Baldissera, P., Delprete, C., 2016. Rolling resistance, vertical load and optimal number of
downtown university in Toronto, Canada. J. Transp. Health 10, 262–271. https://
wheels in human-powered vehicle design. Proc. Inst. Mech. Eng. P 231 (1), 33–42.
doi.org/10.1016/j.jth.2018.05.012.
https://doi.org/10.1177/1754337115625002.
Niska, A., 2010, February 8. The Importance of Winter Maintenance for Cyclists. In: 13th
Bergström, A., Magnusson, R., 2003. Potential of transferring car trips to bicycle during
PIARC International Winter Road Congress, Quebec, Canada.
winter. Transp. Res. A Policy Pract. 37 (8), 649–666. https://doi.org/10.1016/
S0965-8564(03)00012-0.
10M.D. Fenre and A. Klein-Paste Cold Regions Science and Technology 187 (2021) 103282
NMI, 2019. Yr, The Norwegian Meteorological Institute. The Norwegian Meteorological 2009). Report nr. 1009/2009, Issue. https://www.toi.no/getfile.php?mmf
Institute. www.yr.no. ileid=11739.
NMoT, 2016-2017. National Transport Plan (NTP) 2018–2029 English Summary. Report Spencer, P., Watts, R., Vivanco, L., Flynn, B., 2013. The effect of environmental factors
to the Storting. https://www.regjeringen.no/en/dokumenter/meld.-st.-33- on bicycle commuters in Vermont: influences of a northern climate. J. Transp. Geogr.
20162017/id2546287/. 31, 11–17. https://doi.org/10.1016/j.jtrangeo.2013.05.003.
NPRA, 2014. Standard for Operations and Maintenance of National Roads - Handbook Steyn, W.J.V.D.M., Warnich, J., 2014. Comparison of Tyre rolling resistance for different
R610. In Norwegian. Norwegian Public Roads Administration. https://www.vegv mountain bike Tyre diameters and surface conditions. South African J. Res. Sport
esen.no/_attachment/61430/binary/964067. Phys. Educ. Recreation 36, 179–193.
Parkin, J., Wardman, M., Page, M., 2008. Estimation of the determinants of bicycle mode Tengattini, S., Bigazzi, A.Y., 2018. Physical characteristics and resistance parameters of
share for the journey to work using census data. Transportation 35 (1), 93–109. typical urban cyclists. J. Sports Sci. 36 (20), 2383–2391. https://doi.org/10.1080/
https://doi.org/10.1007/s11116-007-9137-5. 02640414.2018.1458587.
Pradko, F., Lee, R.A., 1966. Vibration Comfort Criteria 1966 Automotive Engineering Teschke, K., Reynolds, C.C., Ries, F.J., Gouge, B., Winters, M., 2012. Bicycling: Health
Congress and Exposition. https://doi.org/10.4271/660139. risk or benefit. UBC Med. J. 3 (2), 6–11.
Pytka, J., 2010. Determination of snow stresses under vehicle loads. Cold Reg. Sci. Trondheim Municipality, 2020. Winter Maintenance. https://www.trondheim.
Technol. 60 (2), 137–145. kommune.no/veg/#heading-h2-6.
Rekilä, K.-P., Klein-Paste, A., 2016. Measuring bicycle braking friction in winter van Es, G.W.H., 1999. Method for predicting the rolling resistance of aircraft tires in dry
conditions. Cold Reg. Sci. Technol. 125, 108–116. snow. J. Aircr. 36 (5), 762–768.
Shoop, S.A., 2001. Finite element modeling of tire-terrain interaction. In: Technical Volskaia, V.N., Zhileykin, M.M., Zakharov, A.Y., 2018. Mathematical model of rolling an
Report 01-16. University of Michigan and ERDC/CRREL. elastic wheel over deformable support base. IOP Conference Series: Materials
Shoop, S.A., Richmond, P.W., Lacombe, J., 2006. Overview of cold regions mobility Science and Engineering 315, 012028. https://doi.org/10.1088/1757-899x/315/1/
modeling at CRREL. J. Terrramech. 43 (1), 1–26. https://doi.org/10.1016/j. 012028.
jterra.2004.08.004. Wilson, D.G., Papadopoulos, J., Whitt, F.R., 2004. Bicycling Science. Massachusetts
Sørensen, M.W.J., Mosslemi, M., 2009. Subjective and Objective Safety - The Effect of Institute of Technology (MIT).
Road Safety Measures on Subjective Safety Among Vulnerable Road Users (1009/
11You can also read