How Much Impact Has the Cover Crop Mulch in Mitigating Soil Compaction?-A Field Study in North Italy
←
→
Page content transcription
If your browser does not render page correctly, please read the page content below
agronomy
Article
How Much Impact Has the Cover Crop Mulch in Mitigating
Soil Compaction?—A Field Study in North Italy
Marco Benetti 1 , Kaihua Liu 1 , Lorenzo Guerrini 1, * , Franco Gasparini 1 , Andrea Peruzzi 2 and Luigi Sartori 1

 1 Dipartimento Territorio e Sistemi Agro-Forestali, Università di Padova, Viale dell’università 16,
 35020 Legnaro, Italy
 2 Dipartimento di Scienze Agrarie, Alimentari e Agro-ambientali, Università di Pisa, Via del Borghetto 80,
 56124 Pisa, Italy
 * Correspondence: lorenzo.guerrini@unipd.it

 Abstract: Soil compaction was largely studied in different scenarios with laboratory and field scale
 experiments, with various soil conditions and traffic intensities. However, a detailed analysis to
 better understand the protective role of plant residues or cover crop mulch is still required. A field
 test was conducted in Northeast Italy aiming to fill this gap. Rye was chosen as a winter cover crop,
 and growth on a controlled traffic random block experimental field. Four different cover crop mulch
 treatments were compared to study the effects of root systems: roller crimper, flail mower, bare
 soil control and harvested biomass control. Four different traffic intensities were used to evaluate
 the multiple passages with 0, 1, 3, 5 traffic events. During traffic events, the mean normal stress
 was measured. Penetration resistance was then evaluated after trafficking and soil samples were
 collected. The obtained results showed a 19.3% cone index increase in bare soil compared to flail
 mower treatment after the first traffic event, while low differences were found in harvested biomass
 bulk density during the first and third traffic events. Moreover, mean normal stress increased 16.5%
 on harvested biomass treatment compared to the flail mower. These findings highlight that the cover
 crop maintains a lower soil penetration resistance during compaction events, helping the subsequent
 field operations. Furthermore, roller crimper and flail mower cover crop termination impact soil
 bearing capacity differently due to different soil moisture content. However, the results showed a
Citation: Benetti, M.; Liu, K.; low contribution of cover crop mulch on mitigating soil compaction effects during the experiment.
Guerrini, L.; Gasparini, F.; Peruzzi,
A.; Sartori, L. How Much Impact Has Keywords: soil compaction; cover crop; bulk density; mean normal stress; soil cone index; mulch
the Cover Crop Mulch in Mitigating
Soil Compaction?—A Field Study in
North Italy. Agronomy 2023, 13, 686.
https://doi.org/10.3390/
 1. Introduction
agronomy13030686
 Soil compaction is one of the main causes of soil degradation [1]. In fact, soil com-
Academic Editor: Javier M. Gonzalez paction induces a complex change in soil conditions and behaviour, including loss of soil
Received: 21 January 2023
 porosity and pore function [2]. This phenomenon occurs when the load transmitted by
Revised: 21 February 2023 vehicles applied a higher stress than the soil bearing capacity, which involves plastic soil
Accepted: 24 February 2023 deformation [3]. Different approaches can be used to mitigate soil compaction effects on
Published: 26 February 2023 soil and plant growth, such as enhancing soil bearing capacity [4], decreasing soil stress [5]
 or reducing the trafficked area [6]. During forestry operations, the use of brush mats
 as a soil protective layer was frequently adopted to decrease compaction and improve
 trafficability [7]. Conservation agriculture can match the same forestry strategy to mitigate
Copyright: © 2023 by the authors. compaction when residues are left on the surface, but the main aim is to mitigate soil
Licensee MDPI, Basel, Switzerland. erosion. Few experiments studied soil compaction mitigation on the surface residue layer.
This article is an open access article Ess et al. studied the cover crop effects on mitigating soil compaction with field experiments
distributed under the terms and by analysing roots and surface biomass effects on soil characteristics and behaviour [8].
conditions of the Creative Commons
 In addition, field tests with stress state transducers showed residues effects on soil stress
Attribution (CC BY) license (https://
 compared to bare soil [9], but the quantity, type and conditions of residues was not de-
creativecommons.org/licenses/by/
 fined. Other lab and bin experiments showed no differences between different amounts of
4.0/).

Agronomy 2023, 13, 686. https://doi.org/10.3390/agronomy13030686 https://www.mdpi.com/journal/agronomy
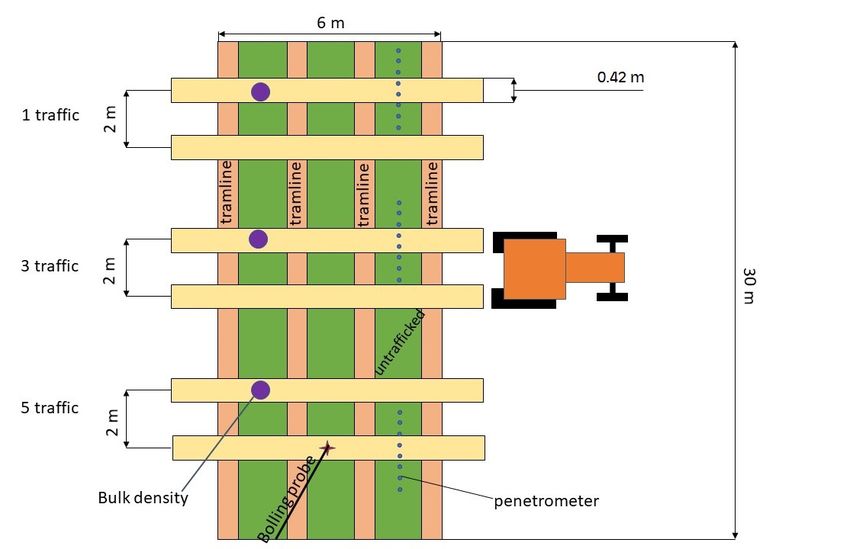
Agronomy 2023, 13, x FOR PEER REVIEW 2 of 14

 behaviour [8]. In addition, field tests with stress state transducers showed residues effects
 Agronomy 2023, 13, 686 on soil stress compared to bare soil [9], but the quantity, type and conditions of residues 2 of 14
 was not defined. Other lab and bin experiments showed no differences between different
 amounts of residues mixed with soil on the compression index [10]. However, a bin
 experiment with surface residues showed that mean normal stress decreases less than 80
 residues mixed with soil on the compression index [10]. However, a bin experiment with
 kPa comparing maize residues and bare soil treatment with no statistical differences in
 surface residues showed that mean normal stress decreases less than 80 kPa comparing
 bulk density [10]. Other outcomes regarding residues effects on stress mitigation were
 maize residues and bare soil treatment with no statistical differences in bulk density [10].
 obtained in a laboratory experiment, but they did not confirm the field test [11]. Recent
 Other outcomes regarding residues effects on stress mitigation were obtained in a labora-
 findings obtained in a laboratory experiment showed that residues effects have subtly
 tory experiment, but they did not confirm the field test [11]. Recent findings obtained in a
 increased soil load-bearing capacity (e.g., 15 kPa in apparent precompression stress, 7%).
 laboratory experiment showed that residues effects have subtly increased soil load-bearing
 Soil bulk density changes decreased below 100 kPa stress and increased over 400 kPa
 capacity (e.g., 15 kPa in apparent precompression stress, 7%). Soil bulk density changes
 stress [12]. Few
 decreased belowprevious
 100 kPa studies
 stress andshowed a complete
 increased over 400approach
 kPa stress to evaluate
 [12]. the residues
 Few previous studies
 effects
 showed on soil compaction
 a complete [8]. Indeed,
 approach other
 to evaluate studies
 the residueswere focused
 effects on compaction
 on soil residues effects only,
 [8]. Indeed,
 without analysing the soil conditions due to the lying residues or cover crop
 other studies were focused on residues effects only, without analysing the soil conditions growth
 [11,12].
 due toThe aim of
 the lying our study
 residues was crop
 or cover to test the effects
 growth of The
 [11,12]. residues
 aim ofobtained
 our study from
 wasdiffering
 to test the
 cover crop management on soil compaction in a real-scale field experiment
 effects of residues obtained from differing cover crop management on soil compaction by considering in a
 possible interactions
 real-scale and effects
 field experiment that affect
 by considering the soil
 possible compaction
 interactions andphenomena during
 effects that affect the
 cropping operations, which are difficult to observe in laboratory experiments.
 soil compaction phenomena during cropping operations, which are difficult to observe in
 laboratory experiments.
 2. Materials and Methods
 2. Materials and Methods
 The field experiment was conducted on the University of Padova Experimental farm
 (Legnaro,
 TheItaly, 45°21’4’’ N; was
 field experiment 11°56’49’’ E; 6 m
 conducted ona.s.l.) in 2022 (Figure
 the University 1). Temperatures
 of Padova Experimentalrisefarm
 from January
 (Legnaro, Italy, ◦ 210 400 N;
 (min45average: 11◦℃)
 −1.5 560to 00 E; (max
 49July average:
 6 m a.s.l.) ℃). The1).
 27.2(Figure
 in 2022 sub-humid climate
 Temperatures rise
 receives approximately
 from January 850 mm
 (min average: −1.5of◦ C)
 rainfall
 to Julyannually, with the
 (max average: ◦ C). The
 27.2highest average rainfall
 sub-humid in
 climate
 receives
 June approximately
 (100 mm) and October 850(90
 mm of rainfall
 mm). The lowestannually, withwere
 averages the highest
 recorded average rainfall
 in January andin
 June (100
 February mm) mm).
 (50–60 and October
 The soil(90 mm).ofThe
 texture lowest averages
 the experiment field were
 is clayrecorded
 loam andinwasJanuary and
 already
 Februaryin(50–60
 analysed mm).
 another Theexperiment
 field soil texture[13].
 of the experiment
 The soil was field is clay loam
 characterised by and was already
 a 33.8% sand
 analysed
 content, in another
 37.0% silt and field
 29.2%experiment [13]. The
 clay. The organic soilcontent
 matter was characterised
 of the topsoilbywas
 a 33.8%
 1.81%.sand
 content, 37.0% silt and 29.2% clay. The organic matter content of the topsoil was 1.81%.

 Figure
 Figure Trafficpattern
 1.1.Traffic patternof
 of the
 the experimental field
 fieldtest
 testfor
 forevery
 everycovering
 coveringplot.
 plot.The
 Thepicture shows
 picture how
 shows
 how
 the the traffic
 traffic waswas managed
 managed duringduring the experiment
 the experiment to avoid
 to avoid compaction
 compaction on theon the sampling
 sampling zone
 zone through
 through the sampling
 the sampling area ofarea of thedensity,
 the bulk bulk density, penetrometer
 penetrometer to measure
 to measure coneand
 cone index index and Bolling
 Bolling probe to
 probe
 assess mean normal stress. A total of 16 covering plots were used with 4 different covering covering
 to assess mean normal stress. A total of 16 covering plots were used with 4 different treatments
 treatments and 4 replicates.
 and 4 replicates.

 The area of the experiment was selected after preliminary soil variability analysis
 conducted using a high-resolution electromagnetic conductivity meter (CMD mini explorer
 6 L, GF instrument, Brno, Czech Republic). Thus, a homogeneous area was selected,
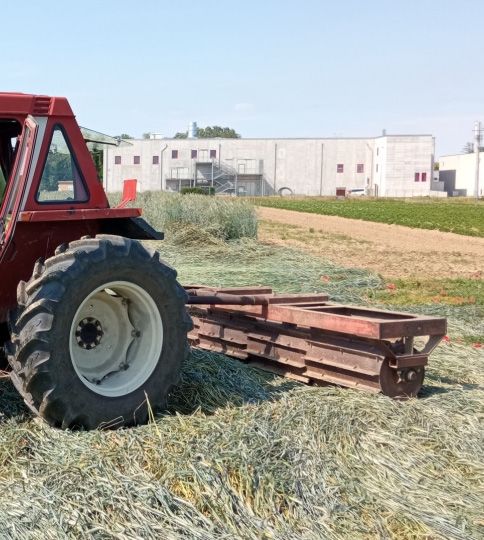
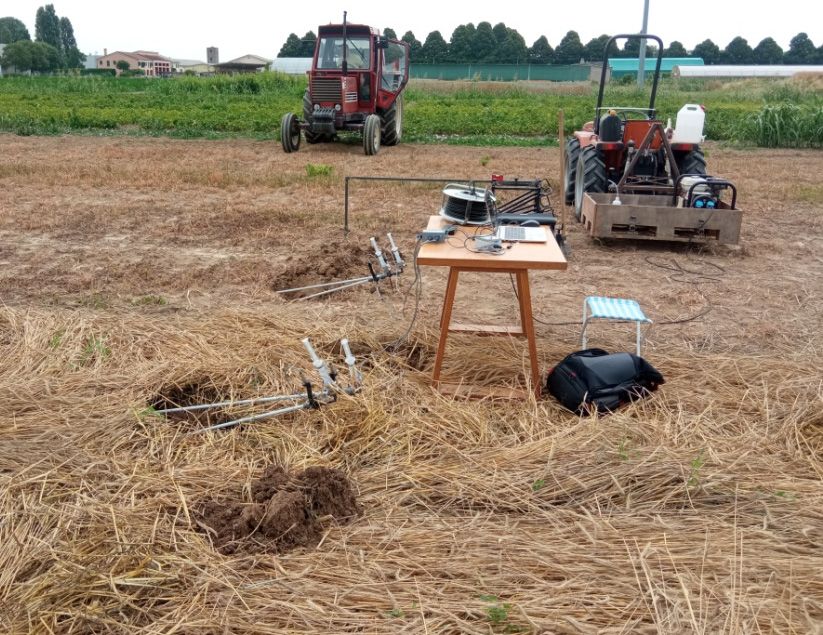
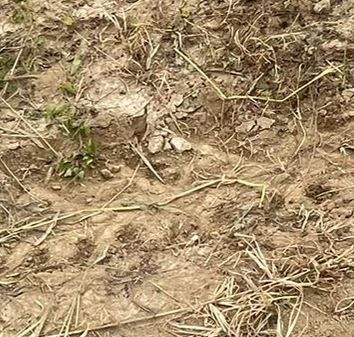
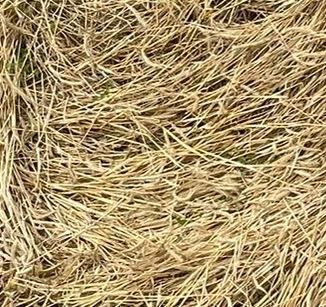
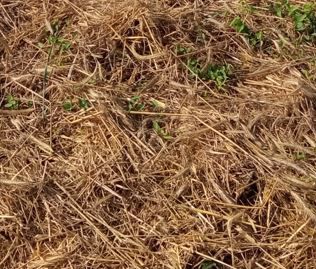
Agronomy 2023, 13, x FOR PEER REVIEW 3 of 14

 The area of the experiment was selected after preliminary soil variability analysis
Agronomy 2023, 13, 686 conducted using a high-resolution electromagnetic conductivity meter (CMD mini 3 of 14
 explorer 6 L, GF instrument, Brno, Czech Republic). Thus, a homogeneous area was
 selected, avoiding headlands. After this process the field was divided in plots and tilled
 to prepareheadlands.
 avoiding a homogeneous seedbed.
 After this process The field
 the fieldhad
 was a 45 cm depth
 divided in plotsploughed
 and tilledon to
 26 prepare
 Octobera
 2021 with a Bordin
 homogeneous (Padova,
 seedbed. The Italy)
 field haddoublea 45furrow
 cm depth plough,
 ploughed and all onfield operations
 26 October 2021were
 with
 carried out following controlled traffic to avoid compaction
 a Bordin (Padova, Italy) double furrow plough, and all field operations were carried in the sampling area. out
 A
 Pegoraro (Lonigo, Italy) PTO powered rotary harrow was used
 following controlled traffic to avoid compaction in the sampling area. A Pegoraro (Lonigo, for seedbed preparation,
 and rye
 Italy) PTO(Secale cereale
 powered L.) was
 rotary harrowsown waswith
 used a common
 for seedbed Carraro row drill
 preparation, and(Campodarsego,
 rye (Secale cereale
 Italy)
 L.) wasonsown
 29 October 2021. Seeding
 with a common Carrarorate rowwas drill165 kg ha (cultivar:
 -1
 (Campodarsego, Italy)Antoninskie).
 on 29 October One 2021.
 thousand seeds weight 23.9 −g.1 No fertilizer was applied during
 Seeding rate was 165 kg ha (cultivar: Antoninskie). One thousand seeds weight 23.9 the experiment. Bare soilg.
 treatments were also tilled, without sowing. On bare soil treatment,
 No fertilizer was applied during the experiment. Bare soil treatments were also tilled, two weed controls
 were conducted
 without sowing.with chemical
 On bare herbicide two
 soil treatment, (glyphosate 1.44 kgwere
 weed controls ha-1 conducted
 each one). with chemical
 Four cover crop mulch treatments
 herbicide (glyphosate 1.44 kg ha each one). − 1 were considered: roller crimper (Crimped), flail
 mower (Shredded),
 Four cover crop bare soil (Bare),
 mulch treatments harvested canopy (Harvested)
 were considered: roller crimper(Figures 2 and 3). The
 (Crimped), flail
 cover
 mower crop mulch was
 (Shredded), bareterminated
 soil (Bare), with one passage
 harvested of the roller
 canopy (Harvested) crimper
 (Figures (Crimped
 2 and 3). The
 treatment)
 cover crop or mulchmounted flail mower
 was terminated with (Berti Machine
 one passage Agricole
 of the spa, Caldiero,
 roller crimper (CrimpedItaly)
 treat-
 (Harvested and shredded treatment) on 26 May 2022, following
 ment) or mounted flail mower (Berti Machine Agricole spa, Caldiero, Italy) (Harvested and a random block design.
 The roller crimper
 shredded treatment) involved
 on 26 May in the testfollowing
 2022, was built aby modifying
 random blockandesign.
 iron smooth-roller. The
 The roller crimper
 roller crimper
 involved in thehadtestawas
 totalbuilt
 mass byofmodifying
 880 kg and an airon
 working width ofThe
 smooth-roller. 3.3 roller
 m. The crimping
 crimper had
 action
 a totalwas
 massachieved
 of 880 kg using
 and atwelve
 working ironwidth
 platesofwith
 3.3 m.6 mm thickness action
 The crimping and 60wasmmachieved
 height.
 Plates
 using were
 twelve welded orthogonally
 iron plates with 6 to mm thethickness
 tangential plane
 and of the
 60 mm roller surface,
 height. everywelded
 Plates were 121.7
 mm of circumference.
 orthogonally The resulting
 to the tangential plane ofexternal
 the roller roller diameter
 surface, every was 121.7585 mmmm. Mulch was
 of circumference.
 The resulting
 removed by handexternal
 justroller
 before diameter
 traffickingwas 585 mm.
 in the Mulch was removed
 “Harvested” treatment. byTwo
 handirrigations
 just before
 trafficking in the “Harvested” treatment. Two irrigations
 were applied with a hose-reel sprinkler irrigator (Irrigazione Veneta srl, Torri were applied with a hose-reeldi
 sprinkler irrigator
 Quartesolo, (Irrigazione
 Italy) four days before Veneta srl, Torri
 traffic due di to Quartesolo,
 a drought during Italy) four daysand
 spring before traffic
 summer
 due to
 2022, thea drought
 first of 50during
 mm and spring
 secondandof summer
 15 mm.2022, the first of 50 mm and second of 15 mm.

 (a) (b)
 Figure
 Figure2.2.Different
 Differentcover
 covercrop
 cropterminations:
 terminations:(a)
 (a)flail
 flailmower,
 mower,(b)
 (b)roller
 roller crimper.
 crimper.

 The experimental plots were trafficked simultaneously 0, 1, 3 and 5 times at 4 km h−1 ,
 as shown in Figure 1 on the undisturbed sampling zone. The biomass samples were
 collected before traffic events. The soil samples were collected immediately after traffic
 events. The two-wheel drive tractor used for trafficking is described in Table 1.
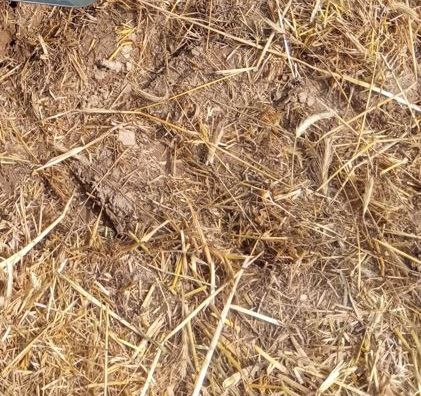
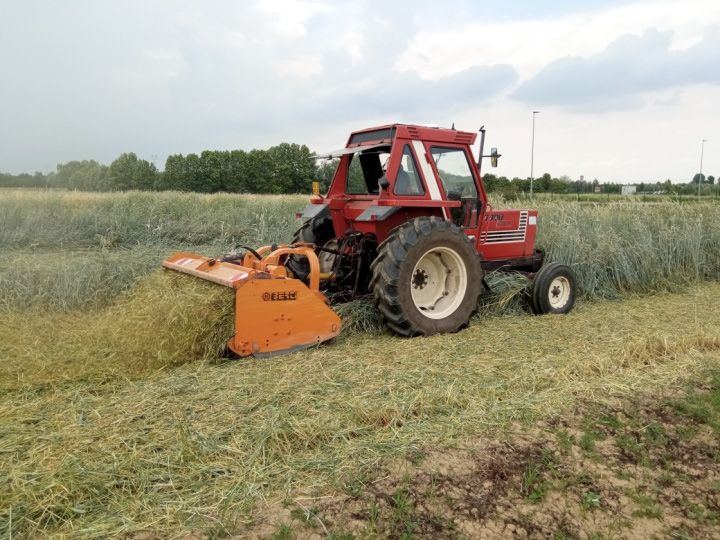
Agronomy 2023,
 Agronomy 13,13,
 2023, x FOR
 686 PEER REVIEW 4 of4 14
 of 14

 (1) (2)

 (3) (4)
 Figure
 Figure 3. Effect of the
 3. Effect four
 of the different
 four cover
 different crop
 cover managements
 crop managements compared in in
 compared thethe
 experiment:
 experiment: (1)(1)
 bare
 bare
 soilsoil
 (Bare);
 (Bare);(2) roller crimper
 (2) roller crimper(Crimped);
 (Crimped); (3) harvested
 (3) harvested canopy
 canopy (Harvested);
 (Harvested); (4) flail(Shredded).
 (4) flail mower mower
 (Shredded).

 Table Technical dataplots
 The1.experimental of thewere
 tractor used in the
 trafficked experiment.
 simultaneously 0, 1, 3 and 5 times at 4 km h−1,
 as shown in Figure 1 on the undisturbed sampling zone. The biomass samples were
 Name Unit Model
 collected before traffic events. The soil samples were collected immediately after traffic
 Tractor
 events. TheModel Fiat 680
 two-wheel drive tractor used for trafficking is described in Table 1.
 Total mass kg 4310
 Front axle kg 780
 Table 1. Technical data of the tractor used in the experiment.
 Rear axle kg 3530
 Rear
 Name tyre Kleber traker
 Unit 420/85R30
 Model
 Front tyre Vredestein multirill 7.50–16
 Tractor Model
 Front tyre inflation pressure bar 1.7 Fiat 680
 Total
 Rearmass
 tyre inflation pressure bar kg 1.45 4310
 Front axle kg 780
 Rear axle
 2.1. Soil Cone Index kg 3530
 Rear tyrePenetration resistance was measured Kleber
 withtraker
 a cone penetrometer 420/85R30
 to evaluate the effect
 Front
 of traffic conditions on soil. The cone penetrometer (Penetrologger7.50-16
 tyre Vredestein multirill Eijkelkamp, Geesbek,
 Front tyre inflation pressure
 The Netherlands) was inserted into thebar soil at a constant speed with 1.7a penetration rate of
 Rear
 lesstyre
 thaninflation −
 2 cm s pressure
 1 . The cone used in the barpenetrometer had a base1.45 diameter of 12.83 mm
 and cone angle of 30◦ , as specified in ASAE Standards S313.3 and EP 542 (ASAE Stan-
 2.1.dards,
 Soil Cone
 1999,Index
 2001). The penetrometer was mounted on a designed iron frame fixed to
 thePenetration
 hydraulic piston
 resistance(Figure 4). The iron
 was measured frame
 with allows
 a cone the penetrometer
 penetrometer to the
 to evaluate change
 effectthe
 of location of measurement
 traffic conditions on soil. horizontally. The hydraulic
 The cone penetrometer piston driven
 (Penetrologger by the tractor
 Eijkelkamp, allows
 Geesbek,
 for the uniform insertion speed during measurement. One transect centred
 The Netherlands) was inserted into the soil at a constant speed with a penetration rate on the wheel
 of
 less than 2 cm s . The cone used in the penetrometer had a base diameter of 12.83 mm and of
 rut was performed
 -1 for every level of traffic and cover crop mulch treatment for a total
 64 transects.
 cone Every
 angle of 30°, transect had
 as specified 15 penetration
 in ASAE Standards points spaced
 S313.3 and 5EPcm542
 with depthStandards,
 (ASAE up to 60 cm.
1999, 2001). The penetrometer was mounted on a designed iron frame fixed to the
 hydraulic piston (Figure 4). The iron frame allows the penetrometer to change the location
 of measurement horizontally. The hydraulic piston driven by the tractor allows for the
Agronomy 2023, 13, 686 5 of 14
 uniform insertion speed during measurement. One transect centred on the wheel rut was
 performed for every level of traffic and cover crop mulch treatment for a total of 64
 transects. Every transect had 15 penetration points spaced 5 cm with depth up to 60 cm.
 The
 Thecone
 coneindex
 indexwas
 wascalculated
 calculatedasas
 the average
 the of of
 average 7 centred on on
 7 centred thethe
 rut rut
 penetration points
 penetration on
 points
 4on
 defined depth layers: 5–15, 15–25, 25–35, 35–45 cm. After a preliminary data analysis,
 4 defined depth layers: 5–15, 15–25, 25–35, 35–45 cm. After a preliminary data analysis,
 the
 thedeeper
 deeperlayer
 layer(35–45
 (35–45cm
 cmdepth)
 depth)waswasnot
 notconsidered
 consideredin inthe
 thestatistical
 statisticalanalysis
 analysisdue
 duetotothe
 the
 presence of plough pan.
 presence of plough pan.

 Figure4.4.AApenetrometer
 Figure penetrometerwaswasinstalled
 installedon
 onan
 aniron
 ironframe
 framewith
 withhydraulic
 hydraulicramram to insert
 to insert thethe cone
 cone tip tip
 at
 at constant speed in the
 constant speed in the soil. soil.

 2.2.
 2.2.Rut
 RutProfile
 ProfileAnalysis
 Analysis
 Penetrometer
 Penetrometerdata datawere
 wereused
 usedto toanalyse
 analyse rut
 rut profile
 profileevolution
 evolution after
 after 0,
 0, 1,
 1, 3,
 3, 55 passages.
 passages.
 The
 Thepenetrometer
 penetrometerwas wasmounted
 mountedon onaahydraulic
 hydraulicframe
 frameto tostart
 startpenetration
 penetrationevery
 everytime
 timefrom
 from
 the
 the same
 sameposition.
 position. The
 The ultrasonic
 ultrasonic depth
 depth sensor
 sensor of
 of the
 the penetrometer
 penetrometer allows
 allows for for cone
 cone tip
 tip
 depth reading with a 1 cm interval. The value with zero before soil penetration
 depth reading with a 1 cm interval. The value with zero before soil penetration was used was used to
 estimate the rut section area. Rut profile areas (cm 2 ) 2were calculated using the following
 to estimate the rut section area. Rut profile areas (cm ) were calculated using the following
 Equation
 Equation(1):(1):
 Rut profile area = ∑ Pd ∗ D1 (1)
 = ∗ (1)
 where:
 Pd = distance measured with penetrometer ultrasonic sensor (cm)
 where:
 DP1d = distance measured
 = distance between two penetrations
 with (cm)
 penetrometer ultrasonic sensor (cm)
 D1 = distance between two penetrations (cm)
 2.3. Soil Bulk Density and Soil Moisture
 Soil Bulk
 2.3. Soil samples were
 Density collected
 and with a special hydraulic sampler up to 60 cm depth [14].
 Soil Moisture
 Frost storage was used to maintain samples during processing. The soil samples were
 Soil samples were collected with a special hydraulic sampler up to 60 cm depth [14].
 divided into the following depth layers: 5–15, 15–25, 25–35, 35–45 cm. Samples were
 Frost storage was used to maintain samples during processing. The soil samples were
 weighed and oven-dried at 105 ◦ C until constant weight. Bulk densities (g cm−3 ) were
 calculated using the following Formula (2): 5–15, 15–25, 25–35, 35–45 cm. Samples were
 divided into the following depth layers:

 m
 Bulk Density = (2)
 v
 where:
 m = dry mass of soil collected on undisturbed and defined volume “v” (g)
 v = volume of soil sample (cm3 ).
Agronomy 2023, 13, 686 6 of 14

 The deeper layer (35–45 cm depth) was not considered in the statistical analysis due to
 the presence of plough pan.
 Soil moistures were measured with undisturbed soil samples used to measure bulk
 density. Volumetric water content (%) was calculated using the following Formula (3):

 (M − m)
 VWC = 100 ∗ (3)
 (d ∗ v)

 where:
 M = wet soil mass (g)
 m= dry mass of soil collected on undisturbed and defined volume “v” (g)
 d = water density (g cm−3 )
 v = volume of soil sample (cm3 ).
 Additionally in this case, the deeper layer (35–45 cm depth) was not considered in the
 statistical analysis due to the presence of plough pan.

 2.4. Biomass
 Biomass samples were collected after trafficking the experimental field, using an iron
 wire square with 0.4 m side. Biomass was weighed and oven-dried at 105 ◦ C until constant
 weight to measure dry mass and biomass moisture.

 2.5. Mean Normal Stress
 Mean normal stress was estimated using the Bolling probe [15,16]. The probes have
 a deformable cylindrical bulb and can easily be inserted in undisturbed soil at a defined
 depth with special installation tools. Sampling grids were created to align probe bulbs
 in order to define the trafficking and measuring area. Bulbs were filled with water and
 pressurized before trafficking. A Keller (Winterthur, Switzerland) hydraulic pressure
 sensor provided real time measurements. A laptop computer was connected to the sensor
 to monitor sampling and datalogging. Bolling probes were installed at 20 and 40 cm depths
 without damaging the cover crop mulch, as showed in Figure 5. Only maximum values,
 corresponding to the peak of rear axle traffic, were used. The first two passes were not
 considered during data analysis to avoid unreliable data due to soil deformation around
Agronomy 2023, 13, x FOR PEER REVIEW
 the bulb zones. The pressure data under different depths were collected after each time 7 of 1
 compaction (five times in total; only the last three were considered in the analysis).

 Figure5.5.Installation
 Figure Installation position
 position of the
 of the Bolling
 Bolling probeprobe to measure
 to measure thenormal
 the mean mean normal stress
 stress with with differen
 different
 covercrop
 cover cropmulch
 mulch treatments.
 treatments.

 Mean normal stress ( ) was calculated [15,16] from Bolling probe pressure data in
 order to compare the results in different cover crop mulch treatments. The following i
 the calculation Formula (4) of the mean normal stress (kPa):
 1+
 = (4
Agronomy 2023, 13, 686 7 of 14

 Mean normal stress (σm ) was calculated [15,16] from Bolling probe pressure data in
 order to compare the results in different cover crop mulch treatments. The following is the
 calculation Formula (4) of the mean normal stress (kPa):

 1+v
 σm = p (4)
 3(1 − v) i

 where:
 pi is the measured stress from the Bolling probe (kPa)
 v is the Poisson ratio in the soil matrix
 The value of the Poisson ratio for soils is usually between 0.20 and 0.45 [17–21]. We
 set the Poisson ratio as 0.3 in our study using data available from previous studies [16,19].

 2.6. Statistics
 The trials were arranged in a randomized block design. In each of the 4 blocks, all
 the 4 considered cover crop management strategies were tested, in randomized order,
 as fixed effect factors. The number of transits and depths of measurement were further
 introduced in the model as random factors. Data were treated with an analysis of variance
 (ANOVA) model considering the main effects of the 3 tested factors, their interactions, and
 the experimental blocks. The chosen significant threshold was p < 0.05. The Tukey HSD
 was chosen as the post hoc test.

 3. Results
 The statistical significance of the results obtained in the experiment are summarized
 in Table 2.

 Table 2. Analysis of variance, with all soil properties and variables taken into account.

 Analysis of Variance Summary
 CCM CCM
 Cover Crop Mulch Traffic Events Depth Soil Moisture
 × TE × Depth
 Bulk Density
Mean Normal Stress 0.004
Harvested 1498,44 66,80 a 0 1240,63 36,97 c
 alpha: 00,5
 Treatments with the same letter are not significantly different.

 3.3. Soil Bulk Density and Soil Moisture
Agronomy 2023, 13, 686 9 of 14
 The results of the statistical analysis of bulk density data obtained in the four com-
 pared treatments after each passage of the tractor are shown in Figure 7.

 1.60

 1.50
 Bulk Density (g cm-3)

 1.40

 1.30

 1.20

 1.10

 1.00
 0 1 2 3 4 5 6
 Number of traffic events

 Crimped Shredded Bare soil Harvested

 Figure
 Figure 7.
 7. Bulk
 Bulk density
 density means
 means resulted
 resulted from
 from different
 different number
 number of
 of traffic
 traffic events
 events and
 and cover
 cover crop
 crop mulch
 mulch
 treatments (Harvested; Bare soil; Crimped; Shredded). Residual standard errors were used on the
 treatments (Harvested; Bare soil; Crimped; Shredded). Residual standard errors were used on the
 bar error.
 bar error.

 Bulk
 Bulk density
 density increased
 increasedsignificantly
 significantlyuntil
 untilthethethird
 thirdtraffic event.
 traffic ZeroZero
 event. traffic was was
 traffic sta-
 tistically lower
 statistically lowerthan other
 than traffic
 other events.
 traffic OneOne
 events. traffic event
 traffic waswas
 event statistically higher
 statistically thanthan
 higher the
 zero traffic event, but was statistically lower than three or more traffic intensities.
 the zero traffic event, but was statistically lower than three or more traffic intensities. No No dif-
 ferences
 differenceswere
 werefound
 found between
 between the
 thethird
 thirdand
 andfifth
 fifthpassages.
 passages.Cover
 Covercropcrop mulch
 mulch treatment
 treatment
 was characterized by significantly lower bulk density on bare soil
 was characterized by significantly lower bulk density on bare soil treatment compared treatment compared
 to
 to Harvested
 Harvested and and Shredded.
 Shredded.Crimped
 Crimpedmulchmulchtreatment cannot be
 treatment cannot be considered
 considered statistically
 statistically
 different from the
 different from the other
 other mulch
 mulch treatments.
 treatments. Statistically
 Statistically higher
 higher BD BD values
 values were found on
 were found on
 removed
 removed mulchmulchtreatment
 treatment(Harvested)
 (Harvested) after
 after thethe first
 first andand
 thirdthird passages
 passages in comparison
 in comparison with
 with the treatments
 the other other treatments when considering
 when considering the interaction
 the interaction effect traffic
 effect between between and traffic and
 cover crop
 cover crop mulch treatments. Moreover, BD also did not show differences
 mulch treatments. Moreover, BD also did not show differences between mulch treatment at between mulch
 treatment
 zero and fiveat zero
 trafficand five traffic
 events. events.
 Statistical Statistical
 analysis analysisdifferences
 also showed also showed differences
 in bulk density in
 the soil layers between 5 and 15 cm depth and 15 and 25 cm depth. No differences were
 found between the deeper layer and the other layers.
 Volumetric soil water content did not show any statistical difference at the different
 depths where it was analyzed. Interaction effects between traffic and mulch treatment
 were not detected during statistical analysis. Harvested and Shredded treatments resulted
 in significantly higher water content in comparison to Bare and Crimped treatments. No
 differences were found between Harvested and Shredded, nor between Bare and Crimped.
 Only zero traffic was significantly lower than the other traffic events. No differences in
 water content were found between the first, third and fifth passages. Removed mulch
 treatment (Harvested) showed a higher level of moisture at every traffic intensity.

 3.4. Biomass
 The results of the statistical analysis of mulch dry biomass are shown in Table 4.
Agronomy 2023, 13, 686 10 of 14

 Table 4. Result of statistical analysis on mulch dry biomass.

 Treatment Mulch Dry Biomass (Mg ha−1 ) Standard Error
 Crimped 11.24 a 4.18
 Shredded 12.63 a 3.08
 Bare 1.14 b 0.61
 Harvested 3.54 b 4.49
 Treatments with the same letter are not significantly different. Groups according to probability of means differences
 and alpha level (0.05).

 Significant differences were found between the covered treatments (Crimped and
 Shredded) and not-covered treatments (Harvested and Bare). There were no statistical
 differences found between covered and not covered. Crimped treatment showed higher
 variability, probably caused by early bedding of cereal rye in a random position before
 crimping.

 3.5. Mean Normal Stress
 The results of the statistical analysis of soil mean normal stress determined at 20 and
Agronomy 2023, 13, x FOR PEER REVIEW 11 of 14
 40 cm obtained in the four compared treatments after each passage of the tractor are shown
 in Figure 8.

 120
 a
 ab ab
 100 b
 Mean Normal Stress (kPa)

 a a
 a a
 80

 60

 40

 20

 0
 20 Depth (cm) 40

 Crimped Shreded Bare Harvested

 Figure 8. 8.Results
 Figure Resultsofofthe
 the statistical analysisofofmean
 statistical analysis mean normal
 normal stress
 stress (kPa).
 (kPa). Residual
 Residual standard
 standard errors errors
 were used on the bar error. Treatments with the same letter are not significantly different.
 were used on the bar error. Treatments with the same letter are not significantly different.

 Significantdifferences
 Significant differences were
 were found
 foundbetween
 between2020
 and
 and40 40
 cmcmdepth mean
 depth normal
 mean stress.stress.
 normal
 No statistical differences were found between treatment at 40 cm depth; only
 No statistical differences were found between treatment at 40 cm depth; only Harvested Harvested
 and Shredded can be considered different with p < 0.05. Strong variability was found in
 and Shredded can be considered different with p < 0.05. Strong variability was found in
 treatment Crimped at 20 cm depth, probably due to the spatial variability of rye biomass
 treatment Crimped at 20 cm depth, probably due to the spatial variability of rye biomass
 distribution caused by early crop bedding, before roller crimper passage. This effect could
 distribution
 be mitigatedcaused
 by theby early
 flail cropaction
 mower bedding, before Shredded,
 in treatment roller crimper passage.
 resulting in lessThis effect could
 variability
 be of
 mitigated by the flail mower action in treatment Shredded, resulting in less variability
 stress data.
 of stress data.

 4. Discussion
 4.1. Effect of Cover Crop Mulch
 The effect of cover crop mulch on soil compaction could be divided into three differ-
Agronomy 2023, 13, 686 11 of 14

 4. Discussion
 4.1. Effect of Cover Crop Mulch
 The effect of cover crop mulch on soil compaction could be divided into three different
 actions:
 First, the cover crop presence, growth and termination method affect soil moisture.
 The higher volumetric water content found in treatment (Harvested, Shredded) can be
 explained by the increased water retention gained through cover crop root penetration,
 while their exudates improved soil pore stability, which was consistent with the study by
 Angers and Caron [22]. In contrast to our initial hypothesis, Crimped treatment shows
 low volumetric water content in comparison to other mulched treatments, probably due
 to incomplete termination immediately after crimping. The cover crop died slowly in the
 days after crimping and, in the meantime, water transpiration from the soil continued,
 as established in previous research [23]. This phenomenon probably did not happen in
 Harvested and Shredded treatments where termination was achieved with a flail mower.
 This tool causes the immediate death of the plant by cutting and shredding the stem,
 decreasing soil moisture loss. Furthermore, we hypothesized that the lower variability
 found on Shredded treatment mulch biomass was explained by the spreading effect of
 the flail mower compared to Crimped treatment. The rolling action during crimping, on
 Crimped treatment, probably did not modify the biomass distribution, maintaining the
 mulch rooted to the ground
 Second, the root exudation and exploration change soil structure. The higher cone
 index on bare soil could be explained by the lack of cover crop root growing action, which
 stabilizes soil aggregates, mitigating the internal slaking of soil structure [24–26]. The
 internal slaking and the wetting and drying cycle cause the formation of a surface crust that
 could increase the susceptibility to soil compaction [25], resulting in increased penetration
 resistance, as observed in zero traffic; there was no difference in the cone index between all
 treatments, and there was an increase in the cone index in “Bare” after the traffic events.
 Indeed, the Bare treatment did not have a different soil moisture level compared to Crimped,
 but did record a higher cone index. The higher cone index in Bare could explain the slower
 increasing in bulk density compared to the cover cropped treatment, due to the phenomena
 described above.
 Third are the surface residues. Indeed, “Shredded” resulted in 16.54% lower mean
 normal stress compared to “Harvested” treatment, and this finding could be explained
 by the surface residues effects. Moreover, this residues effects result was higher than a
 previous experiment on the effect of residues on soil compaction [10]. The differences
 recorded between “Shredded” and “Crimped” treatments suggest a different behaviour of
 the two cover crop termination methods considered in this experiment. This effect can be
 also divided to obtain a deep analysis on the direct residues effects on force transfer during
 traffic and on the effect of the termination method on soil bearing capacity, as analysed in
 the previous point. In this experiment, the strong variability found in “Crimped” limited
 the analysis of the residues effect.
 All of this action at different magnitudes affects the soil compaction, but the main
 effects could be considered the change in soil structure. This could be explained by bulk
 density results during traffic events. Indeed, treatment with higher moisture content
 resulted in higher bulk density because higher soil moisture content increased the risk of
 soil compaction. The significant—but lower—difference in soil moisture (
Agronomy 2023, 13, 686 12 of 14

 4.2. Effect of Repeated Traffic
 All of the soil analyses highlight an increased susceptibility to soil compaction during
 multiple trafficking, especially comparing all the trafficked treatments with the zero traffic
 event. The VWC at zero traffic was significantly lower than after the other traffic events,
 probably due to a concentration effect caused by the loss of air-filled macroporosity. More-
 over, the cone index had an average increase of 30.41% after the first traffic event and of
 9.11% between the third and fifth traffic events. The rut profile area increased about 9.11%
 on the first wheeling and maintained a constant average increase of 8.86% for every traffic
 treatment. Cone index and rut profile analysis showed no difference between the first and
 third passages. Otherwise, bulk density significantly increased (7.21%) between zero and
 one passages and also between one and three traffic events (2.95%). These findings were
 aligned to the result obtained in other studies [27–29]. The repeated traffic effect on soil
 compaction was more relevant after five traffic events and less influenced by the residues
 effect. Indeed, no differences were found between different mulch treatments on soil bulk
 density after five traffic events.

 5. Conclusions
 Cover crop mulch can, in some cases, dissipate part of the machine load during traffic,
 but this effect could already be negligible with 4 Mg of tractor traffic. The residues effect
 changes with cover crop termination methods and affects soil susceptibility to compaction
 in different ways and magnitudes, first on soil water content. The use of a roller crimper
 could cause a slow cover crop termination that seems to determine an increase in the
 amount of water used by the cover crop during its life cycle and a decrease in soil water
 availability. Furthermore, the cover crop roots improve soil water retention, resulting in
 higher moisture content if termination occurs early in the season and according to the
 termination method. Moreover, the termination method affects the residue bearing capacity,
 and in some cases, counterbalances the lower soil bearing capacity with lower soil stress
 due to higher moisture content. Finally, the use of a cover crop can affect the soil structure,
 decreasing the penetration resistance and resulting in an easier soil penetration during the
 following operations, such as no-till planting or tillage. The findings of this study confirmed
 the results obtained in previous research, but underlined the variability of residues effects
 due to different soil conditions and cover crop termination methods. However, taking into
 account the limited load adsorbed by the surface residues layer, further studies are needed
 to increase the knowledge on how residues interact on soil compaction with light loads,
 as happens on a no-till planter closing wheel, where a compacting action was needed and
 could be disturbed by different types of residues.

 Author Contributions: Conceptualization, M.B.; methodology, M.B. and F.G.; software, M.B.; val-
 idation, M.B., F.G. and L.S.; formal analysis, M.B., F.G. and K.L.; data curation, M.B. and L.G.;
 writing—original draft preparation, M.B.; writing—review and editing, L.G. and A.P.; supervision,
 A.P. and L.S.; project administration, L.S.; funding acquisition, L.S. All authors have read and agreed
 to the published version of the manuscript.
 Funding: This research was completed during a PhD scholarship founded by IBF Servizi s.p.a.
 Data Availability Statement: Data presented in this study are available on request from the corre-
 sponding author.
 Acknowledgments: The authors acknowledge Roberto, Angelica, Marco, Francesco and all the
 workers of the experimental farm for the support given during the experimental activity.
 Conflicts of Interest: The authors declare no conflict of interest.
Agronomy 2023, 13, 686 13 of 14

References
1. Osman, K.T. Physical Deterioration of Soil BT. In Soil Degradation, Conservation and Remediation; Osman, K.T., Ed.; Springer:
 Dordrecht, The Netherlands, 2014; pp. 45–67, ISBN 978-94-007-7590-9.
2. Soane, B.D.; van Ouwerkerk, C. Soil Compaction Problems in World Agriculture. In Soil Compaction in Crop Production-
 Developments in Agricultural Engineering 11; Elsevier: Amsterdam, The Netherlands, 1994; pp. 1–21.
3. Keller, T.; Lamandé, M.; Schjønning, P.; Dexter, A.R. Analysis of soil compression curves from uniaxial confined compression
 tests. Geoderma 2011, 163, 13–23. [CrossRef]
4. Batey, T. Soil compaction and soil management—A review. Soil Use Manag. 2009, 25, 335–345. [CrossRef]
5. ten Damme, L.; Stettler, M.; Pinet, F.; Vervaet, P.; Keller, T.; Munkholm, L.J.; Lamandé, M. Construction of modern wide,
 low-inflation pressure tyres per se does not affect soil stress. Soil Tillage Res. 2020, 204, 104708. [CrossRef]
6. Antille, D.L.; Peets, S.; Galambošová, J.; Botta, G.F.; Rataj, V.; Macak, M.; Tullberg, J.N.; Chamen, W.C.T.; White, D.R.; Misiewicz,
 P.A.; et al. Review: Soil compaction and controlled traffic farming in arable and grass cropping systems. Agron. Res. 2019, 17,
 653–682. [CrossRef]
7. Poltorak, B.J.; Labelle, E.R.; Jaeger, D. Soil displacement during ground-based mechanized forest operations using mixed-wood
 brush mats. Soil Tillage Res. 2018, 179, 96–104. [CrossRef]
8. Ess, D.R.; Vaughan, D.H.; Perumpral, J.V. Crop residue and root effects on soil compaction. Trans. ASAE 1998, 41, 1271–1275.
 [CrossRef]
9. Holthusen, D.; Brandt, A.A.; Reichert, J.M.; Horn, R.; Fleige, H.; Zink, A. Soil functions and in situ stress distribution in subtropical
 soils as affected by land use, vehicle type, tire inflation pressure and plant residue removal. Soil Tillage Res. 2018, 184, 78–92.
 [CrossRef]
10. Gupta, S.C.; Schneider, E.C.; Larson, W.E.; Hadas, A. Influence of corn residue on compression and compaction behavior of soils.
 Soil Sci. Soc. Am. J. 1987, 51, 207–212. [CrossRef]
11. Reichert, J.M.; Brandt, A.A.; Rodrigues, M.F.; Reinert, D.J.; Braida, J.A. Load dissipation by corn residue on tilled soil in laboratory
 and field-wheeling conditions. J. Sci. Food Agric. 2016, 96, 2705–2714. [CrossRef]
12. Cherubin, M.R.; Franchi, M.R.A.; de Lima, R.P.; de Moraes, M.T.; Luz, F.B. da Sugarcane straw effects on soil compaction
 susceptibility. Soil Tillage Res. 2021, 212, 105066. [CrossRef]
13. Piccoli, I.; Sartori, F.; Polese, R.; Berti, A. Crop yield after 5 decades of contrasting residue management. Nutr. Cycl. Agroecosystems
 2020, 117, 231–241. [CrossRef]
14. Dal Ferro, N.; Piccoli, I.; Berti, A.; Polese, R.; Morari, F. Organic carbon storage potential in deep agricultural soil layers: Evidence
 from long-term experiments in northeast Italy. Agric. Ecosyst. Environ. 2020, 300, 106967. [CrossRef]
15. Bolling, I. Bodenverdichtung und Triebkraftverhalten bei Reifen-Neue Meß-und Rechenmethoden; Lehrstuhl für Landmaschinen,
 Technische Universität: München, Germany, 1987.
16. Berli, M.; Eggers, C.G.; Accorsi, M.L.; Or, D. Theoretical Analysis of Fluid Inclusions for In Situ Soil Stress and Deformation
 Measurements. Soil Sci. Soc. Am. J. 2006, 70, 1441–1452. [CrossRef]
17. Défossez, P.; Richard, G.; Boizard, H.; O’Sullivan, M.F. Modeling change in soil compaction due to agricultural traffic as function
 of soil water content. Geoderma 2003, 116, 89–105. [CrossRef]
18. Keller, T.; Ruiz, S.; Stettler, M.; Berli, M. Determining Soil Stress beneath a Tire: Measurements and Simulations. Soil Sci. Soc. Am.
 J. 2016, 80, 541–553. [CrossRef]
19. de Lima, R.P.; Keller, T. Impact of sample dimensions, soil-cylinder wall friction and elastic properties of soil on stress field and
 bulk density in uniaxial compression tests. Soil Tillage Res. 2019, 189, 15–24. [CrossRef]
20. Kirby, J.M. Soil stress measurement: Part I. Transducer in a uniform stress field. J. Agric. Eng. Res. 1999, 72, 151–160. [CrossRef]
21. Naderi-Boldaji, M.; Alimardani, R.; Hemmat, A.; Sharifi, A.; Keyhani, A.; Tekeste, M.Z.; Keller, T. 3D finite element simulation of
 a single-tip horizontal penetrometer-soil interaction. Part II: Soil bin verification of the model in a clay-loam soil. Soil Tillage Res.
 2014, 144, 211–219. [CrossRef]
22. Angers, D.A.; Caron, J. Plant-induced changes in soil structure: Processes and feedbacks. Biogeochemistry 1998, 42, 55–72.
 [CrossRef]
23. Mischler, R.A.; Curran, W.S.; Duiker, S.W.; Hyde, J.A. Use of a Rolled-rye Cover Crop for Weed Suppression in No-Till Soybeans.
 Weed Technol. 2010, 24, 253–261. [CrossRef]
24. Chen, G.; Weil, R.R. Root growth and yield of maize as affected by soil compaction and cover crops. Soil Tillage Res. 2011, 117,
 17–27. [CrossRef]
25. Kooistra, M.J.; Tovey, N.K. Effects of Compaction on Soil Microstructure. In Developments in Agricultural Engineering; Elsevier:
 Amsterdam, The Netherlands, 1994.
26. Roberson, E.B.; Firestone, M.K.; Sarig, S. Cover Crop Management of Polysaccharide-Mediated Aggregation in an Orchard Soil.
 Soil Sci. Soc. Am. J. 1991, 55, 734–739. [CrossRef]
27. Seehusen, T.; Riggert, R.; Fleige, H.; Horn, R.; Riley, H. Soil compaction and stress propagation after different wheeling intensities
 on a silt soil in South-East Norway. Acta Agric. Scand. Sect. B Soil Plant Sci. 2019, 69, 343–355. [CrossRef]
Agronomy 2023, 13, 686 14 of 14

28. ten Damme, L.; Schjønning, P.; Munkholm, L.J.; Green, O.; Nielsen, S.K.; Lamandé, M. Soil structure response to field traffic:
 Effects of traction and repeated wheeling. Soil Tillage Res. 2021, 213, 105128. [CrossRef]
29. Pulido-Moncada, M.; Munkholm, L.J.; Schjønning, P. Wheel load, repeated wheeling, and traction effects on subsoil compaction
 in northern Europe. Soil Tillage Res. 2019, 186, 300–309. [CrossRef]

Disclaimer/Publisher’s Note: The statements, opinions and data contained in all publications are solely those of the individual
author(s) and contributor(s) and not of MDPI and/or the editor(s). MDPI and/or the editor(s) disclaim responsibility for any injury to
people or property resulting from any ideas, methods, instructions or products referred to in the content.
You can also read