How One City is using FDR to Address its Pavement Problems - 2019 Full-Depth Reclamation Symposium
←
→
Page content transcription
If your browser does not render page correctly, please read the page content below
How One City is using
 FDR to Address its
 Pavement Problems

               April 25, 2019
  2019 Full-Depth Reclamation Symposium
Presentation Overview Existing Street Network, Funding Trends, and Existing Pavement Condition in Rocky Mount. What is FDR? The Rocky Mount experience.
Street Network, Then & Now City maintains approximately 280 mile network of paved and unpaved streets NCDOT maintains 121 miles of streets within Rocky Mount Based on 2007 Pavement Condition Survey, average PCI for the street network is 81. Approximately 35 miles of streets with PCI < 60 (low fair, approaching poor)
Street Network, Then & Now Based on preliminary budget estimates, streets with PCI < 60 comprise over 78% of the repair costs for the existing network Although draft of 2018 Pavement Condition Survey reflect an average network PCI of 71, a difference in methodologies is likely to account for a majority of the differences. Sections of roadways treated with FDR since FY 2009 are holding up very well.
Funding Trends Steadily declining Powell Bill reimbursements and escalating costs have severely constrained major maintenance activities such as resurfacing Source: NCDOT Program Development Branch (Benson and Al-Ghandour – 2014)
Funding Trends Steadily declining Powell Bill reimbursements and escalating costs have severely constrained major maintenance activities such as resurfacing
Source: NCDOT Pavement Construction Section
Pavement Management The City conducts a pavement condition survey on 10 year cycles and uses the data in a Pavement Management Program to prioritize maintenance needs and determine the best strategy for use of limited maintenance funds. Have historically relied on more of a worst-first strategy, but due to shrinking revenues the city is seeking to transition to an approach that optimizes allocation of resources based on life cycle cost. Alternative strategies will be needed to allocate limited funding available to meet pavement preservation and rehabilitation needs.
State of the Network in 2007
Percentage within Each PCI Range
50.0%
45.0%
40.0%
35.0%
30.0%
25.0%
20.0%
15.0%
10.0%
5.0%
0.0%
Good Satisfactory Fair Poor Very Poor Serious Failed
45.6% 32.3% 11.9% 6.8% 2.6% 0.8% 0.0%
Average network PCI value = 81
“Satisfactory” overall condition
Approximate pavement value = $200MState of the Network in 2007, Overall
Very Poor
2.8%
Poor Serious
Fair 7.3% 0.1%
Good
13.2%
48.1%
Satisfactory
28.5%
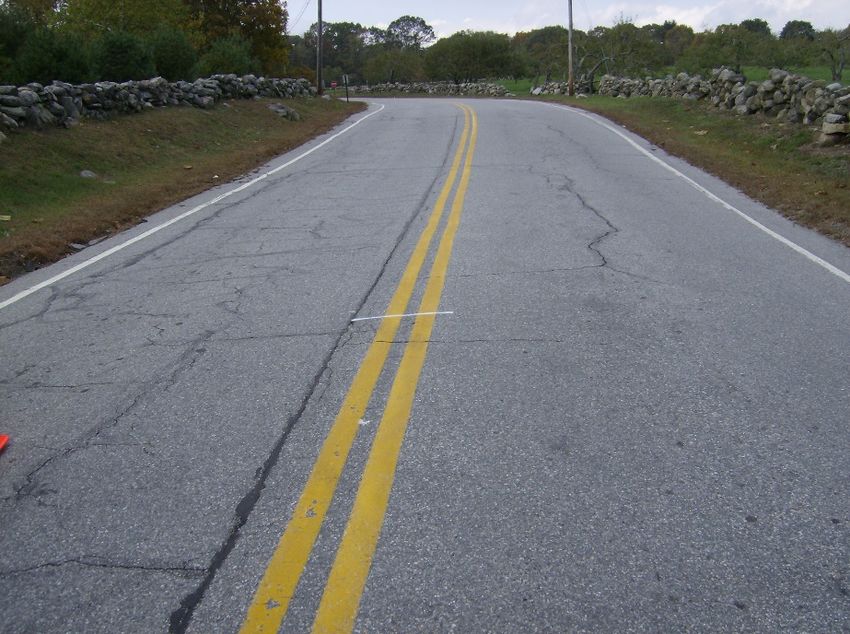
~90% of the network in fair or better condition.Examples – Good (86-100)
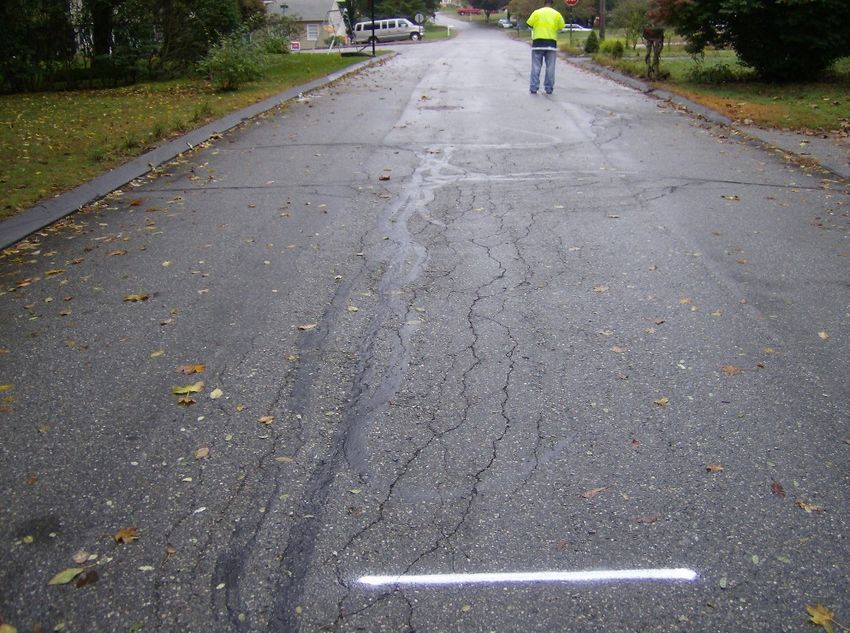
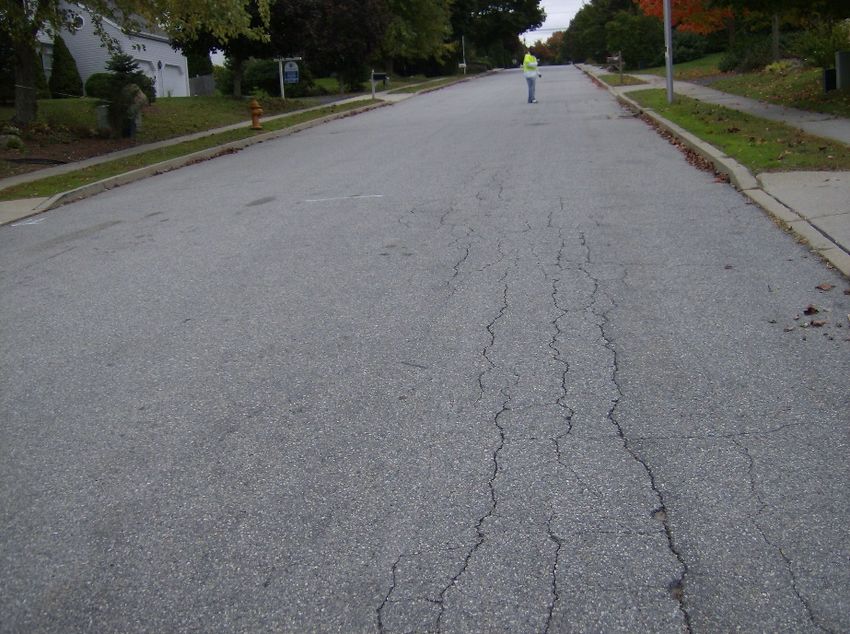
Examples – Fair (56-70)
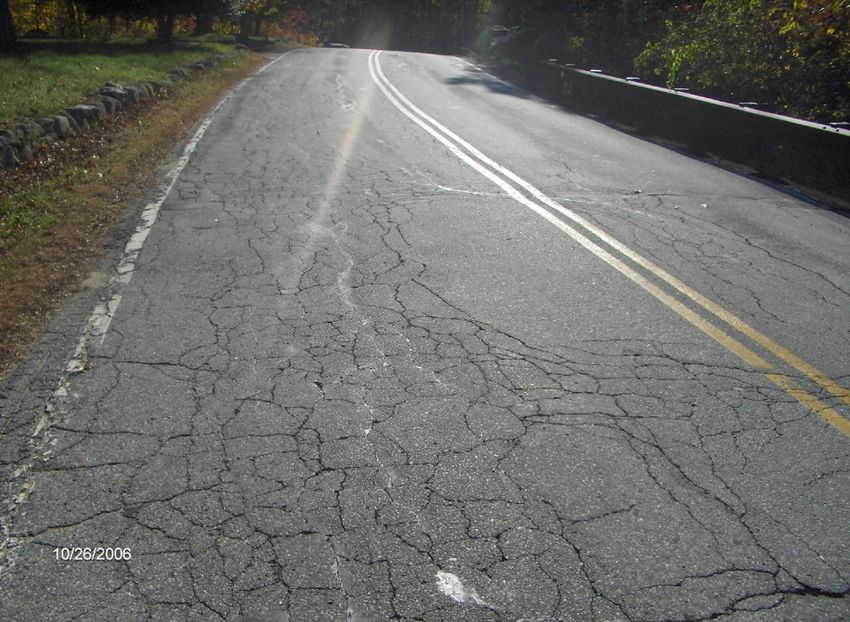
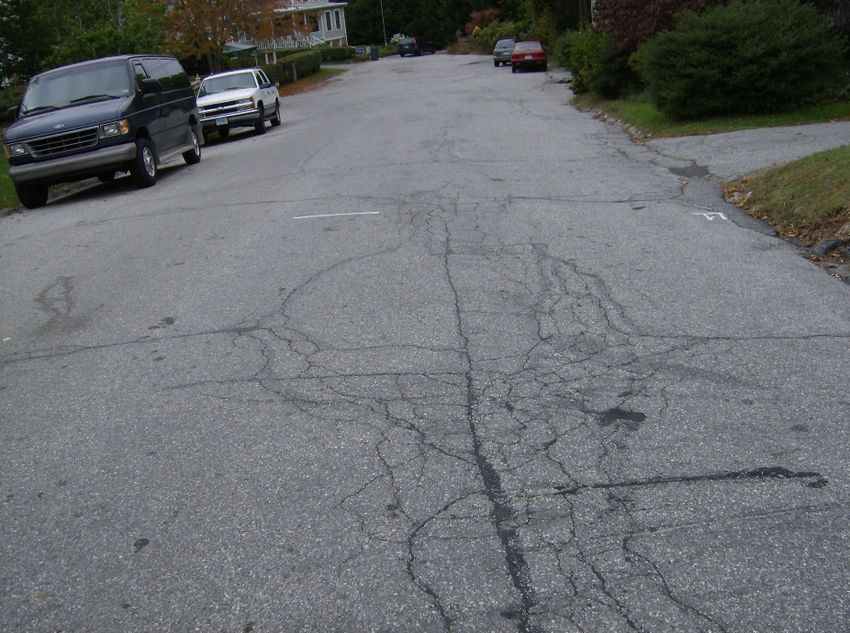
Examples – Poor (41-55)
Examples – Serious / Failed (0-25)
Preventative Maintenance Concept
                   75 % Time
   Excellent
                                              40% Quality Drop

      Good
                                                        Each $1 in Repair
                                                        Cost here…
       Fair

                      40% Quality Drop                           Will Cost $4 -
       Poor
                                                                 $10 if Delayed
                                                                 to Here

                                         18 % Time
   Very Poor

               4        8              12              16

                      Pavement Age in Years
Percentage of Centerline Miles
0%
10%
20%
30%
40%
50%
60%
70%
Do
N
ot
hi
ng
Pr
ev
en
t iv
e
1"
Re
su
rfa
cin
g
M
ill
&
R
M&R Activities
es
ur
fa
ce
Re
co
ns
tru
ct
io
n
Percentage of Cost
0%
10%
20%
30%
40%
50%
60%
70%
Do
N
ot
hi
ng
M&R Needs/Backlog
Pr
ev
en
t iv
e
1"
Re
su
rfa
cin
g
M
ill
&
R
M&R Activities
es
ur
fa
ce
Re
co
ns
tru
ct
io
nInvestment Scenarios (2007)
100
90
80
Area-Weighted Network PCI
70
60
50
40
30 No M&R
Current Funding, $1.18mil/yr
20
Maintain Performance, $3.9mil/yr
10 Clear Backlog, $4.6mil/yr
0
2006 2007 2008 2009 2010 2011 2012 2013 2014 2015 2016
YearPotential Strategies Re-evaluate pavement design guidelines to increase anticipated service life. Account for cost of binder in contract. Explore more cost effective approaches to preserve and rehabilitate pavements.
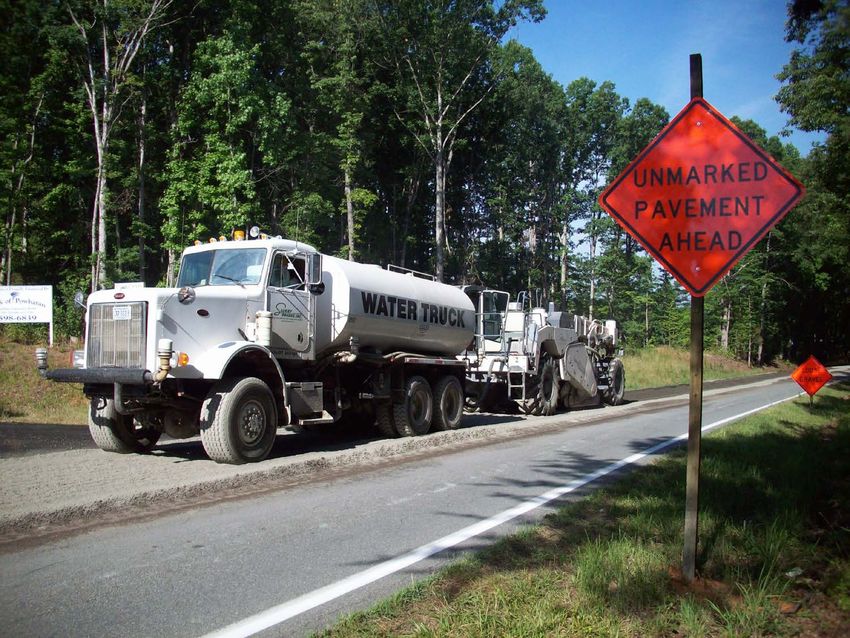
FDR – A NEW DEAL IN ROCKY MOUNT
What is FDR? Pavement rehabilitation technique in which the full flexible pavement section and a predetermined portion of the underlying materials are uniformly crushed, pulverized, and blended into a homogenized stabilized base course. Further stabilization may be obtained through the use of additives.
FDR versus CIR and HIR Primary difference between FDR and cold in-place recycling or hot in-place recycling is penetration into the material beneath the flexible pavement section FDR is less susceptible to reflective cracking due to an existing base failure FDR enhances the overall pavement structure due to a strengthened base.
What is FDR?
Typical Additives used with FDR
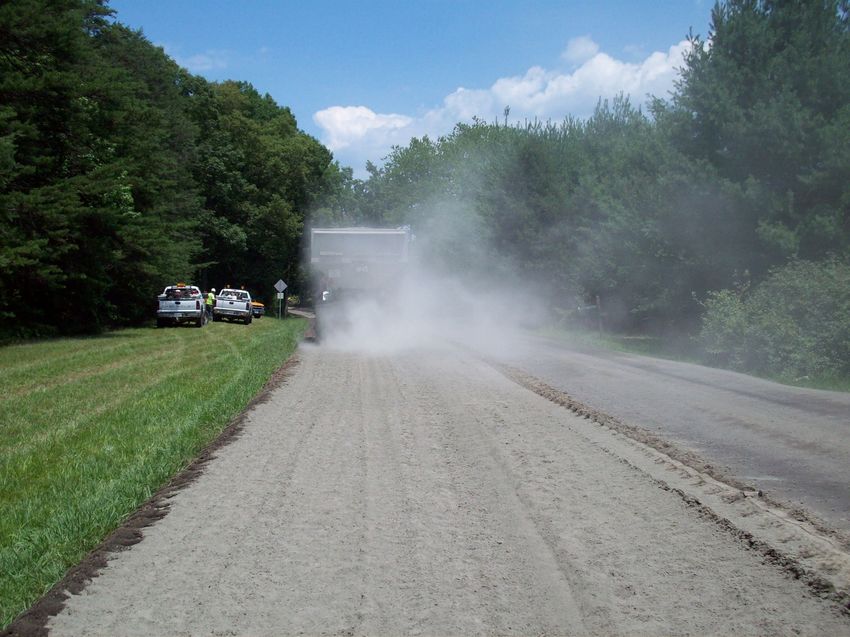
Process
for
Cement Modified
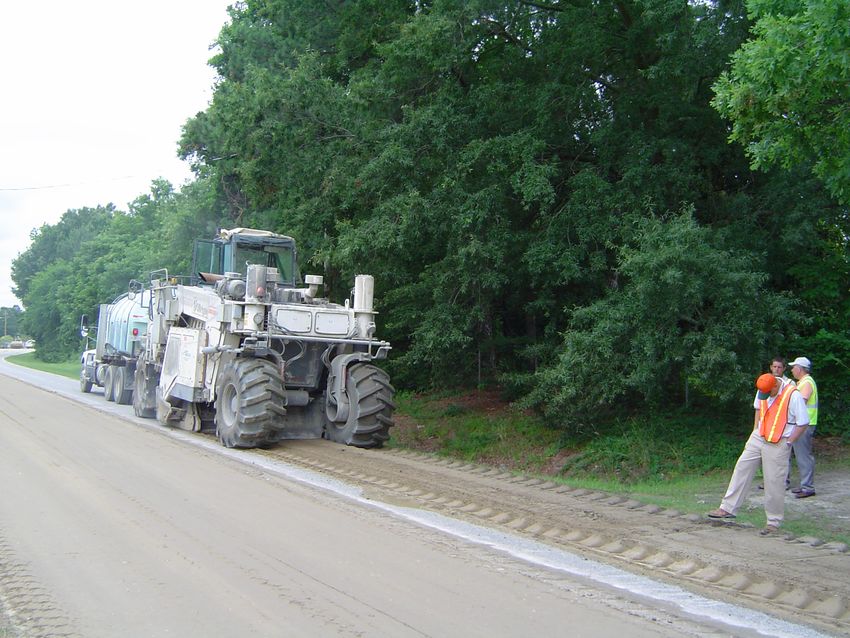
Full Depth ReclamationStep 1: Initial Pulverization
Step 2: Initial Grading
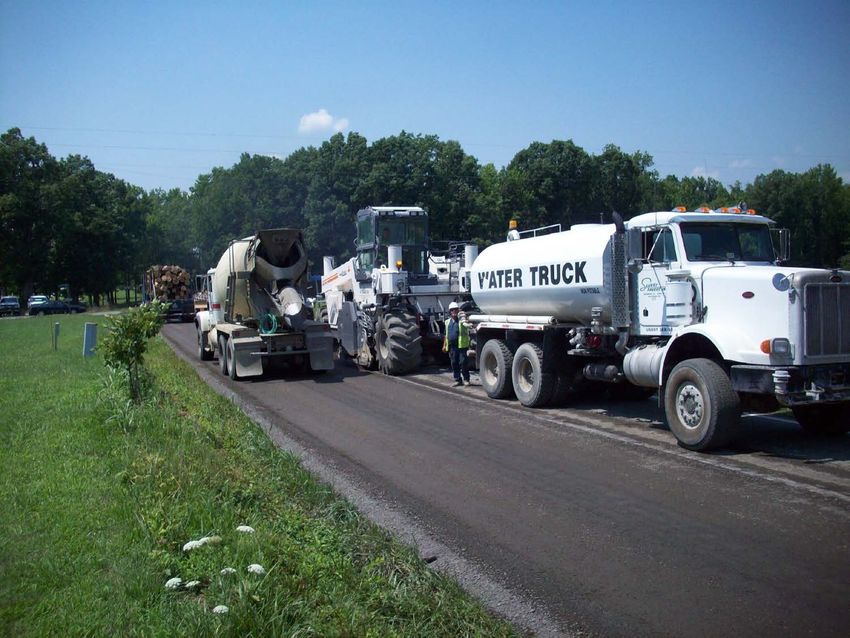
Step 3: Adding
   Cement
Step 4: Final Grading,
Compaction, & Curing
Step 6: Paving
Selection of Street
Sections for FDR Pilot
       Project
Initial Screening FDR considered for one location requiring reconstruction and locations with high percentage of patching Streets proposed for resurfacing were evaluated to determine the quantities of patching required Cost of patching was compared to the cost of FDR for the entire street section based on a FDR cost of $7/SY. FDR appeared to be cost effective when full depth patching exceeded 25% of the street surface area. 10 street sections with patching needs in excess of 25% were selected for further evaluation based on the amount of patching required.
Evaluation of Selected Streets GeoTechnologies, Inc. was retained to evaluate the pavement sections for the candidate locations and provide recommendations for pavement design and FDR formulation. Existing pavement/base course thicknesses and CBR values were highly variable but all candidate streets were determined to be viable for cement modified FDR. Structural coefficient of 0.2 was used for the reclaimed base material in the pavement design. Subgrade CBR values ranged between 3 and 30.
Evaluation of Selected Streets Recommended cement content for the reclaimed base course ranged between 3 and 4.5% by weight. Higher contents typically used with STBC. Recommended pavement thickness (S9.5B) ranged between 1.5” and 3”. 3” surface course was utilized on FDR section of 5,023 ft minor arterial street that included widening to add a center turn lane in front of an elementary school. Work was completed in less than 2 weeks
Other Considerations Thickness and quality of existing asphalt, base course and subgrade will impact the quality of the reclaimed base. Excessive volumes of high plasticity soils in the reclaimed base will reduce strength and increase risk of moisture infiltration. May need to consider combination of additives. Small amounts of soil may be incorporated into the reclaimed base course provided they have very low plasticity.
Other Considerations Reclaimed base must be thoroughly blended and asphalt needs to be broken into pieces no more than 3” in diameter. Multiple passes may be required. Compaction and grading of stabilized base needs to be completed with 4 hours of addition of cement. Moisture content needs to be within 2% of optimum. Compaction of stabilized base should be 98% of Standard Proctor Maximum Dry Density. Ideally, paving should follow within 24 hours unless material can be kept wet or seal coated to trap moisture and facilitate curing.
Other Considerations
Depth of utilities (including storm drains)
Age and type of utility pipe.
Vibration off milling operations could crack pipes or
failed joints
Excessive moisture in subgrade could cause
problems for equipment
Give adjacent property owners adequate notice
prior to beginning work (we required 72 hours).FDR Recommendations
Location Length C&G/SP Surface Course Base Course CBR PCI FDR Depth New Surface
Dana Ln 2100 SP 1.5" AC 5" CABC 7 21 7" 2" S9.5B
Englewood Dr 380 C&G 3.5" AC 6.5" CABC 4 65 9" 2" S9.5B
Nicodemus Mile Rd 3500 SP 2.5" AC 7.25" STBC 9 32 8" 3" S9.5B
Southern Blvd 450 SP 2.5 " AC 8" STBC 50 56 8" 2" S9.5A
Stokes St 400 C&G 2.5" AC 8" CABC 10 60 12" 2.25" I19, 1.25" S9.5B
Wellington Dr 2700 SP 3" AC 6" CABC 5 32 8" 2" S9.5A
Davis St 1040 C&G 3.8" AC 5" STBC 12 55 8" 1.5" S9.5B
Grace St 1450 C&G 3.25" AC 5.5" STBC 25 60 9" 2" S9.5B
Fenner Rd 2600 SP 3.5" AC 8" CABC 4 65 9" 3" S12.5BStreets Deleted After Start of Project
Davis St, S. Grace St.
Concern over damaging AC and lead joint pipe
Fenner Rd
Sections of extremely thick asphalt and spot locations
of very poor subgrade
Starling Way
Spot locations of clay subgrade missed in core
sampling and highly saturated subgrade and would not
support milling machineStreets Added After Start of Project
Mansfield Dr, Augustus Dr, Southern Blvd
All streets were ditch sections with highly degraded
pavement and soil type base course or a thin stone
base.
Experience on previous sections had provided a high
level of confidence in using FDR on these types of
street sectionsProblems Encountered
Shallow Storm Drain
Blind junction and RCP less than 8” of cover discovered with the milling
machine
Crown section needs to be graded into the reclaimed base course
before mixing in cement
Once cement has set up it can’t be re-graded. Problem was remedied
after the first street
Weak spots
Locations of weak subgrade or high moisture resulted in spot locations of
weakness. Re-milling with additional depth and cement bridged these
locations.
Proof-roll after 7 days and/or prior to resurfacing to identify weak spots in
base and sub-base.
Traffic Control
More intensive than patching, but not as problematic as reconstruction.Summary of FDR Completed/Proposed
FY 2009 FDR
FY 2011 FDR
FY 2013 FDR
FY 2015 FDR
FY 2019
Candidate FDR Locations
Summary FDR has worked very well on ditch section streets. Curb and gutter sections tend to have utility conflicts and require removal of excess material to allow for matching to curb. Be aware of subgrade moisture and be prepared to encounter spot locations of week subgrade. May need to increase mill depth and introduce additional cement. Streets reclaimed with FDR since FY09 have a much stronger pavement section than the original. Use of FDR versus reconstruction is less costly and resulted in a minimal impact on traffic compared to reconstruction. Work has been done with lane closures and streets remained open to local traffic. Reclamation typically took 3-4 days per section.
Summary … Quality Control Adequate pulverization Proper cement content Proper moisture content Adequate density Adequate curing Secure the services of a experienced geotechnical firm to assist with pavement assessment and monitoring the FDR rehabilitation process. Expect and be prepared for changes. Communicate, communicate, communicate (up, down, and sideways).
Questions?
       Jonathan Boone, P.E.
Director of Public Utilities & Facilities
            Nash County
jonathan.boone@nashcountync.gov
          (o) 252-462-2613
You can also read