HOW ROBOTS CHANGE THE WORLD - WHAT AUTOMATION REALLY MEANS FOR JOBS AND PRODUCTIVITY JUNE 2019 - Oxford Economics
←
→
Page content transcription
If your browser does not render page correctly, please read the page content below

HOW ROBOTS
CHANGE
THE WORLD
WHAT AUTOMATION REALLY MEANS
FOR JOBS AND PRODUCTIVITY

JUNE 2019
Fieldwork Robotics trialling
a robot raspberry harvesting
system on a British farm, 2019.
How Robots Change the World

TABLE OF CONTENTS
                              Foreword                                                     3

                              Executive summary                                            4

                              Introduction                                                 11

                              What drives the robot rise?                                  13
                              Three reasons for the robot surge                            16

                              The impact of robots on manufacturing jobs                   19
                              Global impacts                                               19
                              Regional impacts                                             22

                              The Robot Vulnerability Index                                25
                              United States                                                27
                              Germany                                                      28
                              United Kingdom                                               29
                              France                                                       30
                              Japan                                                        31
                              South Korea                                                  32
                              Australia                                                    33

                              The robotics dividend                                        35
                              Reshaping the labour market                                  37

                              Robots are coming to the service sector                      40
                              The future impact of robots on five key service industries   43
                              Where service robots go from here                            49

                              How to respond to the rise of robots                         51
                              A framework for action                                       53

                              Appendix: econometric analysis                               56

                                                                                                1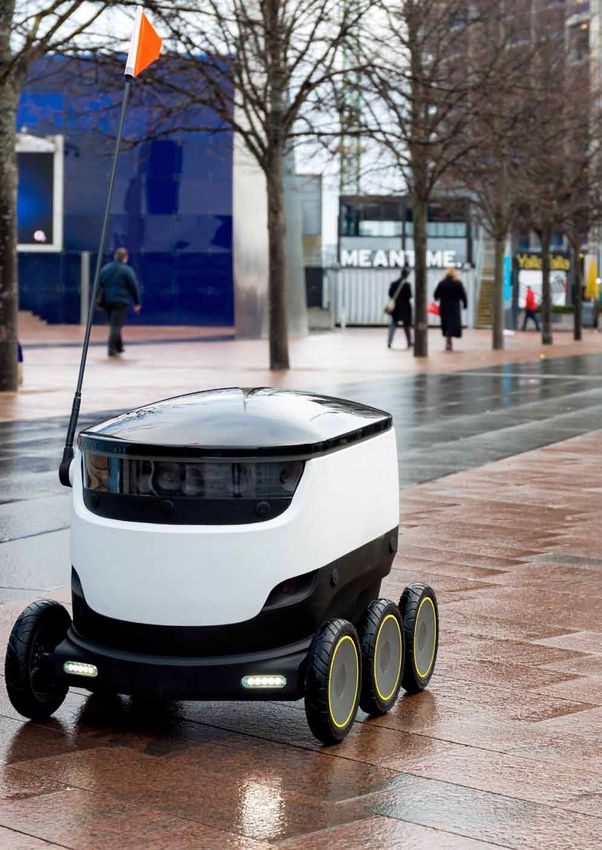

How Robots Change the World

FOREWORD:
The Shape of Things to Come
                              The robotics revolution is         on poorer local economies. In
                              rapidly accelerating, as fast-     many places, the impact will
                              paced technological advances       aggravate social and economic
                              in automation, engineering,        stresses from unemployment
                              energy storage, artificial         and income inequality in times
                              intelligence, and machine          when increasing political
                              learning converge. The result      polarisation is already a
                              will transform the capabilities    worrying trend.
                              of robots and their ability to
                              take over tasks once carried       At Oxford Economics our
                              out by humans.                     mission is to help our clients
                                                                 better understand an ever-
                              The number of robots in            more complex and fast-
Adrian Cooper                 use worldwide multiplied           changing world economy, in
CEO and Chief Economist       three-fold over the past two       all its dimensions—and how to
Oxford Economics              decades, to 2.25 million. Trends   successfully operate in it. Our
                              suggest the global stock of        clients look to us to explain the
                              robots will multiply even faster   forces shaping their economic
                              in the next 20 years, reaching     environment, help them
                              as many as 20 million by 2030,     anticipate the future, and plan
                              with 14 million in China alone.    for its uncertainties.
                              The implications are immense,
                              and the emerging challenges        That is why we brought
                              for governments and policy-        together a team of our
                              makers are equally daunting in     economists, econometricians,
                              their scale.                       modellers and technology
                                                                 experts from across our
                              The rise of the robots will        worldwide network of over
                              boost productivity and             250 analysts to conduct an
                              economic growth. It will lead,     extensive research study
                              too, to the creation of new        to analyse the robotics
                              jobs in yet-to-exist industries,   phenomenon. We are pleased
                              in a process of ‘creative          to share our findings not
                              destruction.’ But existing         only with our clients but with
                              business models across many        all who want to understand
                              sectors will be seriously          the implications of one of
                              disrupted. And tens of millions    the most profound shifts
                              of existing jobs will be lost,     the world economy will
                              with human workers displaced       experience this century.
                              by robots at an increasing rate
                              as robots become steadily
                              more sophisticated.

                              For both people and
                              businesses, the effects of these
                              job losses will vary greatly
                              across countries and regions,
                              with a disproportionate toll
                              on lower-skilled workers and

                                                                                                3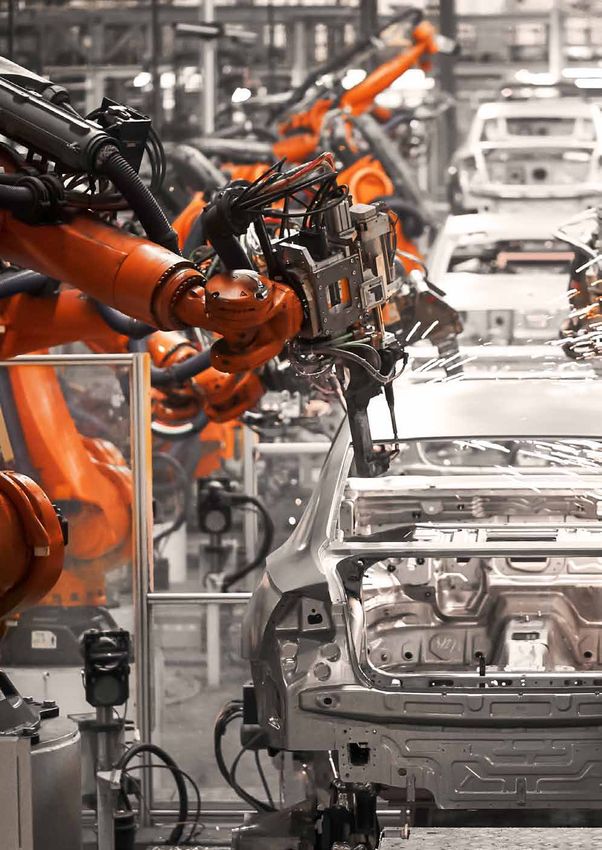
How Robots Change the World

       EXECUTIVE SUMMARY

                    20m
                                                             Over the past decade, a robotics revolution has captured the
                                                             world’s imagination. As their capabilities expand, so does the
                                                             rate at which industries purchase and install these increasingly
                                                             intelligent machines. Since 2010, the global stock of industrial
                                                             robots has more than doubled—and innovations in engineering
  Number of manufacturing                                    and machine learning portend an accelerated adoption of robots
                                                             in service sector occupations over the next five years.
jobs that could be displaced
      by industrial robots by                                This report sheds new light on both the current impact of robots
   2030—8.5% of the global                                   on manufacturing jobs around the world and the potential
                                                             for robots to transform the much larger (but as-yet far less
  manufacturing workforce.                                   automated) global services sector. To evaluate the implications
                                                             of this ongoing robot revolution, we have brought together
                                                             the combined expertise of Oxford Economics’ economists,
                                                             econometricians, modellers, and subject-matter experts.

                                                             The rise of robots has already had a profound effect on
                                                             industrial employment around the world: today, approximately
                                                             one of every three new manufacturing robots is being installed
                                                             in China, the world’s great workshop. Our econometric
                                                             modelling finds that on average each newly installed robot
                                                             displaces 1.6 manufacturing workers. By 2030, we estimate that 1

                                                             as many as 20 million additional manufacturing jobs worldwide
                                                             could be displaced due to robotization.                            2

                                                             Lower-income regions are more at risk
                                                             This great displacement will not be evenly distributed around
                                                             the world, or within countries. Our research shows that the
                                                             negative effects of robotization are disproportionately felt in
                                                             the lower-income regions of the globe’s major economies—on
                                                             average, a new robot displaces nearly twice as many jobs in
                                                             lower-income regions compared with higher-income regions
                                                             of the same country. At a time of worldwide concern about
                                                                                                3

                                                             growing levels of economic inequality and political polarisation,
                                                             this finding has important social and political implications.

                                                             Given the stakes, policy-makers need an early warning system
                                                             to help them mitigate the risks of automation on employment.
                                                             As part of this study, we have developed a Robot Vulnerability
                                                             Index that ranks every region of seven developed economies in
                                                             terms of how susceptible their respective workforces are to the
                                                             installation of industrial robots (see page 18).

       4    1
                This finding is based on an analysis of a large, regional panel-dataset of robot stock, and other labour market indicators, over a 11 year timeframe, for 24
                                            EU countries (minus Croatia, Cyprus, Luxembourg and Malta), along with Norway, the United States, Japan, and South Korea.
                2
                 Countries included in this estimate account for more than 90% of industrial robot installations: EU 28, US, Japan, South Korea, Australia, China, Taiwan,
                  Thailand, Mexico, India, Canada, Singapore, Brazil, Turkey, Malaysia. We assume the rate of robot installations in manufacturing up to 2030 follows the
                                   latest projections by the International Federation of Robotics, and we also account for long-term depreciation of existing robot stock.
                  3
                    Throughout this report, higher- and lower-income regions are defined as those with average household income levels above and below the national
                                                                                                                                                       average, respectively.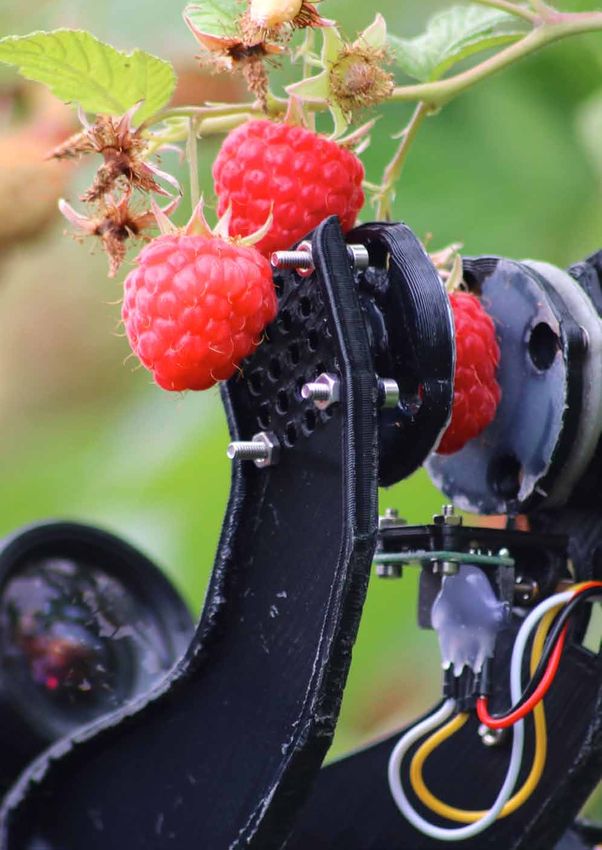
How Robots Change the World

In many cases, our Index highlights that the most vulnerable
regions are somewhat removed from the wealthier districts of
their home countries—such as Cumbria in the UK, Franche-
                                                                                                                         Our research shows
Comté in France, and the high desert of Eastern Oregon in the                                                            the negative effects
US. These rural regions often include towns or cities with strong                                                        of robotization are
manufacturing heritages that play a surprisingly large part in the
regional economy. In contrast, regions that surround knowledge-
                                                                                                                         disproportionately felt in
intensive cities, such as Toulouse and Grenoble in France, or                                                            the lower-income regions
Munich and Stuttgart in Germany, typically show much lower                                                               of major economies.
levels of vulnerability to the rise of the robots. This is also true of
capital cities such as London, Paris, Seoul, and Tokyo.

Fig.1: Job losses from robots hit lower-income regions harder                                                  4

Change in number of jobs due to one additional robot

                                       -1.6                                                                              Average
                                                                                                                         effect

                                                                                                                         Lower-
              -2.2                                                                                                       income
                                                                                                                         regions

                                                                                                                         Higher-
                                                   -1.3                                                                  income
                                                                                                                         regions

       -2.5                 -2.0                  -1.5                  -1.0                 -0.5                  0.0
                  Long-term impact                            Short-term impact

Source: Oxford Economics

4
    Our modelling differentiates between a “short-term” effect, within the year of a robot installation, and a longer-term effect that builds over 10 to 15 years.   5
How Robots Change the World

                           The $5 trillion robotics dividend
                           While regional impacts vary, fears about permanent global job
 As the pace of robotics   destruction generated by robots appear somewhat exaggerated.
     adoption quickens,    Our study shows that the current wave of robotization tends
   policy-makers will be   to boost productivity and economic growth, generating new
                           employment opportunities at a rate comparable to the pace
  faced with a dilemma:    of job destruction. We estimate that a 1% increase in the stock
    while robots enable    of robots per worker in the manufacturing sector leads to 0.1%
growth, they exacerbate    boost to output per worker across the wider workforce.
      income inequality.   These increases are large enough to drive meaningful growth.
                           Using Oxford Economics’ Global Economic Model (GEM), we
                           calculated how changes in the rate of installation of industrial
                           robots could affect the global economy. Overall, we found
                           that a faster adoption of robots has a positive impact on both
                           short- and medium-term growth. For example, boosting robot
                           installations to 30% above the baseline forecast by 2030 would
                           lead to an estimated 5.3% boost in global GDP that year. This
                           equates to adding an extra $4.9 trillion per year to the global
                           economy by 2030 (in today’s prices)—equivalent to an economy
                           greater than the projected size of Germany’s.

                           The future of service robots
                           Robots are steadily gaining traction in specific segments of
                           the service economy, from baggage handling in airports to
                           loading inventory in warehouses. In this report, we assess the
                           likely impact (and timeframe) of service robot roll-outs in
                           five key sectors: healthcare, retail, hospitality, transport, and
                           construction and farming. For the purposes of this study we are
                           considering robots only as physical machines, and not including
                           the already-popular service-industry software like robotic
                           process automation (RPA) that can speak, hear, read, conduct
                           transactions, automate processes, and so on.

                           One key consideration for anticipating the pace of robot
                           deployment in service industries is the environment in which
                           these robots may be asked to operate—in particular, the extent
                           to which service jobs include repetitive functions. Jobs like
                           warehouse work are in imminent danger, while other jobs in less
                           structured environments will likely be carried out by humans for
                           decades to come.

    6
How Robots Change the World

It will be difficult for machines to replace humans in service
sector occupations that demand compassion, creativity, and
social intelligence. Physical therapists, dog trainers, and social   It will be difficult for
workers are likely to remain secure in their jobs, for instance,     machines to replace
even if truckers and warehouse workers see the future of their       humans in service sector
jobs jeopardised.
                                                                     occupations that demand
Policy implications                                                  compassion, creativity,
As the pace of robotics adoption quickens, policy-makers will        and social intelligence.
be faced with a dilemma: while robots enable growth, they
exacerbate income inequality. Automation will continue to
drive regional polarisation in many of the world’s advanced
economies, unevenly distributing the benefits and costs
across the population. This trend will intensify as the impact of
automation on jobs spreads from manufacturing to the services
sector, making questions about how to deal with displaced
workers increasingly critical.

The challenges will be daunting. Our analysis of the job
moves of more than 35,000 US individuals over the course of
their careers shows that more than half the workers who left
production jobs in the past two decades were absorbed into
just three occupational categories: transport, construction and
maintenance, and office and administration work. Ominously,
our analysis found that these three occupational areas are
among the most vulnerable to automation over the next decade.
These findings, however, should not lead policy-makers and
other stakeholders to seek to frustrate the adoption of robot
technology. Instead the challenge should be to distribute the
robotics dividend more evenly by helping vulnerable workers
prepare for and adapt to the upheaval it will bring. Policy-
makers, business leaders, technology companies, educators, and
workers all have a role to play. We conclude the report with a
framework for action for each of these groups to navigate the
challenges and opportunities that robotization will bring.

Robots are on the rise as never before. Preparing for and
responding to the social impacts of automation will be a
defining challenge of the next decade.

                                                                                      7
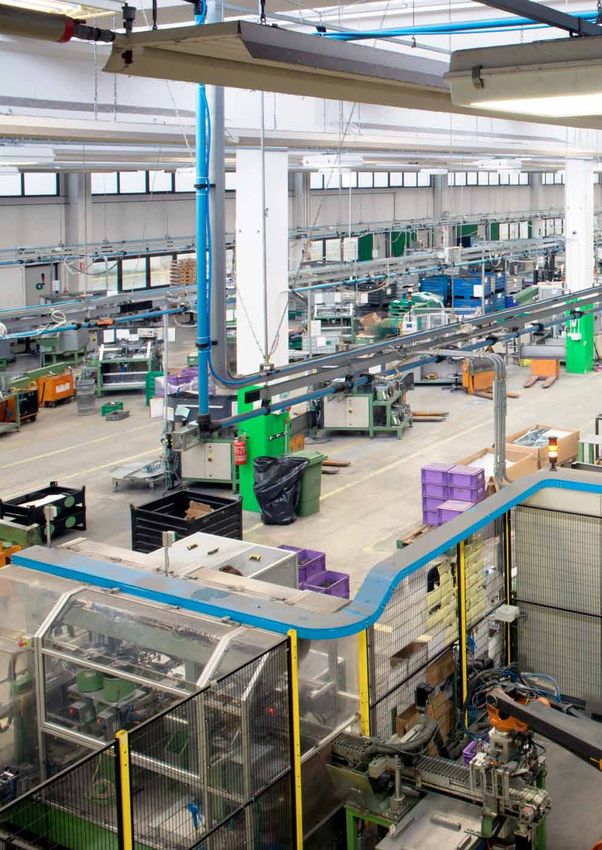
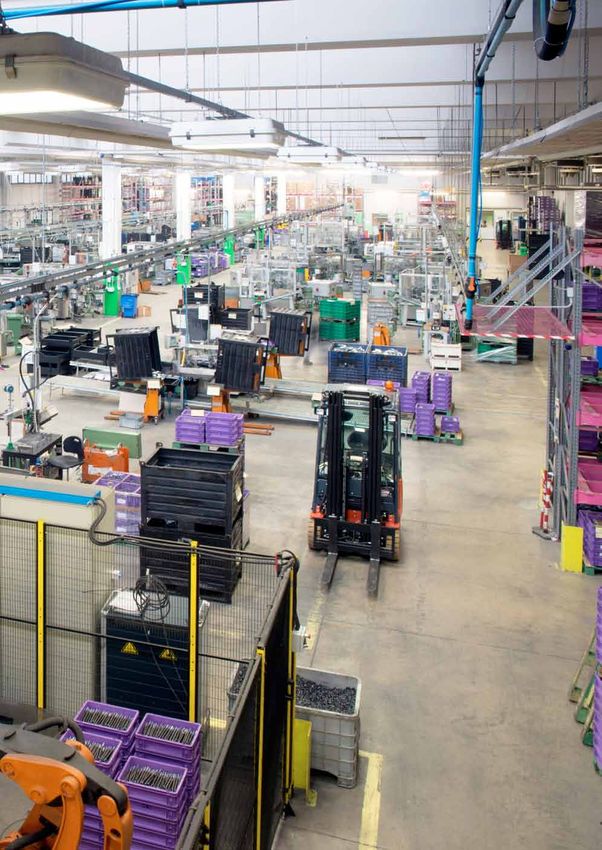
A vision of human-free
production in Italy.
How Robots Change the World

INTRODUCTION
Over the past decade, the                              warned the disruption
global stock of industrial                             caused by the automation of
robots has risen dramatically,                         cognitive skills could have “as                 This era of automation
and is projected to grow even                          wrenching and lengthy [an]                      presents significant
faster in the next 10 years,                           impact on the jobs market” as                   opportunities for
led by China’s record pace                             Britain’s industrial revolution.          5

of installation. The robotics                          He urged policy-makers to                       businesses to boost
industry has experienced                               learn the “lessons of history,”                 productivity. But there
exponential investment growth,                         with governments stepping                       will be winners and losers
upending decades-long                                  up to train workers for the
trends of gradual and steady                           new world of work while                         in the labour market.
expansion. A convergence                               providing a welfare state
of innovations in digital                              to cushion the blow from
technologies (e.g., artificial                         technological change.
intelligence and machine
learning) along with advances                          To shed new light on the future               This multi-disciplinary
in robotics engineering and                            impacts of automation, Oxford                 approach enables us to
energy storage, is dramatically                        Economics combined the                        construct a set of questions
transforming the capabilities                          expertise of its economists,                  for policy-makers about
of robots. New breeds of                               econometricians, modellers,                   the impact of increased
“cobots”—small, highly mobile,                         and other subject-matter                      robotization—as well as other
and dextrous machines that                             experts around the world. Our                 processes of automation—
can readily collaborate with                           analysis begins by modelling                  on economies and societies
humans—are entering the                                the latest and best data for                  around the world. Greater
manufacturing and logistics                            industrial robot installations                understanding of these issues
arenas, and can be easily                              in all manufacturing sectors                  will be key to making the most
“trained” to work with humans                          around the world. These are                   of robot-driven gains in the
to optimise productivity.                              credible, longitudinal datasets               future while supporting and
                                                       from which we draw fresh                      protecting those who stand
This era of automation presents                        insights regarding the impact                 to lose out from this era of
significant opportunities                              of robots on employment                       dramatic technological change.
for businesses to boost                                and productivity in different
productivity. But there will                           countries, and in the higher- and
be winners and losers in                               lower-income regions within
the labour market as these                             those countries.
opportunities are seized.
Millions of workers around the                         Building on these insights, we
world, across all sectors of the                       then assess the future impact
economy, will see many of the                          of increased robotization on
functions they were once paid                          global service sectors—an area
to perform handled instead                             where rates of robot adoption
by new technology. Millions                            have been much lower than
more will see the nature of                            in manufacturing to date,
their jobs altered significantly                       but which employs a much
as they are required to master                         greater proportion of the global
new skills to collaborate with                         workforce. Around three-
intelligent machines. In autumn                        quarters of workers across
2018, Andy Haldane, the Bank                           advanced economies earn their
of England’s chief economist,                          wages from service labour.

5
    Haldane warns AI threatens lengthy widespread unemployment’ (Financial Times, 20/08/2018).                                   11
How Robots Change the World
WHAT IS OUR DEFINITION OF
A ROBOT?
The quantitative modelling industrial robots at the end the impact of robots on
aspects of this study are of 2016, according to the employment and productivity
focused on industrial International Federation of levels. But the story will
robots used in all types of Robotics. Automation has long
6
continue to unfold as
manufacturing around the been a critical component of manufacturing itself undergoes
world. These automatically manufacturing, particularly rapid technological change. In
controlled, reprogrammable in the automotive industry, recent years, new, collaborative
machines are typically which in 2016 accounted for categories of AI- and cloud-
used for a host of physical more than 43% of the total enabled robots have emerged
activities in production, operational stock of industrial that seamlessly bridge the
such as processing materials robots in global manufacturing. gap between skilled manual
(laser cutting, mechanical The industry is at the leading assembly and automated
grinding), assembling and edge of robotic applications. production. These “cobots”
disassembling, precision create new opportunities for
welding, painting, and The quantitative analysis in this automation—even on short,
handling a wide range of report is focused on physical mixed production runs that
operations for measurement, machines for which rich, require both high levels of
inspection, packaging, longitudinal data exists. We do precision (at which robots
bending, and casting. not incorporate into this aspect excel), and sophisticated
These robots can be fixed of the analysis the growing vision, handling, and creativity
installations or mobile, role of disembodied software (where human workers
and the latest versions are applications sometimes continue to add great value).
increasingly powered by referred to as robots or bots,
artificial intelligence, so they including programmes used in
are “smart” and responsive to call centres and in RPA.
their surroundings.
Based on robust data, our
Manufacturing accounted analysis of the manufacturing
for more than 86% of the sector offers the best
world’s operational stock of perspective to date on
12 6
International Federation of Robotics (2017) “World Robotics: Industrial robots”How Robots Change the World
WHAT DRIVES THE
ROBOT RISE?
20%
Since 2010, the global stock could have as many as 14
of robots in industry has more million industrial robots in
than doubled: as many robots use, dwarfing the rest of the
were installed in the past world’s stock of industrial
four years as over the eight robots as it reinforces its Proportion of the world’s
previous. During this period, position as the world’s primary
the centre of gravity in the manufacturing hub. robot stock located in
world’s robot stock has shifted China. Approximately
towards new manufacturers, In contrast, though it has every third robot is now
mainly in China, Korea, and grown by around 370,000
Taiwan but also India, Brazil, units since 2000, the installed there.
and Poland. combined robot inventory of
the US and Europe has fallen
Approximately every third to under 40% of the global
robot worldwide is now share from its peak of close
installed in China, which to 50% in 2009. And Japan—
accounts for around one- formerly the world leader in
fifth of the world’s total automation—has reduced
stock of robots—up from its active stock of robots by
just 0.1% in 2000 (see Fig. around 100,000 units since
2). In 2017, China expanded the start of the millennium,
its lead as the world’s largest in line with a rebalancing
market for industrial robots, of its economy away from
accounting for 36% of global manufacturing and the
sales, up from 30% in 2016. If migration of many production
this trajectory of investment facilities offshore, especially
continues, by 2030 China to China.
Fig. 2: Robot installations by country, 2000 to 2016 7
New robot installations
350,000
300,000
250,000
Rest of World
200,000
China
150,000 South Korea
US
100,000
Rest of Europe
50,000 Germany
0 Japan
Source: IFR
00 01 02 03 04 05 06 07 08 09 10 0 11 0 12 0 13 0 14 0 15 0 16
20 20 20 20 20 20 20 20 20 20 20 2 2 2 2 2 2
7
Note: US data include immaterial robot installation numbers for Mexico and Canada prior to 2010 13How Robots Change the World
The automotive sector has of new robot installations in
long been the predominant high tech manufacturing grew 8
user of robots: innovations to 31% in 2016, from 21% in
in autonomous and electric 2000, reflecting rapid growth
vehicle manufacturing requires both in the sector and in the
increasingly sophisticated integration of robots into
production chains, and this production. Robots have also
has sparked demand for new, been increasingly introduced
more powerful, and intelligent into the production of rubber
machines to build them. and plastics, and are slowly
However, other manufacturing finding their way into the food
industries are now taking a and beverage manufacturing
more prominent role in robot industry (see Fig. 3).
use. For example, the share
Fig. 3: New industrial robot installations across the world by usage, 2000 vs. 2016
Rubber & Other
plastic products
0 53,000
16,000
84,000
25,000 21,000
103,000 91,000
Automotive High tech
Inner circle—2000
Outer circle—2016
Numbers refer to global robot installations in each sector for that year. Source: Oxford Economics
8
High tech manufacturing is defined as electronic devices, semiconductors, LCDs, LEDs, computer equipment, telecommunication equipment, medical 15
equipment, and electrical appliancesHow Robots Change the World
THREE REASONS FOR THE
ROBOT SURGE
Our analysis of the use of of a robot fell by 11% between Innovations have made today’s
industrial robots across the 2011 and 2016. 9
robots smaller, more sensitive
manufacturing sector identifies to their environments, and more
three main drivers behind this Rising labour costs in major collaborative. Thanks to AI, they
new pace of adoption: price, manufacturing economies can learn from their experiences
innovative applications, and also contribute to increasingly and make decisions informed
consumer demand. attractive pricing dynamics. In by data from a network of other
China, for example, unit labour robots. These developments
Trend #1: Robots are becoming costs in manufacturing have have helped propel robot
cheaper than humans increased by more than 65% adoption in sectors beyond the
since 2008. Wage rates have automotive industry (see Fig. 4).
The rapid expansion in robot also been rising consistently
installations is driven in part in Korea, Japan, the US, and
by the plummeting real costs Germany, in part due to the
of the machines. As with ageing of the population in
other advanced technologies, these countries.
exponential growth in
the processing power of Trend #2: Robots are rapidly
microchips, extended battery becoming more capable
lives, and the benefits of
ever-larger, smarter networks As robot technologies improve,
have all dramatically increased they are being used in ever-
the per-unit value of many more sophisticated processes,
technological components, in more varied contexts, and
while the average unit price can be installed more rapidly.
Fig. 4: Robot adoption growing faster outside the automotive sector
Percentage change in robot densification between 2011 and 2016
United States
14%
40%
China 199%
267%
-
Japan -22%
7%
South Korea 51%
83%
- -1%
Germany
27%
-50% 0% 50% 100% 150% 200% 250% 300%
Dark bar=Automotive sector
Source: IFR, Oxford Economics Light bar=Other sectors
16 9
Figures may be subject to upward bias by a trend in robot sales toward smaller installationsHow Robots Change the World
Trend #3: Demand for journey. Despite its rapidly and the establishment of
manufactured goods is rising, growing inventory, China high-tech manufacturing,
and China is investing in only uses 68 robots per we expect China will likely
robots to position itself as the 10,000 workers in general continue its acceleration in
global manufacturing leader manufacturing, compared robot investments for the
with 303 per 10,000 in next decade. By 2030, if the
Much of the growth in robot Japan, and 631 per 10,000 in investment in industrial robots
stock over the past decade South Korea. The imbalance continues to grow at its current
can be attributed to rising between stock and density is trajectory, China will have close
demand for manufactured shown in Fig 5. Large sections to eight million industrial robots
goods. China is at the heart of China’s workforce are still in use, as its robot density
of this change: it has become engaged in manual processes, approaches levels comparable
the world’s largest automotive meaning vast potential remains with the average across the
manufacturing site, and a for further robotization of its European Union. 10
major producer of consumer manufacturing sector—moreso
electronic devices, batteries, than in any other country.
and semi-conductors—
all highly robot-intensive With government policies
manufacturing sectors. aimed at expanding the
This trend is set to continue, use of electric vehicles
as China is still only at the (which will require large-
beginning of its automation scale battery production),
Fig. 5: Chinese scope for catch-up in robot density (2016)
Column=Robots per 10,000 workers (LHS)
Stock of robots in manufacturing (RHS)
1,000 300,000
900
250,000
800
700
200,000
600
500 150,000
400
300 631 100,000
200
309 303 50,000
100 189
0
68 0
South Korea Germany United States Japan China
Source: IFR, Oxford Economics
Robotization Potential
10
2030 projections based on short-term International Federation of Robotics forecasts, controlling for longer-term stock depreciation. 17How Robots Change the World
THE IMPACT OF ROBOTS ON
MANUFACTURING JOBS
While China leads the way in manufacturing also create
in robot investment, many employment across the wider
other major manufacturing economy. We explore this Throughout history,
economies have also rapidly positive economic impact in the geographical
expanded their use of greater detail on page 35. imbalance between the
industrial robots in recent
years. We quantified the At a regional or local level, positive and negative
impact of this global rise in however, the impact on jobs effects of automation has
industrial robot inventory on varies greatly. Since most had significant economic,
manufacturing employment manufactured goods are highly
since 2000. We also forecast tradable (because they are social and political
the number of manufacturing cheap to transport and have a implications.
jobs that could be lost to long shelf life), the households
robotization around the world that benefit from cheaper
by 2030, and the distribution goods are widely dispersed.
of potential changes across By contrast, the communities
higher- and lower-income most reliant on manufacturing as it adopts automation:
regions within countries. jobs—and thus most affected the true productivity gains
by the introduction of new can take several years to
It’s important to note that technology—are typically materialise as workers receive
despite the rising pace of much more concentrated. appropriate training, and as
robotics investment and Throughout history, this firms understand how best to
installation, popular fears geographical imbalance reorganise their production
that robots will create huge between the positive processes and business
swathes of unemployment and negative effects of models to exploit the benefits
around the world are automation has had significant of the new technology at scale.
somewhat misplaced. economic, social, and political
This is because the value implications. We developed an
created by robots across econometric model to quantify
the economy more than the impact on manufacturing
offsets their disruptive jobs in each country’s higher-
impact on employment. and lower-income regions.
Manufacturers automate their
production processes to boost GLOBAL IMPACTS
productivity.
Since 2004, each new
This creates a “displacement industrial robot installed in the
effect” on manufacturing jobs, manufacturing sector displaced
since the new technology an average of 1.6 workers from
can perform a worker’s job their jobs. The full impact takes
more cost-effectively for a time to materialise, however.
given standard of quality. It Within the first year of a robot’s
also reduces unit-production installation, roughly 1.3 workers
costs that, in a competitive are displaced, on average, from
market, translate into lower their job; this extends to 1.6
prices and effectively raises workers over subsequent years.
the real spending power of
consumers. Therefore, the This finding is consistent with
same robots that displace jobs other evidence from industry
19How Robots Change the World
A NOTE ABOUT OUR
ECONOMETRIC MODELLING
Our study presents our labour markets—these include
econometric analysis of the changes in real wages, shifts
link between robot installations in global trade patterns, and
and manufacturing job losses other unobservable regional
at both the national level and and industry-related factors.
for regions within specific
countries. Our model focuses See Appendix for a
on 29 manufacturing-intensive full explanation of this
countries using 11 years of methodology.
data, offering unprecedented
levels of detail about the
past and future impacts of
robotization on manufacturing Fig. 6: Our econometric modelling framework
jobs around the world.
Source Variable
In addition to providing
absolute figures, we have
calculated the marginal impact Momentum
of each additional robot Oxford
Manufacturing jobs per
Economic’s
installation on manufacturing Global capita in previous year
jobs across the countries Economics Data used for 29 countries
over 11 years from 2004 to
and
studied. Our modelling Global Economic 2016, disaggregated by
region and sector.
performance
establishes how this impact Cities
databanks
compares between lower- and GDP per capita
higher-income regions within Employment impact
a country (defined as regions
with average household Outsourcing
income levels above and below Share of
Comtrade manufacturing jobs
the national average). database;
Trade with China
in local economy
Oxford
Economics
Drawing on data from the calculations
Export Manufacturing jobs per
1,000 workers
International Federation of aptitude
Trade with the rest
Robotics (IFR), an industry of world
trade group, we investigated
the ways in which the
installation of additional Region-specific
industrial robots affected local factors
We isolate the average marginal
manufacturing employment Panel data techniques
impact on manufacturing jobs
at local level from each
in Japan, the European Union, additional robot intsalled.
the United States, South Korea, IFR; Robot
and Australia. By constructing
11
Oxford densification
Economics
a large, regional panel dataset calculations Robots per 1,000 workers
of robot stock alongside other
labour market indicators over
an 11-year timeframe, we were
able to isolate the impact
of robotization versus other
strong influences on local
20 11
Despite its prominence in global manufacturing, China was omitted from our econometric modelling exercise due to a lack of data in other important
modelling variables.How Robots Change the World
We also calculated the total workforce (some 400,000 We have projected the growth
amount of manufacturing jobs jobs). In China, as many as in the active robot stock
lost to robotization throughout 550,000 manufacturing across major manufacturing
the world since the turn of jobs have been displaced economies to 2030, based on
the century, considering
12
by robotization since 2000, the IFR’s three-year growth
factors such as redundancies equivalent to around 1% of projections for new robot
caused by off-shoring and the its current manufacturing installations and including
globalisation of supply chains. workforce. the need to replace some
In all, we estimate that around robots over time as they
1.7 million manufacturing jobs Assuming robot investments deteriorate. On this basis,
have been wiped out since continue at their current we expect almost 20 million
2000 due to the global rise of pace, many millions of manufacturing jobs to
industrial robots. Fig. 7 illustrates additional manufacturing disappear around the world
the impact by country: in the jobs are likely to be because of robotic automation
US, we estimate that more displaced by robots by (see Fig. 8). Put differently, if
than 260,000 jobs have been 2030. While considerable current trends hold, the global
lost to robots (around 2% uncertainties exist around manufacturing workforce
of today’s manufacturing the rate of adoption of new would be 8.5% larger by 2030
workforce), while in the technologies, it is possible if robots were not remaking
European Union, robots have to estimate the likely impact the market. 13
taken the place of 1.5% of of robotization in the
the current manufacturing coming years.
Fig. 7: Cumulative jobs losses implied by automation since 2000
Cumulative jobs lost since 2000
0
-200,000 400,000
-400,000 550,000 EU28
-600,000 China
260,000
-800,000 US
-1,000,000 340,000
South Korea
-1,200,000
Rest of world
-1,400,000 100,000
-1,600,000
-1,800,000
01 1
02 0 03 04 0 05 06 0 07 08 09 0 10 20 1 0 12 0 13 0 14 0 15 0 16
20 20 2 20 2 20 2 20 20 2 2 2 2 2 2
Source: Oxford Economics
12
Global estimate based on more than 90% of known global industrial robot installations, according to the International Federation of Robotics. 21
13
Manufacturing employment projections from Oxford Economics’ Global Industry model.How Robots Change the World
REGIONAL IMPACTS HIT levels are either above or
HARDER IN LOWER-INCOME below the national average. It
Installing one extra AREAS also controls for regionally-
industrial robot in a specific labour market
lower-income region Our modelling also allows shocks and underlying
us to look at the impact employment trends.
leads to almost twice of automation on different
as many manufacturing regions within each country. Why do these regional
job losses as in higher- These regional differences differences occur? They are
offer important social and not driven by the relative size
income regions. political implications for of the manufacturing sector—
policy-makers. manufacturing accounts
for roughly the same share
Our analysis shows that of economic activity and
installing one extra industrial employment in both lower-
robot in a lower-income and higher-income regions
region leads to almost twice in our sample, and our model
as many manufacturing job controls for sector size. But
losses as in higher-income there are structural differences
regions (see Fig. 9). This in the composition of
finding is based on an employment in manufacturing
analysis of our 29 sample that influence the impact
countries, distinguishing robots have.
between regions whose
average household income
Fig. 8: Projected cumulative jobs losses by automation, up to 2030
14
0
EU28
-5,000,000
China
-10,000,000 US
-15,000,000 South Korea
Rest of world
-20,000,000
-25,000,000
18 0 19 20 0 21 22 23 24 25 26 27 28 29 30
20 2 20 2 20 20 20 20 20 20 20 20 20
Source: Oxford Economics
22 14
Projections for ‘Rest of World’ include countries covering more than 99% of the estimated global total.How Robots Change the World
Fig. 9: Manufacturing job losses skew towards lower-income regions
Change in number of jobs due to one additional robot
-1.6 Average
effect
Lower-
-2.2 income
regions
Higher-
-1.3 income
regions
-2.5 -2.0 -1.5 -1.0 -0.5 0.0
Long-term impact Short-term impact
Source: Oxford Economics
Manufacturing workers in contrast, a significantly higher carry out are—on balance—
lower-income areas tend to proportion of managers easier to automate. These
have lower skill levels and are and professionals in the efficiency gains can be
therefore more vulnerable to manufacturing industry are in realised by laying off staff,
automation. There is typically higher-income regions. or by moving the firm to a
a difference in the number This vulnerability has evolved new, more productive (and
of robots per manufacturing over time. In the past, lower- likely more automated) site.
worker between higher- income areas competed with Either way, the manufacturing
and lower-income regions, more expensive cities and workers in those regions are
indicating that those in regions for manufacturing at risk.
lower-income regions are, on investment, with the lure
average, less productive. Data of lower unit costs of Moreover, the regions of a
from the UK Labour Force production. This competitive country most likely to shed
Survey, for example, shows edge was a consequence manufacturing workers will
that manufacturing workers in of relying on a lower-paid, not benefit equally from the
lower-income regions of the less-productive workforce to “robotics dividend” —the
UK are more likely to work in carry out lower-skilled jobs. new jobs created from the
lower-skilled occupations— In the new era of automation, productivity boost that feed
elementary workers and the occupational mix in lower into the wider economy.
machine operatives account income areas means those Instead, increased industrial
for around one-third of the same manufacturers face automation will tend to
workforce in lower income the biggest opportunities exacerbate the regional
regions, compared with 22% for efficiency savings. The inequalities that already exist
in higher-income regions. In functions their employees within advanced economies.
23How Robots Change the World
THE ROBOT VULNERABILITY
INDEX
It is vital for policy-makers to economic upheaval in the
understand how an uneven years ahead. Mapping the
distribution of robotics will vulnerability to robot adoption Our Robot Vulnerability
affect different parts of their across all regions of these five Index shows that specific
country. We have developed advanced economies revealed regions that are at
a Robot Vulnerability Index some common patterns,
to help identify which regions which can be summarised in highest risk of labour
within our chosen economies three key trends. disruption—but also
(the US, Germany, UK, France, reveals some common
Japan, South Korea, and Trend #1: Existing
Australia) will be hardest hit by inequalities will patterns across regions.
the ongoing automation of the intensify
manufacturing sector.
Successful economic
Our index produces a performance at the regional
vulnerability score for level in advanced economies
each sub-national region , 15
is usually inversely correlated
comprised of three equally with robot vulnerability. In
weighted indicators: the UK, France, and Germany,
those regions that have
• Local dependence performed best in recent
on manufacturing years (in terms of overall GDP
employment—defined as growth) are the least exposed
the manufacturing share to future robot automation,
of total employment in the and vice versa.
region.
• Future readiness of local This means the regional
industry—characterised inequalities that exist within
by a region’s current countries, such as England’s
intensity of robot use north-south divide, could be
in manufacturing, exacerbated by the rise of
controlling for the type the robots. This trend has
of manufacturing activity important implications for
undertaken, and measured policy design in advanced
relative to international economies pursuing
competitors. international competitiveness
• Productivity of the local through automation.
manufacturing workforce—
measured relative to the
national average.
The index is thus designed
to highlight regions that are
economically dependent
on a less productive (or
lower-skilled) manufacturing
industry and do not currently
use many robots, since these
areas are at highest risk of
15
Sub-national regions correspond to European NUTS 2, US States, Japanese prefectures, Australian states, and South Korean districts. 25How Robots Change the World
Trend #3: Rural Country-by-country analysis
regions mask hidden
The pockets of workers vulnerabilities Over the next five pages, we
most vulnerable to illustrate each local region’s
automation can often be The pockets of workers most relative vulnerability to future
vulnerable to automation can manufacturing automation,
found in rural areas. often be found in rural areas. according to our Robot
Despite relatively sparse Vulnerability Index. Each
populations, these regional map is colour-coded from
economies are frequently “high vulnerability” to “low
grounded to isolated towns vulnerability” regions (relative
Trend #2: Many major with more manufacturing- to the rest of that country)
cities are safe (for now) intensive industrial and includes commentary
structures on which the on some of the most striking
Our analysis shows that major wider region depends. This geographical results.
cities are often safe havens is especially problematic
for workers in the face of when manufacturing in these
robot led job displacement. towns is characterised by
Diversified economies depend traditional, labour-intensive
less on manufacturing jobs, techniques, low levels of
and higher labour costs mean productivity, and dated
manufacturers located there manufacturing processes.
are already highly productive
and tend to employ more In many countries, such
highly skilled workers. London, regions have often been left
Paris, Seoul, Sydney and Tokyo behind as metropolitan centres
are all examples. prospered, and those dynamics
have generated political
But manufacturing-intensive polarisation. This highlights the
cities (including many in importance of taking policy
South Korea) face a more action to cushion the likely
uncertain future. Cities impact of robotization in these
with large populations that vulnerable areas.
are more dependent on
the manufacturing sector
for employment but lag
their industry peers in
robot intensity and labour
productivity are vulnerable to
disruption. Fierce competition
will ultimately lead these city-
based industries to pursue
further automation or risk
losing out to more productive
competition elsewhere.
Either way, additional job
displacement of current
manufacturing workers is likely.
26 1
XxxxxxHow Robots Change the World
UNITED STATES
Oregon is the
most vulnerable state in
the US to a future acceleration
in robot installations. The state
has had success in transitioning out
of traditional sectors into the
production of high-tech components.
But high dependence on
Low vulnerability manufacturing, particularly in and
Lower-medium vulnerability around Portland, and the state’s
exposure to globally competitive
Upper-medium vulnerability sectors, mean its workers are
High vulnerability vulnerable to rapid
technological
progress.
New England
states tend to have low
While Texas and its vulnerability to the future
neighbour Louisiana are two spread of manufacturing
particularly vulnerable states in robots, as do those with a higher
the south, Indiana is equally reliance on tourism (Florida,
vulnerable in the mid-west. It is Nevada, Hawaii). The same is true
associated with steel-making (and for New York state, which,
with heavy industry more Alaska alongside a significant
generally), albeit with an Hawaii manufacturing base has a high
increasing focus on developing concentration of financial
the growth of its higher-value, and business services.
knowledge-based
industries.
Most State: Index Score: Least State: Index Score:
vulnerable Oregon 0.58 vulnerable Hawaii 0.17
states Louisiana 0.58 states District of Columbia (DC) 0.18
Texas 0.50 Nevada 0.25
Indiana 0.46 Florida 0.25
North Carolina 0.46 Vermont 0.26
27How Robots Change the World
GERMANY
Germany’s least-vulnerable
region is Hamburg. It has a low
level of dependence on
manufacturing jobs, and what
manufacturing it does have is
typically advanced and highly
productive, with cutting-edge
levels of automation.
Low vulnerability
Lower-medium vulnerability
Upper-medium vulnerability
High vulnerability
A cluster of four
eastern regions close to
the Czech
border—Chemnitz, Thüringen,
The home regions of BMW Oberfranken, and
and Mercedes—Bavaria and Oberpfalz—look to be the most
Stuttgart, respectively—are vulnerable to robotization. All have
examples of future-ready high concentrations of
production ecosystems, featuring a manufacturing employment, and
highly skilled, highly productive (typically) low levels of
workforce. productivity—particularly
Chemnitz and
Thüringen.
Most Region: Index Score: Least Region: Index Score:
vulnerable Chemnitz 0.56 vulnerable Hamburg 0.06
regions Thüringen 0.49 regions Darmstadt 0.13
Oberfranken 0.49 Oberbayern 0.17
Oberpfalz 0.47 Köln 0.19
Freiburg 0.46 Berlin 0.20
28How Robots Change the World
UNITED KINGDOM
East Yorkshire and Northern
Lincolnshire, Shropshire and
Staffordshire, Cumbria, and West
Wales and the Valleys exhibit the
highest vulnerability scores in the UK.
Low vulnerability These regions are relatively
Lower-medium vulnerability dependent on manufacturing for
employment, and have a relatively
Upper-medium vulnerability high incidence of low-skilled
High vulnerability workers.
The UK’s most Robotization will
vulnerable regions to exacerbate the
robotization can be found in north-south divide. Inner
its more rural areas. These London is perhaps the least
sparsely populated regions vulnerable part of the country to
may contain towns with the rise of robots, and the South East
concentrated manufacturing region is similarly well-placed for the
industries. Cumbria tops next phase of industrial automation.
our UK Index. Manufacturing operations in these
regions tend to be more advanced
and more automated than in
other parts of the country,
reflecting the higher cost
of labour here.
The West Midlands’
manufacturing processes are
already among the most
automated in the UK, and the
region is nearly as robot-dense as
international market leaders. However,
it is also characterised by low levels
of productivity, and with a high
dependence on manufacturing
employment, which could still
imply a challenging future.
Region: Index Score: Region: Index Score:
Cumbria 0.59 Inner London (East) 0.15
Most East Yorkshire & Least Inner London (West) 0.17
vulnerable North Lincolnshire 0.59 vulnerable Outer London
regions Shropshire & regions (West & NW) 0.20
Staffordshire 0.58 Berks, Bucks &
West Wales & Oxfordshire 0.25
the Valleys 0.56 Surrey, East &
Lincolnshire 0.54 West Sussex 0.28
29How Robots Change the World
FRANCE
The Île-de-France,
centred on Paris, is France’s
least-vulnerable region. It is least
dependent on manufacturing jobs,
and what manufacturing activity it
does have is (a) highly productive
and (b) the most robot-intensive in
Low vulnerability
the country, alongside the
Lower-medium vulnerability Midi-Pyrenees. This means it
has already undertaken
Upper-medium vulnerability significant levels of
High vulnerability automation
We find that the most
France’s most southerly vulnerable region to
regions, plus Rhône-Alpes, robotization is Franche-Comté.
are collectively the ‘runners-up’ France’s most
behind Paris in terms of their low manufacturing-intensive region
vulnerability on our Index. These is nevertheless relatively rural and
regions are home to advanced sparsely populated. Its relatively
high-tech manufacturing companies, low rate of robotization means
notably in leading cities such as there could be high levels of
Toulouse (home to Airbus, among automation coming.
others) and Grenoble, and thus
benefit from I a future-ready,
highly skilled workforce.
Region: Index Score: Region: Index Score:
Most Franche-Comté 0.61
Least Île de France 0.03
vulnerable Basse-Normandie 0.51 vulnerable Provence-Alpes-Côte
regions Picardie 0.51 regions d'Azur 0.26
Limousin 0.51 Languedoc-Roussillon 0.30
Auvergne 0.49 Aquitaine 0.35
Midi-Pyrénées 0.36
30How Robots Change the World
JAPAN
Hokkaido,
Japan’s northernmost
island—famous for brewing beer
Low vulnerability and as a skiing destination and
gateway to the Hokkaido
Lower-medium vulnerability mountains—is one of the least
Upper-medium vulnerability manufacturing-intensive parts of the
country. After Tokyo, it is the
High vulnerability second-least vulnerable region on
our Index.
Some of Japan’s most
mountainous prefectures
feature among the most
vulnerable to job losses. Although
sparsely populated, these large
regions are punctuated with
traditional manufacturing enclaves,
which may prove highly vulnerable to
change. The regions of Kochi, Nara,
and rural Tottori are, in this sense,
among the most vulnerable to
the trends of automation.
Japan’s
largest and most economically
important prefecture, Tokyo, is the
country’s least-exposed region to robots
displacing manufacturing jobs, according to
our Index. Companies here have already
established advanced levels of robot
intensity, and the region’s diverse economy
means workers are less dependent on the
manufacturing sector for employment. A
similar pattern is true of the regions
surrounding other important cities
such as Osaka, Yokohama, and
Kawasaki.
Region: Index Score: Region: Index Score:
Most Tottori 0.54
Least Tokyo 0.09
vulnerable Kochi 0.51 vulnerable Hokkaido 0.20
regions Nara 0.49 regions Osaka 0.25
Shiga 0.49 Fukuoka 0.28
Saga 0.48 Miyagi 0.28
31How Robots Change the World
SOUTH KOREA
Workers in South Korea’s largest
city, Seoul, are the country’s least
vulnerable to the growth of
manufacturing robots. The regional
economy is diverse, meaning it has a
Low vulnerability low dependence on the
Lower-medium vulnerability manufacturing sector for work, and
the labour force is highly
Upper-medium vulnerability productive.
High vulnerability
Some of Japan’s most
mountainous prefectures
feature among the most
vulnerable to job losses. Although
sparsely populated, these large
regions are punctuated with
traditional manufacturing enclaves,
which may prove highly vulnerable
to change. The regions of Kochi,
Nara, and rural Tottori are, in this
sense, among the most
vulnerable to the trends of
automation.
Korea’s second city, Busan,
and its neighbour, Ulsan, appear
vulnerable to robots on our Index.
Ulsan is home to major car plants,
shipbuilding facilities, and oil
refineries. It has very high levels
of manufacturing productivity, but
its relatively high robot vulnerability
score is driven by a remarkable
dependence on manufacturing
employment.
Region: Index Score: Region: Index Score:
Most Daegu 0.38
Least Seoul 0.11
vulnerable Incheon 0.35 vulnerable Jeollanam-do 0.13
regions Ulsan 0.33 regions Gangwon 0.19
Gyeongnam 0.32 Chungcheongnam-do 0.21
Busan 0.29 Gyeongbuk 0.23
32How Robots Change the World
AUSTRALIA
Australia’s most populous
state, New South Wales, looks
rather less vulnerable than either
Victoria or South Australia. In this
state, the labour market has become
less dependent on manufacturing
Low vulnerability jobs in recent years, while
Lower-medium vulnerability manufacturing productivity has
improved. So the impact of
Upper-medium vulnerability further robot densification will
High vulnerability likely be muted.
South Australia
is the most vulnerable Victoria is less vulnerable
part of the country to future to robots than South
robot rollout, according to our Australia, and also faster
Index. The state is Australia’s growing. Melbourne and its
most manufacturing intensive surrounding area have a diversified
but has the slowest-growing manufacturing base, although one
economy and low levels of that is declining in relative
manufacturing importance as Melbourne’s service
productivity. economy strengthens. Victoria’s
manufacturing productivity is
also higher than that of
South Australia.
Regions and Region: Index Score:
territories South Australia 0.42
ranked from Victoria 0.39
most-to-least Tasmania 0.37
vulnerable Queensland 0.32
New South Wales 0.28
Western Australia 0.14
Northern Territory 0.06
Australian Capital Territory 0.06
33A delivery robot being trialled in London, 2017.
How Robots Change the World

THE ROBOTICS DIVIDEND

                                                                                                                         1%
Despite the decline of                                      To capture the potential
manufacturing jobs over                                     implications of the new era
the past decade, it would                                   of robotics on the global
be simplistic to characterise                               economy, we used Oxford
robotization as only a                                      Economics’ Global Economic                                   increase in the stock of
destroyer of jobs. While                                    Model (GEM). The GEM
certain sets of workers lose                                covers 80 countries and is                                   robots per worker in the
their jobs to robots, many                                  the foundation of all Oxford                                 manufacturing sector
in the wider population                                     Economics’ country, industry,                                leads to a 0.1% boost to
benefit from a “robotics                                    and city forecasts. It enables
dividend”—lower prices for                                  us to test the sensitivity of                                output per worker across
manufactured goods, higher                                  macroeconomic outcomes to                                    the wider workforce.
real incomes, and stronger                                  different rates of investment
tax revenues. This will be                                  across many advanced
particularly important to                                   economies around the world.
the lower-income regions                                    This modelling suggests that
we have identified as being                                 the rate of industrial robot                             30% above baseline projections
most vulnerable to the robot                                adoption over the coming                                 for 2030. For China’s
revolution.                                                 years will have a significant                            manufacturing sector, this
                                                            impact on global GDP growth.                             would put its robot density on
Our modelling shows that                                                                                             a par with the levels of robot
robots have delivered                                       The first step in our GEM                                density that currently exist in
considerable productivity                                   analysis was to establish a                              Japan and Germany.
gains in recent years. We                                   baseline projection for GDP
analysed the impact of robot                                growth consistent with the                               By contrast, the low scenario
densification on productivity                               short-term robot investment                              assumes the pace of robot
growth in an international                                  trajectories forecast by the                             adoption slows, leaving the
sample of countries over 11                                 International Federation of                              stock of industrial robots some
years, controlling for factors                              Robots (IFR) trade group.                   17
                                                                                                                     30% lower than the baseline
such as skill levels and other                              These trajectories for the                               by 2030. This would put
capital investment, across                                  US, Europe, and large Asian                              the robot density of China’s
29 of the world’s most                                      economies were calibrated                                manufacturing sector at a
advanced economies. We                    16
                                                            against historical growth levels                         level comparable with the
found that a 1% increase                                    for both robot stock and                                 current robot density of the
in the stock of robots per                                  robot density. Our baseline                              US manufacturing sector—a
worker in the manufacturing                                 projections for the growth in                            level significantly lower than
sector alone leads to a                                     robot stock amounted to an                               Japan and Germany. (For more
0.1% boost to output per                                    annual increase of roughly 5%                            information on how we used the
worker across the wider                                     for China, 3% for the US, 2%                             GEM to simulate the impact of
workforce. This confirms                                    for both South Korea and the                             different robot adoption rates
our hypothesis: that by                                     Eurozone, and 0.7% for Japan.                            on the annual GDP performance
displacing automatable jobs                                                                                          of key economies around the
in manufacturing, robots                                    Next, we explored “high”                                 world, see box on page 37).
free up many workers to                                     and “low” scenarios for
contribute productively                                     robotization, relative to the
elsewhere in the economy,                                   IFR’s short-term benchmark.
as they meet the demands                                    The high scenario assumes
generated by lower prices                                   that the global stock of
for manufactured goods.                                     industrial robots will accelerate

16
     The sample size for this model differs to our employment model due to data availability.                                                       35
17
     The IFR’s latest three-year growth projections for new robot installations appear in its publication World Robotics 2017: Industrial Robots.
You can also read