How to Distinguish the Ad Source if Users are Coming to your APP
←
→
Page content transcription
If your browser does not render page correctly, please read the page content below
Web Analytics Case Study

                                         How to Distinguish the Ad Source
                                          if Users are Coming to your APP
                                               from a Landing Page?

Client                                                                      Tasks
sportbank is a mobile bank that focuses                                       track the entry point of users that open the app through
on opportunities related to sports and active lifestyles.                     the landing page and analyse their way through the funnel till they
                                                                              proceed to card activation;
This bank does not have physical branches – all operations,
including ordering a card, are processed with the help of                     determine the time needed from the app installation
a dedicated mobile app that is available on both iOS and Android.             to the moment when he card is active;

                                                                              create an automated interactive report that combines the entire
                                                                              set of data.
Entry Data

In the autumn of 2019, Dyvotech and N1 announced the launch of a new mobile bank called sportbank. In the spring of 2020, the Promodo team joined
 them as a dedicated marketing partner. During this period, the entire team focused on building the brand knowledge and coverage. We used a complex
mix of channels and immediately built the foundation for analytics systems.

   Launching mobile ads without deep analytics is a risk both in terms of time and financial costs. We aimed to collect information about all the app users,
   their entry points and the way they are moving through the funnel from the registration to card activation.

Conversion Funnel

marketing                  stores                     app                      card
channels                                          installation              activation

              landing
                page

It was crucial for us to define the channels that bring the users who further activate the card to the landing page. We also wanted to track the so-called
"late installs", i.e. the cases where users required time from their first contact with the mobile app to the actual activation of the card.
Solution

To analyse the mobile app, we have chosen two dedicated analytics systems – Firebase and AppsFlyer.

Why these systems?
Firebase. The main advantage of this system in terms of analytics is support for automatic export of raw data to BigQuery. In addition, due to the lack of
sampling, the completeness of the data is preserved.

   Support of audiences, attributions with advanced mechanisms for working with targeted advertising.
   You can segment users by event (for example, session_start or level_up) and combine events, parameters and properties.
   This approach allows you to select almost any subset of users.

   Automatic registration of important events from the funnel:
   first_open (the first opening of the app), app_remove (removal), app_update (update), and even in_app_purchase
   (a purchase or subscription that is processed in the App Store or Google Play).

   There is a possibility of integration with a number of services.

   A complex representation of traffic distribution in the app and on the website (GA4).
Firebase Interface

AppsFlyer. One of the largest mobile trackers in terms of functionality. It`s as good as Firebase, but the system uses a payment model:
6 cents for one non-organic (paid) installation.

Firebase does not allow you to correctly track Facebook as a source, which is the second most important source of installs. Even with Dynamic Links,
some traffic is "lost". The system does not collect data on AAA campaigns (Automated App Ads) either. To cover these gaps, we connected AppsFlyer.
AppsFlyer Interface

Based on the business goals, we compiled a list of more than 50 events to track. Once this was implemented on the developers’ side, we checked and
adjusted the settings.

  On average, the process of analytics setup for a mobile app takes a month and a half, but sometimes the implementation of this task can be delayed.
  It all depends on the skill and workload of your development team.

Why is the correct analytics setup so crucial?

   Perform evaluation of the channels that attract traffic.

   Reallocate your budgets depending on the profitability of a channel or ad campaign.

   Reallocate your budgets depending on LTV of clients by a channel or ad campaign.

   Reconfigure campaigns based on the analysis of user segments.

   Optimise the sales funnel in the mobile app.

   Perform CRO of the screens and the app elements.

                          The Integration:
             Connecting a Firebase project with BigQuery

By linking a Firebase project with BigQuery, we were able to collect and study the initial data about events (without sampling)
with all configured user parameters and properties.

In addition, such an integration allows to export and combine data used for analysis with the information from external sources.
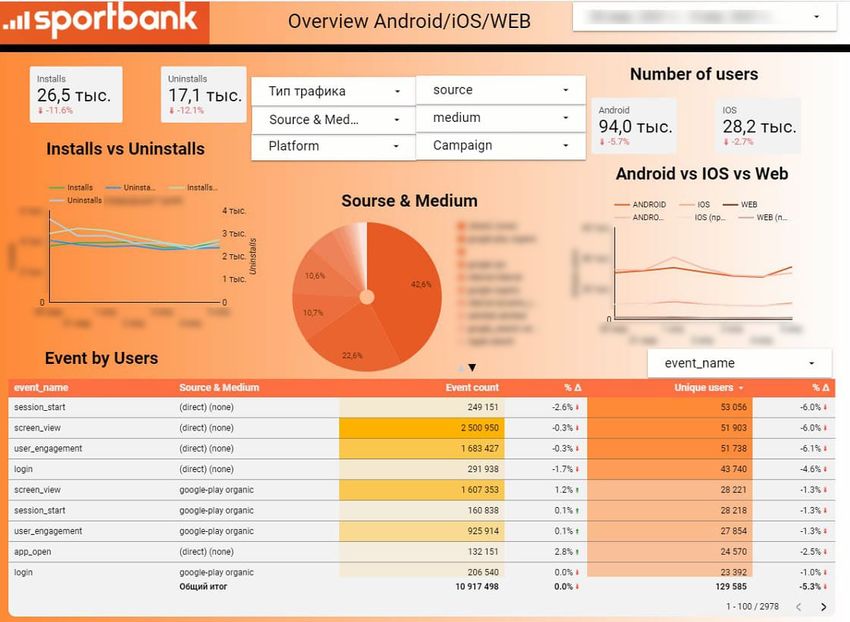
Visualisation. Graphic data for quick decision making

To provide the team with the relevant information about the app only, we used Google Data Studio. Interactive visual dashboards made it possible
to quickly analyse information and make decisions. Thanks to the integration with the original Firebase data, we were able to display all the information,
including the conversion funnels.

        «The Promodo team helped us close our main gap, i.e. the lack of a single operational report, where we could quickly view all the data and make operational
        decisions based on them. For example, thanks to the funnel that was built in the report and reflected the stages of the card issue, we revealed that we were
        losing clients just at the point where they needed to insert the OTP number. We were able to quickly react and resolve this issue».

        - Alexander Kudar, Commercial Director at sportbank
Data Visualisation with Google Data Studio

Connecting Google Analytics 4

Thanks to the integration of the Firebase project with Google Analytics 4, we managed to track not only direct traffic coming to the mobile app,
but the traffic sources that brought users to the app from the landing page https://sportbank.com.ua/

This way, in the Data Studio report we were able to see the information about card activations performed by users who initially came to the landing page
from a web source, and then installed the app and activated the card.

                                                             Users per Platform

                                                                                                       Platform 1
                                                                     Platform 2                        67.9 %

                                                                                                       Platform 1
                                                                                                       17.8 %
                                                                             Platform 3
                                                    Platform 1

                                                                                                       Platform 1
                                                                                                       14.3 %

                                          Cross-platform report
Google Analytics 4 puts mobile and web analytics together by measuring real users that interacted with the company,
but not the devices and browsers they used.

                 GA4 Interface
We marked up the landing page so that the source, channel and specific campaign were visible by embedding tags into each link and QR code leading from the landing page to the mobile app. Additionally, we implemented meta tags for tracking Facebook campaigns gained the ability to track this source through Dynamic Link in Firebase An example of sources from the landing page Now the team can save time they spent manually bringing the stats from separate cabinets (app and web) together. All the data is displayed in one place. Tracked are both the conversions from the campaigns for attracting to the landing page in the app and the “late installs” for these campaigns. As a result, we reduce the time spent on analysing the effectiveness of campaigns, and sharpen the quality of data for analysis.
The Results

    All user actions that take place in the mobile app are carefully analysed.

    The data obtained allows us to distinguish the original source of the users who are coming to the app
    from the landing page. Reallocate your budgets depending on LTV of clients by a channel or ad campaign.

    We can analyse the funnel the user goes through from the app installation to the card activation.

    We can assess the impact of web-channels that drive traffic on the app and the value of those channels.

    A cohort analysis of user interaction within the app is configured and displays the data from the first touch
    to the moment of card activation. Now it’s possible to separate the activations made the same month when
    the app was installed from the activations that followed the installations of the previous months.

         “Thanks to the cohort analysis report, we started tracking the installs of users who activated the card a week, month or year after they installed the app.
         This gave us an understanding of each ad source value, taking into account the time required for late installs. If before we used to record, for example,
         400 card activations from one ad source within the period, now, with the late installs, we understand that in fact this brings 550 activations ”.

         - Alexander Kudar, Commercial Director at sportbank

What’s next?
1       Moving away from manual reports and setting up end-to-end analytics.

2       Setting up tracking of the internal referral program.
You can also read