How to Manage Your Restaurants Critical Numbers and Avoid Financial Loose Ends
←
→
Page content transcription
If your browser does not render page correctly, please read the page content below
How to Manage Your Restaurants Critical Numbers and Avoid Financial Loose Ends          Page 1 of 8

http://www.restaurantowner.com

How to Manage Your
Restaurants Critical
Numbers and Avoid
Financial Loose Ends
by Chirs Tripoli and Jim Laube

When looking to open your
restaurant, most people will
emphasize the importance of three
things: location, location, location.
Once you have opened, everyone
will tell you that the three things
you need to master to succeed are
numbers, numbers, numbers.

It is hard enough to operate well in
today's competitive restaurant market
considering the time commitment,
quality control, customer service
standards and labor management. It
becomes much more difficult to succeed if you cannot "tie" your numbers together in a way that
helps you plan effectively, manage costs more efficiently and increase profits.

And what numbers are we talking about when there are so many to track? There are annual
plans, sales forecasts, operating budgets, daily sales records, inventories, cost of sales,
controllable expenses, occupancy costs, shareholder value, sales-to-investment ratios and more.

So what numbers do we need to track regularly and consistently? Why are they so important?
What do they tell us? When do we need to know them? And how do we use them to increase
sales and maximize profits?

If you were Ron Shaich, CEO of Panera Bread, you might answer with:
1. Same-store sales comparison.
2. Number of new restaurants scheduled to open.
3. Stock value.

In a recent interview Shaich said that Panera's numbers tell the tale. The company's same-store
sales results for restaurants open at least a year were up 3.4 percent last year and up slightly
this year. Its stock value was up 50 percent last year, ranking among 2008's most successful
restaurant stocks, and it is the best-performing major restaurant stock in the past decade, with
an annualized growth rate of 31.5 percent. Sales in 2008 topped 2.6 billion and shares are off
less than 1 percent in 2009 (source: USA Today).

But since you are most likely not the CEO of a public restaurant company with more than 1,260
stores in 40 states and 80 more opening this year, you are not likely to use this information to
better manage your restaurant operation. The "triple play" of numbers for most independent
restaurant operators is simply sales, expenses and profit.

http://www.restaurantowner.com/members/1272print.cfm                                     5/21/2010
How to Manage Your Restaurants Critical Numbers and Avoid Financial Loose Ends         Page 2 of 8

We have found that too many owner/operators are not tracking sales accurately, not posting
costs by category correctly, and/or viewing a cash balance at the end of the month as profit.
These errors and misconceptions prevent us from managing our operations profitably. Unless you
know how to interpret your financial data and identify relationships between various financial
reports, you really don't know how your business is performing. Let's start by taking a look at a
good sample monthly reporting method and determine what items belong to what category.

First, Tie in the Monthly Report

The "Profit and Loss Summary" on the right provides an
outline of the kinds of information you want to be able to track
at a glance monthly. Please refer to it as you read the
following:

Sales. Begin by recording sales by category. Food typically
includes nonalcoholic beverages (tea, coffee, juices and soft
drinks). Separate the alcoholic beverage revenue by liquor,
beer and wine. Some restaurant operations that sell a large
amount of beer prefer to separate that category into draft and
bottle sales. In some cases where retail items are offered for
sale (e.g., T-shirts, gifts, sauces) it is recommended to add a
retail or miscellaneous sales category.

Cost of sales. This is a category where accuracy is definitely
required and yet many operators make the same common
mistake. It is important that the cost of sales be calculated as
a percent of their corresponding sales category and not by
total sales. Food cost should be divided by food sales,
beverage cost by beverage sales, and retail cost by retail
sales. The diagram "Properly Calculating Cost of Sales," below,
provides an example of the percentage cost difference you
receive when calculating these items correctly and incorrectly.
As illustrated in the lefthand column, using the total sales as
the denominator results in a deceptively low cost of sales for
both food and beverage. In the righthand column, the cost of
sales is derived by dividing the cost of each category by the
respective sales of each category.

http://www.restaurantowner.com/members/1272print.cfm                                    5/21/2010
How to Manage Your Restaurants Critical Numbers and Avoid Financial Loose Ends           Page 3 of 8

Payroll. In most cases this category represents the single largest cost item. It is important to
track payroll cost by separate departments - store personnel (hourly employees) and
management (salary personnel). Payroll taxes and employee benefits are to be included in this
category of your restaurant P&L.

Controllable expenses. These categories include each of the items required to operate your
restaurant that are controlled by decisions made by ownership, management or staff. Categories
within this section are direct operating expenses, music and entertainment, marketing, utilities,
general and administrative expenses, and repair and maintenance costs.

Direct operating expenses. This includes uniforms, laundry-linen, tableware-glassware, kitchen
utensils, cleaning supplies, paper, bar supplies, menus-printing, contract cleaning services,
decorations-flowers, and miscellaneous.

Music and entertainment. Includes payment to professional musicians if appropriate to your
concept, as well as annual fees-permits to ASCAP, BMI or other music licensing agencies.
Marketing is the correct category for any/all advertising-related expenses such as print ads,
coupons, promotions and research.

Utilities. Includes the charges for electricity, gas, water and trash removal.

General and administrative. These expenses include the fees and service charges required
(and often overlooked) when budgeting for you restaurant. Examples include bank charges, cash
over-short, credit card charges, postage, printing-office supplies, professional fees (accounting-
legal-consulting), security services, license permits, telephone and fax.

Repair and maintenance. This category includes costs associated with building repairs,
equipment repairs and maintenance contracts.

Occupancy costs. This section is for the cost of rent (base and percentage) common area
maintenance fee (CAM) property taxes, insurances and other taxes.

Logic would tell you that you can't begin to make sense of your numbers if you do not have

http://www.restaurantowner.com/members/1272print.cfm                                      5/21/2010
How to Manage Your Restaurants Critical Numbers and Avoid Financial Loose Ends            Page 4 of 8

accurate reporting of the numbers. You need to get your accounting house in order from the very
beginning; otherwise you are flying blindly from one month to the next. That said, if the first step
to tying numbers for a better restaurant operation is proper monthly reporting of sales and costs,
the second step is accurate management practices.

Second, Tie in the Monthly Inventory

Taking a physical inventory at the end of each reporting period is a basic practice and one that is
mandatory to the maintenance of accurate cost numbers. Relying on par levels or inventory
averages will distort the cost of food and beverage items. An accurate physical inventory is
needed to correctly determine your cost of sales. Accurate cost-of-sales figures are a prerequisite
to controlling food and beverage costs.

In the example illustrated in "The Importance of a Proper Physical Inventory" below. The
restaurant without an inventory is figuring its cost of sales on purchases rather than usage. This
is inaccurate and creates a cost number that doesn't tie into the operation and cannot be
correctly compared with the industry standard.

Fluctuations in inventory levels do not affect food cost, provided an accurate beginning and
ending inventory is taken. An inaccurate ending inventory means a dollar-for-dollar misstatement
of your true food cost.

There is a 37-year-old family-operated seafood restaurant in Columbus, Ohio, that just started
preparing complete inventories at the end of each month. The           ...In a low-margin
operators had maintained a relatively constant inventory level     business in which sales can
and divided sales into purchases to figure cost of sales. This was flucuate and controlling
inaccurate and created an incorrect monthly profit. After          costs requires contstant
reviewing current food cost figures they are better able to tie    vigilance, operators of
the numbers together and take steps based on accurate              consistently profitable
information. They have since updated their menu item cost and      restaurants don't wait until
for the first time are able to compare them with the item sales
reports to complete an ideal food cost projection. Tying numbers

http://www.restaurantowner.com/members/1272print.cfm                                       5/21/2010
How to Manage Your Restaurants Critical Numbers and Avoid Financial Loose Ends Page 5 of 8
together accurately shows us the true picture of things so we
can make decisions and plan accordingly. the end of the month to
learn how their restaurant
In regard to comparing your numbers with industry standards, performed..
for many years we have recommended the use of the National
Restaurant Association's (NRA) "Uniform System of Accounts for Restaurants." This book shows
you how to put in place an accounting system designed for the foodservice industry. It provided a
comprehensive listing of accounts for assets, liabilities, revenues and expenses along with a
complete description of the types of transactions that should be classified in each account.
Using the uniform system of accounts allows the preparation of financial statements into
industry-standardized formats, which makes it possible to compare your operation's operating
statements with industry averages.
In addition, the NRA annually publishes foodservice industry operating averages from data
provided by NRA members in the "Restaurant Industry Operations Report." Many state
associations also publish similar reports from participating operators in their respective states.
The Uniform System of Accounts for Restaurants is out of print; however, if you can find the most
recent edition, published in 1996, it is still useful. (We understand that the NRA is considering
printing an updated edition in the future. We will keep you posted as this develops.) The
Restaurant Industry Operations Report may be purchased by calling the National Restaurant
Association at (800) 424-5156, ext. 5375. Restaurant operators who use the "Uniform System of
Accounts" get a better understanding of what their operating numbers are telling them.
Three, Tie in the Audit Trail
For owners and managers to use operating numbers for our benefit, we must first be able to
locate the numbers, and then understand what they represent.
Each shift a manager reads the register and posts the sales amount. At the end of the day a daily
sales report is usually completed with total sales, paid-out expenses, tips paid and other items.
These entries form a sales journal. Just as with sales, each day
purchases are made, deliveries received and amounts posted on ...The reason Prime Cost
a journal by cost category (e.g., meat, seafood, grocery). These is such an important
entries form the purchase-disbursement journal. Each time number is that it provides
payrolls are completed (weekly, twice monthly) the payroll feedback on how well a
journal listing each detail by person and by department is restaurant manages its
created. At the end of the reporting period a complete inventory largest and most volatile
of all food and beverage items is entered into the general ledger costs: food, beverage and
by category. This inventory amount becomes the beginning hourly labor..
inventory amount for the next period. Knowing where the
numbers come from makes it so much easier to manage by the numbers, and to find the right
numbers when you need to review a particular cost.
Managers and their key staff should review their restaurant's monthly profit-and-loss statement
as soon as it is available. The P&L is the unit's monthly report card. For many who track sales,
labor cost and purchases each week, the P&L may be more confirmation rather than information.
In any case there are typically a few items that appear questionable and deserve further review
and attention.
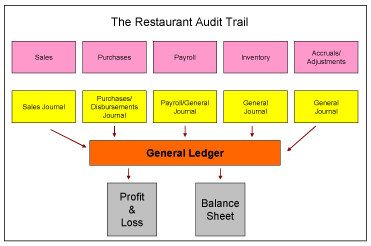
Where do we go when we have cost questions? You ask the restaurant audit trail, as illustrated
below.
http://www.restaurantowner.com/members/1272print.cfm 5/21/2010How to Manage Your Restaurants Critical Numbers and Avoid Financial Loose Ends Page 6 of 8 For example, if the profit-and-loss statement indicates a meat cost of 11.3 percent and your restaurant normally runs an 8 percent you would check the general ledger to see that the beginning inventory and ending inventory were correct. You would review the purchase journal to confirm that purchase transactions were recorded properly. In this case there was a meat purchase posted twice. This artificially increased the meat purchase total, which led directly to high cost percentage on the P&L. In another example, all food and beverage costs looked higher than previous months. A check of the sales journal showed that neither of the catered private parties had been recorded. When the sales were adjusted, the cost percentages for each food and beverage category appeared to be in line with budget. Tied and True Michael Passalacqua, owner of Angelo's in Washington, Pennsylvania, ties together selected numbers each week for his managers' meeting. He learned that by taking inventory of key items and totaling food and beverage purchases each week, managers could estimate a food cost at each meeting. This kept them better educated and more aware of lost-of-sales trends. By tying weekly staff schedules to recent payroll journals, Michael is also able to estimate hourly labor cost each week. In Austin, Texas, Mark Fleming, manager of Chez Zee American Bistro, prepares weekly numbers each Monday for their restaurant managers' meeting. Mark breaks out sales records by day, compares them with plan, and the most recent six-week average. By listing per-person check averages and daily customer counts, managers can better tie sales trends together. Goals are set and specials developed to maintain check averages and sales levels. This has proven to be a successful tool in keeping the management team focused and sales levels maintained. Tying it All Together Whether it's for sales forecasting or cost confirming, knowing where your numbers come from and how to find them when questions are asked is a necessary first step to properly tie your numbers together and manage your restaurant more effectively. -- Restaurant Startup & Growth http://www.restaurantowner.com/members/1272print.cfm 5/21/2010
How to Manage Your Restaurants Critical Numbers and Avoid Financial Loose Ends            Page 7 of 8

Case in Point:
The Value of a Proper Inventory

A popular catfish restaurant noticed a spike in the cost of seafood on their recent profit-and-loss
statement. This was particularly disturbing considering that the price of most seafood had been
lower than previous months. A disturbed management team reviewed the purchase journal
carefully, confirming each transaction. They became more confused when each delivery, quantity
and price checked out. A closer look at the ending inventory showed the dollar amount to be
much lower than usual. Further review of the inventory showed one storage refrigerator was not
included in the count. Once the inventory was adjusted, the seafood cost appeared to be in
range.

Tying in Your Prime Cost
Almost without exception, the most successful independent operators we see today not only
deliver a quality dining experience for their customers, but also keep a constant watch on the
financial performance of their restaurant. As one of our readers recently said, "If you don't know
your numbers, you don't know your business."

In a low-margin business in which sales can fluctuate and controlling costs requires constant
vigilance, operators of consistently profitable restaurants don't wait until the end of the month to
learn how their restaurant performed. While their monthly or four-week financial statements are
important, they're used mainly to confirm what they already know. As another operator said, "If I
waited until the end of the month to know how my restaurant was doing, it would be too late."

To get meaningful, timely information on how their restaurant is doing, many get a "Prime Cost"
report at the end of each week.

A "Prime Cost Report" includes cost of sales (food, beverage and paper goods in quick-serve
restaurants) and all payroll costs, including the gross wages of management and hourly staff plus
payroll taxes and employee benefits such as workers' compensation and employee insurance.
(RestaurantOwner.com members can access a Weekly Prime Cost Worksheet at
www.restaurantowner.com/public/189.cfm.)

The goal in most table-service restaurants is to keep Prime Cost, as a percentage of total sales,
at 65 percent or less. Quick-serve restaurants often shoot for a Prime Cost at or below 60 percent
of sales. The reason Prime Cost is such an important number is that it provides feedback on how
well a restaurant manages its largest and most volatile costs: food, beverage and hourly labor.
These three costs often represent 90 percent of the costs in most restaurants that are
controllable in the short term.

Calculating prime cost weekly, 52 times a year, versus monthly gives operators a good shot at
nipping any problems in these areas quickly.

Many smart operators also know their sales break-even point based on monthly and weekly sales
volumes. Knowing their sales break-even and understanding the relationship between sales
volume and their restaurant's operating costs, they can quite accurately peg how much profit
their restaurant should make per week or month based solely on the amount of sales generated.

These operators develop profit expectations based on knowing just their sales volume. If the
actual numbers on their profit-and-loss statement (P&L) differ from this by much it usually means

http://www.restaurantowner.com/members/1272print.cfm                                       5/21/2010
How to Manage Your Restaurants Critical Numbers and Avoid Financial Loose Ends               Page 8 of 8

either their P&L contains errors or they have an operational problem to deal with.

                                    Copyright © 1998-2010 RestaurantOwner.com
                          All Rights Reserved. Reproduction without permission prohibited.

http://www.restaurantowner.com/members/1272print.cfm                                          5/21/2010
You can also read