HY 2019 Results Presentation | August 27, 2019 - B&S Group
←
→
Page content transcription
If your browser does not render page correctly, please read the page content below

HY 2019 Results Presentation | August 27, 2019

                                                 1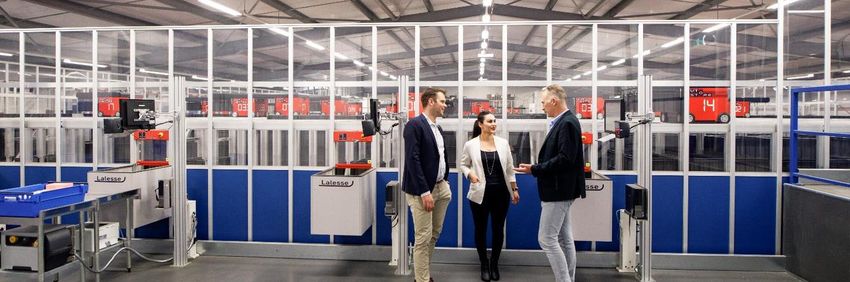
Today’s speakers

  Bert Meulman, CEO                      Gert van Laar, CFO

                                         •   CFO since 2009
  •   CEO since 2004
                                         •   Former CFO of Paul Global, acquired
  •   Joined B&S in 1992, held several
                                             by B&S Group in 2000
      leadership positions
                                         •   Chartered Accountant and 8 years at
  •   Shareholding partner since 1995
                                             PWC and other senior finance
                                             positons

                                                                                   2
Agenda

▪ HY 2019 Highlights
▪ HY 2019 Financial Review
▪ Outlook
▪ Q&A

                             3
HY 2019 Highlights

                     4
HY 2019 – Financial Highlights

Overall turnover growth   ▪   17.1% to € 898.3 M

Organic turnover growth   ▪   Growth of 7.4%

  Business segment        ▪   All segments contributed to turnover growth with HTG fuelling growth
    contribution          ▪   HTG +28.5% | B&S +0.5% | Retail +1.6%

                          ▪   EBITDA amounted to € 52.9 M
        EBITDA            ▪   pre IFRS 16 EBITDA came in at € 48.1 M

                          ▪   Solvency close to 34%
   Financial position     ▪   Net debt / EBITDA at 2.9

                                                                                                     5
Key developments HY 2019

Investments on Group level                Performance on Segment level
▪ Expansion of robotised warehouse in
                                          ▪   Growth driven by Health & Beauty value retail and e-commerce markets
  HTG segment and combined with
  FNET technology to further boost        ▪   Strengthened international positions, intensified relationships in value
  Health & Beauty category                    retail and increased focus on the online platform business
                                          ▪   Synergies from combined sourcing in Health & Beauty category
▪ Logistics operations in B&S Segment
  fully on track
                                          ▪   Maritime market circumstances remain unfavourable
▪ Acquisition Lagaay Medical Group in     ▪   Opportunities identified in remote markets
  B&S Segment enhances single source      ▪   Performance in B&S Segment as expected given market conditions and
  supply concept                              additional costs in logistics (as communicated) with clear performance
                                              improvement in B&S Segment trend noticeable in H2
▪ Acquisition Rotterdam & Weeze
  Airport in Retail Segment strengthens   ▪   Lagaay integration into the B&S Segment in preparation
  regional store portfolio
                                          ▪   Retail segment performed as expected

                                                                                                                         6
HY 2019 Financial Review
7Key figures HY 2019
€ million (unless otherwise HY 2019 HY 2019 HY 2018 Δ (%)
Commentary
indicated) reported pre IFRS 16 reported reported
Profit or loss account
▪ Turnover grew 17.1%, gross
Turnover 898.3 898.3 766.9 17.1% profit grew 19.9%, margin was
Gross profit 126.3 126.3 108.5 19.9% 14.1%
EBITDA 52.9 48.1 45.9 15.2%
Depreciation & Amortisation 12.1 7.6 4.4 ▪ EBITDA grew 15.2%
Profit before tax 35.1 35.5 38.4 (8.6%) ▪ IFRS 16 positively impacted
EBITDA by € 4.8 M, logistical
costs B&S Segment negatively
impacted EBITDA
▪ Fnet realises over 60% of
EBITDA in H2, as such
straight-line amortisation of
intangible fixed assets has a
material impact on contribution
to results in H1 from Fnet
8Overall turnover growth analysis
Commentary
▪ All segments contributed to
turnover growth but it was
fuelled by the performance of
HTG
▪ The inclusion of the acquisition
of FragranceNet.com
contributed € 81.8 M of which
€ 6.9 M organic growth
9HY 2019 - Financial position
€ million (unless stated otherwise) HY 2019 HY 2018 Commentary
Financial position ▪ Financial position within pre-
determined objectives
Solvency ratio 33.7% 37.3%
▪ Balance sheet and as such
Net debt 329.8 277.0
solvency impacted by € 87 M
Net debt / EBITDA 2.9* 2.7 intangibles following Fnet
Inventory in days 98 103
acquisition
Working capital in days 100 107 ▪ Net debt increase mainly
resulting from Fnet acquisition
and associated consolidation,
and the investment in working
capital
▪ Increase in working capital:
mainly related to inventory
supporting our growth
expectations; working capital in
days improved
*Taking into account the LTM EBITDA of FragranceNet.com
10Net debt development HY 2019
Commentary
▪ HY 18 negative cash flow from
operating activities: € 48.2 M HY
19 only: € 0.4 M. Investment in
inventory in 2019 set-of by cash
inflow from late Q4 2018 sales
as indicated at FY18
▪ Dividend represents payment to
minority shareholders
FragranceNet
▪ Investing activities mainly
investment in software € 3.0 M
and logistical infrastructure €
7.1M
▪ Net debt excluding IFRS 16
11Working capital development
(€ x 1,000) HY 2019 HY 2018 Commentary
Inventory ▪ Inventory development (+14%) in line with business
431.9 379.0
(days)
(98) (103)
development (+17%)
Trade receivables
▪ Trade receivables in line with business development
(days) 193.4 160.5
(38) (37)
▪ Increase in trade payables is fully in line with the increase in
turnover and inventory
Trade payables 112.6 79.2
550.0 2,100.0
500.0 1,900.0
Working capital 450.0
512.7 460.3 1,700.0
(days) 400.0
(100) (107)
350.0 1,500.0
300.0 1,300.0
2016 HY 2016 FY 2017 HY 2017 FY 2018 HY 2018 FY 2019 HY
WC Turnover
12Outlook
13Outlook
Management focus Expectations H2 and beyond
▪ Expanding e-commerce ▪ Strong H2 in Health & Beauty with new business opportunities in B2B
platform business distribution to value retailers and e-commerce platforms
▪ Roll out of FragranceNet.com ▪ Demand in online B2C business of FragranceNet.com continues to grow
outside the USA
▪ Seasonality further amplified and continued trend in sales shifting to late Q4
▪ Integration of Lagaay into B&S
Segment ▪ Turnover growth and - over time - profitability at stable margins in B&S
Segment by serving volume contracts in a cost-efficient way
▪ Capturing further opportunities
for organic growth ▪ Lagaay expected to contribute to maritime and remote business in B&S
segment
▪ New shop openings to contribute to turnover and profitability in Retail
14Q&A
1516
You can also read