HY2021 RESULTS FOR THE SIX MONTHS ENDED 31 DECEMBER 2020 - COMMODITY HOUSE PHASE II MOZAMBIQUE - Grit Real Estate Income Group

Page created by Frederick Henderson
 
CONTINUE READING
HY2021 RESULTS FOR THE SIX MONTHS ENDED 31 DECEMBER 2020 - COMMODITY HOUSE PHASE II MOZAMBIQUE - Grit Real Estate Income Group
HY2021           RESULTS
FOR THE SIX MONTHS ENDED
31 DECEMBER 2020

                            COMMODITYHOUSE
                           COMMODITY  HOUSEPHASE
                                            PHASEII1
                            MOZAMBIQUE
                           MOZAMBIQUE
HY2021 RESULTS FOR THE SIX MONTHS ENDED 31 DECEMBER 2020 - COMMODITY HOUSE PHASE II MOZAMBIQUE - Grit Real Estate Income Group
Proceedings

                               BRONWYN KNIGHT
      Introduction             Chief Executive Officer
                               BCom (Acc), CA(SA)
      Key Highlights           •     2019 EY Entrepreneur of the Year Award
                                     Winner (Exceptional Category, Southern
                                     Africa)
      Portfolio Overview       •     2015 Top CA(SA) under 35 Award Winner

      Financial Review
      Growth & Pipeline
                                   LEON VAN DE MOORTELE
      Sustainability Targets       Chief Finance Officer
                                   Bcompt (Hons), CA(SA)

      Closing Remarks
      Annexures

Ι 2
HY2021 RESULTS FOR THE SIX MONTHS ENDED 31 DECEMBER 2020 - COMMODITY HOUSE PHASE II MOZAMBIQUE - Grit Real Estate Income Group
Introduction
HY2021 RESULTS FOR THE SIX MONTHS ENDED 31 DECEMBER 2020 - COMMODITY HOUSE PHASE II MOZAMBIQUE - Grit Real Estate Income Group
The African Opportunity
                                                                                                                                              Mauritius ranks
                                                                                                               50%                                                                       3.4%                    40%
    Why Africa                             2.6 Bn+                                54                        urbanisation
                                                                                                                                                   13th                          Regional Growth
                                                                                                                                                                                                             Africans will be
                                        Population by 2060                     countries                                                  Ease of doing business                                            middle-upper class
                                                                                                              by 2030                                                                 2021                       by 2030
                                                                                                                                                worldwide

                                                                                                                                                                                                                         RISING
                                                           STRONG POPULATION                                        INCREASING                                            GROWING
    Key Trends                                                       GROWTH                                   ECONOMIC GROWTH                                          MIDDLE CLASS
                                                                                                                                                                                                               INFRASTRUCTURAL
                                                                                                                                                                                                                   DEVELOPMENT

                                                                                                                                                                                         The world’s youngest populations
                                                       Investment in Africa                                               Demand for City living
                                                                                                                                                                                                   are in Africa

   Key Insights

Source:
https://www.imf.org/en/Publications/REO/SSA/Issues/2020/06/29/sreo0629
https://www.doingbusiness.org/content/dam/doingBusiness/pdf/db2020/DB20-FS-SSA.pdf
https://www.investopedia.com/articles/investing/100614/interested-invesing-africa-heres-
how.asp#:~:text=The%20African%20continent%20is%20incredibly%20rich%20in%20natural%20resources.&text=As%20such%2C%20Africa%20has%20become,relatively%20cheap%20educated%20labor%20force
Deloitte – The Deloitte Consumer Review. Africa: A 21st century review. https://www2.deloitte.com/ng/en/pages/consumer-business/articles/consumer-review-africa.html
https://www.weforum.org/agenda/2019/08/youngest-populations-africa/
HY2021 RESULTS FOR THE SIX MONTHS ENDED 31 DECEMBER 2020 - COMMODITY HOUSE PHASE II MOZAMBIQUE - Grit Real Estate Income Group
*Combined exposure to pre-funding developments and Grit’s equity ownership to Gateway Real Estate Africa not to exceed 20% of Gross asset value
HY2021 RESULTS FOR THE SIX MONTHS ENDED 31 DECEMBER 2020 - COMMODITY HOUSE PHASE II MOZAMBIQUE - Grit Real Estate Income Group
Our High-quality
                                                                                                                                                               Tenants
Grit at a glance
                                                              GEOGRAPHIC SPLIT1
Geographic & sectoral diversification
                                                                                                                   FINANCIAL HIGHLIGHTS #
                                        Mozambique
                                                                        3.2%
                                        Mauritius                    3.7%
                                        Zambia
                                                                  3.8%
                                                                                                               46.5%                      5.8%
                                        Morocco
                                                            6.5%                                              PROPERTY LTV                  WACD
                                                                                          39.3%
                                        Ghana          8.7%
                                        Kenya

                                        Botswana            9.9%                                                   PORTFOLIO HIGHLIGHTS #
                                        Senegal
                                                                         23.4%
                                        Other
                                        Investments                                                       US$849.2m                      88.7%
                                                                                                                  assets2               Multinational
                                                                   SECTORAL SPLIT1                                                        tenants

                                                                      3.7%
                                                                   4.1%
                                                                                                               93.0%                     92.0%
                                                                                       27.7%                  income hard
                                                       15.5%                                                                           EPRA Occupancy
                                                                                                                currency

                                                                                                                  5.2                     2.9%
                                                            22.9%
                                                                                                                  years                weighted average
                                                                                    24.7%                         WALE                  lease escalation
                                                                                                               (by Income)             p.a. (by Income)

                                                                                                          #   as at 30 December 2020
                                           Office                           Hospitality
                                           Retail                           Corporate Accommodation
                                           Light Industrial                 LLR
                                           Other Investments

                                                        1 split  by Asset Value, Grit economic interest
                                                        2   total income-producing assets
HY2021 RESULTS FOR THE SIX MONTHS ENDED 31 DECEMBER 2020 - COMMODITY HOUSE PHASE II MOZAMBIQUE - Grit Real Estate Income Group
De-risked Investment Strategy

       01 02                                                03                                Margins                                         04                        05               06
                                                                Political risk
                                                                                                of
                                       Repatriation                                                                                                              Ability to
        Hard currency
                                         of funds
                                                                  & macro-
                                                                 economics
                                                                                              Safety                              Land tenure
                                                                                                                                                                 raise debt
                                                                                                                                                                                      Counterparty

        CURRENCY                       TENANCY                      REPATRIATION                      COUNTRY                      OPERATIONAL                   OVEREXPOSURE            POLITICAL
          RISK                           RISK                           RISK                            RISK                           RISK                          RISK                  RISK

      Prioritisation of             Prioritisation of              Robust relations                  Target stable                   Reputable                                         Comprehensive
                                                                                                                                                                      Defined
      assets with USD              long-term leases                with the Central               jurisdictions that                experienced                                          Political Risk
                                                                                                                                                                   diversification
        or USD/Euro                  with blue chip                Bank, hedging &                  satisfy our key                  in-country                                        Insurance (PRI)
                                                                                                                                                                 strategy in place2
       denominated                   multinational                   monitoring                       investment                    partners and                                        cover in place
           leases                       tenants                        policies                         criteria1                     property
                                                                                                                                     managers

           Notes:
           1 – i.e. stable governance/political maturity, strong USD/FDI inflows, USD-based economies, high growth rates, acceptable sovereign ratings and outlook
               by ratings agencies, solid economic fundamentals, clear tax regime
           2 – i.e. target not more than 25% of the GAV Group in any single investment; target not more than 25% of the GAV of the Group in any single country
Ι 7
HY2021 RESULTS FOR THE SIX MONTHS ENDED 31 DECEMBER 2020 - COMMODITY HOUSE PHASE II MOZAMBIQUE - Grit Real Estate Income Group
VDE HOUSING ESTATE
             MOZAMBIQUE

Highlights
HY2021 RESULTS FOR THE SIX MONTHS ENDED 31 DECEMBER 2020 - COMMODITY HOUSE PHASE II MOZAMBIQUE - Grit Real Estate Income Group
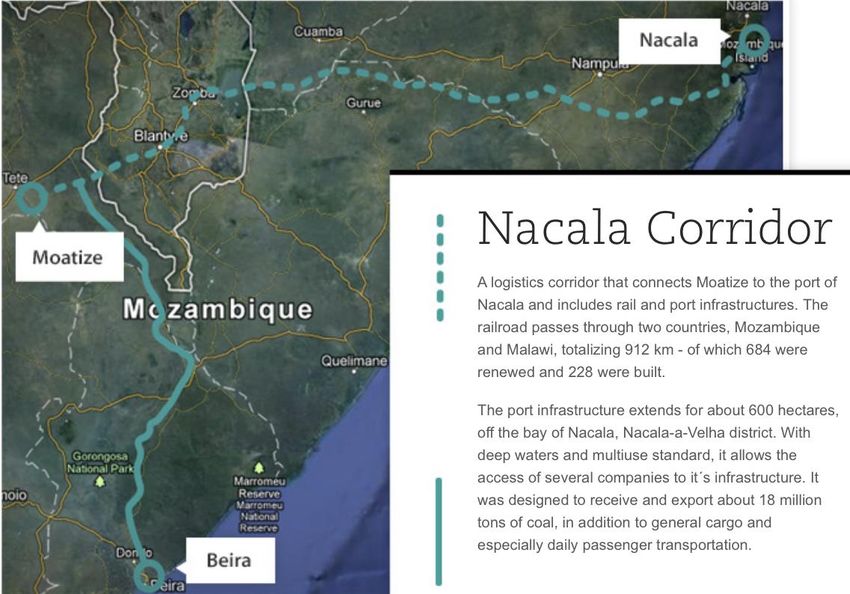
HY2021 Highlights & Trends (31 December 2020)
Solid operational performance in a challenging environment

              US$849.2m                                         US$1.244                                   8.0%                                        +8.1%
                    (+3.1%)                                         (+6.3%)

         Total Income                                        EPRA NRV per                           EPRA Vacancy                          Net Operating Income
       Producing Assets1                                        share 2                                 rate3                               (incl. Associates)4
            FY2020: US$823.5m                                  FY2020: US$1.171                          FY2020: 5.9%                             Like for like +0.9%

      1. 2.2% like-for-like property valuation        2. EPRA NRV excludes deferred tax on   3. Driven by increases in retail vacancies   4. Revenue weakness (-6.2% like for
      increase                                        Property                                                                            like) offset by strong cost control

                   91.4%                                          49.3%                                 US$37.3m                                    US$1.5 cps

                                                                                                   Asset Recycling                             Resumption of
          Collection Rates5                                   Group LTV6
                                                                                                     Initiatives7                                Dividend8
             July-December 2020                               FY2020: 50.2%                                                                    HY2020: US$5.25 cps

      5. As a % of Grit attributable                  6. Near term LTV target of 45%           7. Partial sales of Anfa and Acacia         8. Potential for further one-off
      contracted revenue                                                                                                                   quarterly dividend

Ι 9                                              **Post Balance sheet: Premium listing & Guernsey redom completion
HY2021 RESULTS FOR THE SIX MONTHS ENDED 31 DECEMBER 2020 - COMMODITY HOUSE PHASE II MOZAMBIQUE - Grit Real Estate Income Group
Key Group Strategic Focus Areas
Focus on managing our assets and improving balance sheet strength through strict debt collection and cost control

1. Collections focus, cost control                                                          2. Addressing rising Vacancy                                              3. Strengthening Balance
and protecting existing portfolio                                                               rate (8.0% at 31 Dec ’20)1                                           sheet and Group liquidity2

     4. Resumption of Dividends in                                                         5. Leveraging Premium Listing                                             6. Selective acquisitions and
               FY20213                                                                         and Guernsey redom4                                                   investments tied to funding
1.     8.0% at 31 December 2020 (from 5.9% at 30 June 2020), largely driven by movements in retail which has been impacted by ongoing COVID-19 lockdowns
                                                                                                                                                                               initiatives5
2.     Targeting near term LTV of below 45% by way of asset recycling, debt repayments, equity preference notes, accretive acquisitions and valuation recovery
3.     The Board expects to resume dividends in the 30 June 2021 financial year, supported by recent strong collection trends
4.     Positions the company favourably for potential FTSE index inclusion and sector consolidation opportunities
5.     Funding initiatives include Capital Recycling through disposals of assets, issuance of hybrid equity instruments to DFI’s and Government Support Programmes
Ι 10
COVID-19 Impact on Rental Collections
Rental collection impacts improving through to December 2020 (>90%)
                                                                        Corp.                       Light       Total July to   Total Mar to
                                                    Office   Retail                Hospitality
                                                                       Accomm                     Industrial     Dec 2020         Jun 2020
    Contracted Rent                                 100%     100%       100%          100%          100%           100%            100%
    Rent deferrals                                   0%      (0.5%)     0%           (13.8%)          0%           (2.9%)         (14.4%)
    Rent Concessions                                 0%      (14.4%)    0%             0%             0%           (4.4%)          (8.7%)
    Expected collection rate                        100%     85.1%      100%          86.2%         100%           92.7%           76.9%

    Collections (% of contracted rent)              101.2%   84.1%     98.7%          80.2%        101.5%          91.4%           86.0%
    Movement in debtors balances                    (1.2%)     1%       1.3%           6%           (1.5%)          1.3%           (9.1%)
    (incl. prior period rent deferral recoveries)

•      c.4.4% short term rental concessions granted, mostly in retail. Although collection rates in retail have improved, these are now off
       significantly lower contracted amounts for all leases renewed in the period

•      c.2.9% short term payment deferrals agreed (mostly hospitality). Mauritius COVID landlord act legislating a 6-month rent deferral
       became chargeable once again from September 2020 and collectible over the-18 month period to Dec 2021

•      Debtors balance movements include arrears collections and rental prepayments
Ι 11
Valuation movements for 6 months to 31 December 2020
COVID-19 valuation impacts have moderated

                                                                                                               •     Uptick experienced in valuations
                                                                                               Like for Like         across office, hospitality, light
                                                    Total Like for
                          Fair value   FX & other                                 BALANCE      % move for 6          industrial, corporate
                                                     like move       Additions
                          movement      impacts                                  31 DEC 2020    months to            accommodation and LLR lease
                                                      (incl FX)
                                                                                                31 Dec 20            escalation and stabilization in
                                                                                                                     discount rates
                           USD'000      USD'000       USD'000        USD'000      USD'000           %
           Office           3,769         275          4,044            30        203,449           2%         •     Downward valuation trend evident
                                                                                                                     in retail sector on rising vacancy and
           Retail          (14,847)      6,083         (8,810)         330        210,091         -3.7%              downward adjustment to lease rates
         Hospitality        2,999       14,995         17,994         1,225       181,509         11.1%
                                                                                                               •     Hospitality sector valuation moves
       Light Industrial     1,266         107          1,373          1,431        33,039          4.5%              predominantly as a result in
        Corp                                                                                                         movements in the EUR exchange
                             118          655           773             13        138,980          0.6%              rate and fair value movement on
   Accommodation
                                                                                                                     Club Med removal of hardship
             LLR             232          588           820           3,302        27,345          3.5%              clause
            GREA             135           -            135            2335         7,479          2.7%            *Total of fair value gains of properties including
                                                                                                                   associates and joint ventures, excluding fair value
                                                                                                                   adjustment from contractual receipts from vendors
           TOTAL*          (6,329)      22,658         16,329         8,666       801,893          2.2%

Ι 12
Continuing COVID-19 Impact on Grit’s Real Estate Sectors
Resilient portfolio performing well, with >90% of contracted revenue value collected in July-December 2020
                                           Focus on         Corporate  Accommodation,
                                                             Corp. Accommodation,      Industrial
                                                                                  Industrial, Officeand
                                                                                                     and Office sectors
                                                                                                         Other investments
                                          supporting        • Collectively 52.4%1 of Grit’s property assets (30 Dec 2020)
                                       exposed tenants      • Continue to remain largely unaffected to date
                                         in hospitality
                                       and at AnfaPlace      Hospitality sector
                                                            Hospitality  sector (Mauritius,
                                                                                (Mauritius,Senegal)
                                                                                            Senegal)
                                                            • 25%1 of Grit’s total NAV (30 December 2020)
                                                            • Club Med rental deferrals have been recovered
                                                            • Mauritian operators have resumed part payments (expected to
                                                              improve upon MIC disbursements and opening of Mauritian
                                                              borders)
                                                             Retailsector
                                                            Retail  sector (Morocco,
                                                                           (Morocco, Zambia,
                                                                                     Zambia,Mozambique,
                                                                                             Mozambique,Kenya)
                                                                                                          Kenya)
                                                            • 23%1 of Grit’s total NAV (30 December 2020)
                                                            • Anfa Place experiencing highest increase in vacancies following
                                                              H&M exit. Travel restrictions impacting fit-out, due diligence and
                                                              new lease signature processes
                                                            • Rising vacancy trend across the rest of portfolio, Mall de Tete,
                                                                  Buffalo Mall and Zimpeto Square up from prior period,
                                                                  however on Group basis are not material cost of vacancy
                                                          Notes:
                                                          1. By Grit Economic Interest
Ι 13
EPRA vacancy contribution by property
c.2% EPRA vacancy increase in six months to 31 December 2020 primarily driven by Retail
                                                                                                                       • Anfa Place Shopping Centre
                                                                                                                         Exit of H&M and delays in tenant take-up primarily
                                                                0.4%           0.2%                                      driven by COVID-19 lockdowns. c.3,000m²
                                             0.5%                                                                        committed for take-up by 2021 Q3, reducing the
                                                                                              0.2%                       GLA vacancy to the expected c.20%.
                           1.3%
                                                                                                                       • Buffalo Mall
                                                                                                                         Early exit of Tusky’s Supermarket (3,861m²) due to
                                                                                                                         business liquidation, resulting in 68% mall vacancy.
                                                                                                                         Positive negotiations in progress with 2
                                                                                                                         replacement major retailers.
                                                                                                                       • Commodity Phase 1
                                                                                                                         Strategic vacancy of Mitsui and Schlumberger
                                                                                                                         (649m²) to accommodate Total additional space.
                                                                                                          8.0%           Lease commenced effective 1 January 2021.
                                                                                                                       • LLR
           5.9%                                                                                                          Positive Leasing activity over the period
                                                                                                                       • Mukuba Mall
                                                                                                                         Increased Vacancies from fashion retailers and
                         Retail – 83%                                                  Retail – 84%                      smaller restaurants. Expected to be filled after
                         Office – 10%                                                  Office – 13%                      Covid restrictions have been lifted
                         Other – 7%                                                    Other – 3%

       EPRA V ACAN CY   ANFAPLACE       BUF F A L O MA L L   C O MMO DITY   MUKUBA MA L L      LLR    EPRA V ACAN CY
        A S A T JUN E    SHO P P IN G                         HO USE P H1                                 AS AT
            2020          C EN TER                                                                      DEC EMBER
                                                                                                          2020

Ι 14
Retail sector update
Exit of predominantly fashion retailers in favour of stronger international food and services operators

            MOROCCO – ANFAPLACE MALL (ENCLOSED)                                      ZAMBIA – KAFUBU, MUKUBA, COSMO MALL
                                            •    AnfaPlace Mall monthly cost                          •   Mukuba, Kafubu and Cosmo
                                                 of vacancy c.US$283k                                     monthly cost of vacancy
                                            •    Attributed to exit of H&M and                            c.US$22k; c.US$3k and
                                                 Swatch (1945m2)                                          c.US$28k respectively
                                            •    Increased take up of storage                         •   In talks with major
                                                 units, 4-in-1 street retail lease                        international Turkish fashion
                                                 concluded during the period                              retailer to take up space in
                                                                                                          Mukuba Mall

       MOZAMBIQUE – ZIMPETO SQUARE, MALL DE TETE                                             KENYA – BUFFALO MALL
                                             •    Zimpeto Square and Mall de                          •   Buffalo Mall monthly cost of
                                                  Tete monthly cost of vacancy                            vacancy c.US$3.5k
                                                  c.US$22k & c.US$48k                                 •   Attributed to exit of local
                                                  respectively                                            supermarket anchor (Tuskys)
                                             •    In talks with SA Healthcare                         •   Advanced discussions with
                                                  operator to take up vacant                              Carrefour to take up
                                                  space at both malls                                     supermarket anchor space

Note: Monthly cost of vacancy calculated on a year-to-date basis
Ι 15
COVID-19 impact: Hospitality sector
Rent payments materially resuming in September 2020, looking to 2021 for consistent collection rates

                             MAURITIUS HOSPITALITY PORTFOLIO (BEACHCOMBER & LUX)

  • All hotels operational – Tamassa and Canonnier open for domestic use, Mauricia and Victoria
       being used as designated quarantine facilities.

  • NMH Group (Beachcomber)1 resumed partial rental payments from 1 August 2020, while Lux
       resumed rental payments from September 2020. Lux was fully paid up2 as at 31 Dec 2020.

                                                                                                   SENEGAL HOSPITALITY ASSET (CLUB MED)
                                                           • Rental deferral with Club Med fully paid up as at 31 December 2020.

                                                           • Revised development programme agreed by parties with EUR2M deployed at the end of
                                                              2020, and EUR5M spend allocated for 2021, facilitating targeted re-opening in Q4 2021.

                                                           • Hardship clause removed, now minimum 50% rental payment agreed until resort reopening

                                                           • Phase II development programme starting Q1 2021, targeted for completion in Q4 2022.
Notes
1 NMH accounts for 11.8% of the Group’s attributable contracted rental revenue
2 Save for 3 month COVID-19 rebate due by 31 December 2021. This outstanding rental payment amount will be predominately collected through to December‘21

Ι 16
Investment & Corporate actions update
   Grit has successfully delivered a series of quality acquisitions, capex additions and strategic corporate actions in the
   period, positioning the Group well for future growth

                               Conversion to £ quote          AnfaPlace Mall,               Bolloré,                   Acacia Estate,           Premium Listing on
       JSE Delisting                                                                                                                                                         Redom to Guernsey
                                    on the LSE                   Morocco                   Mozambique                  Mozambique                    the LSE

       July 2020                 August 2020              September 2020               September 2020                October 2020                 January 2021                February 2021

 Delisted from the JSE on    LSE stock quote converted     Disposed of a 39.5%              Commenced                Disposal of 17.35%       Officially migrated to the   Focusing on improved
       29 July 2020            to Sterling on 3 August      interest in the Mall,    redevelopment of Bolloré     interest in Acacia Estate   Premium segment of the        liquidity as a result of
                                         2020            therefore reducing retail    warehouse in Pemba, on     down to a combined direct       Main market of the           consolidated listing
Now primary listed on LSE,                               sector exposure to c.25%     the strength of a new 5-     and indirect interest of   London Stock Exchange.       structure, eligibility for
 secondary listed on SEM                                                             year lease for a budgeted      62.65% at an implied                                      index inclusion and
                                                                                           contract value            property valuation                                    diversified shareholder
  ZEP-RE (Kenya) & BDC                                                                      of US$7.62m                of c.US$67.5m                                                 base.
 introduced as strategic
      shareholders

      Ι 17
COMMODITY HOUSE
                     MOZAMBIQUE

Portfolio overview
Portfolio Characteristics (HY2021)1
                                                                    By Grit Economic                   By Grit proportionate
                                                                        interest                           consolidation

                                                                            3.2%                                3.0%
          KEY METRICS                                                3.8%
                                                                         3.7%
                                                                                                         3.5%
                                                                                                             3.4%

          EPRA Occupancy                                                                               6.0%
                                                                   6.5%
                 92.0%                                                                       39.3%                            39.1%
                                                     GEOGRAPHIC   8.7%                               10.6%

     Multinational Tenants2
                                                                   9.9%                               11.7%
                 88.7%
 2. Forbes 2000, Other Global & pan African tenant                               23.4%                               21.4%
 (by revenue)

      Contracted Escalation3
                   2.9%                                                        1.4%                                  1.3%
                                                                            3.7%                                  3.4%
 3. Weighted average annual escalation (by income)
                                                                          4.1%                                 3.7%
           Hard Currency4                                                                  27.7%                             25.4%
                                                                  15.5%                                17.3%
                  93.0%
4. Hard or pegged currency rental income              SECTOR
                  WALE5
                                                                   22.9%                                                     22.6%
               5.2 years                                                                 24.7%               26.2%

5. Weighted Average Lease Expiry (by Income)
Income profile expiry
                                                                                        1
                                          Corporate Accommodation                 LLR           Office           Light Industrial                           Retail    Hospitality

                                                                                                                                                                                                                   100.0%
                                                                                                                                                                                                   86.9%
                                                                                                                     72.3%

                                                                                                                                                                                                           28.7%
                                                                                                                                    26.6%
                                                                                             26.0%

                                                                                                                                                                                           24.2%
                                 2

                                                                                            23.1%
                                                                                            23.2%
               21.0%

                                                                                                                                                                    20.6%

                                                                                                                                                                   20.3%
                              19.9%

                                                                   16.7%

                                                                                                                                                                  15.8%
                                                                                                                                                13.7%

                                                                                                                                                                 13.1%
                                                      3
                                             8.9%

                                                                                                                                                                                    7.8%
                                                                             7.1%

                                                                                                                             6.8%
                                            5.9%

                                                                                                          4.5%
                                                                            3.2%
                                          2.0%
        0.9%

                                          0.8%
                       0.2%
                       -

                                      -

                                          -

                                          -

                                                               -

                                                                           -

                                                                           -

                                                                                                      -

                                                                                                                 -

                                                                                                                                            -

                                                                                                                                                        -

                                                                                                                                                             -

                                                                                                                                                                            -

                                                                                                                                                                                -
           6 M O N THS                    1 2 M O N THS         2 4 M O N THS               3 6 M O N THS              4 8 M O N THS                          6 0 M O N THS     >6 0 M O N THS
       Notes:
       1 Primarily driven by industrial sector (70%)
       2 6 months income expiry – 19.9% Retail:

                1.      Cosmopolitan Mall – celebrates its 5th anniversary resulting in all original leases terminating simultaneously on 28 February 2021. Numerous agreements have already been
                        pre-empted, however remaining leases totaling 27% remain under negotiation for renewal.
                2.      Anfa – International Retail Morocco expires in June 2021, renewals are currently being concluded for up to 9 year lease terms.
       3 5.9% of Retail expiring in the next 12 months mainly in the fashion industry

Ι 20
Top 15 Tenants (as at 31 December 2020)
Majority of portfolio income generated from strength of multinational tenancies
                                                                            Income                          Lease       Lease
Rank Tenant                            Industry                                          Tenant Grading
                                                                      (% of Group Total)                  Covenant     Currency
   1     BEACHCOMBER                   Hospitality                         11.8%         OTHER GLOBAL     Triple Net     EUR
   2     TOTAL                         Mining and Natural Resources         9.9%            FORBES          Gross        USD
   3     VALE                          Mining and Natural Resources         9.8%            FORBES          Gross        USD
   4     VODACOM                       Communications                       6.7%            FORBES        Triple Net     USD
   5     TAMASSA RESORT BEL OMBRE      Hospitality                          5.9%         OTHER GLOBAL     Triple Net     EUR
   6     US EMBASSY                    Consular                             5.1%         OTHER GLOBAL       Gross        USD
   7     SHOPRITE                      Retail                               3.6%            FORBES          Gross        USD
   8     TULLOW OIL                    Mining and Natural Resources         2.8%         OTHER GLOBAL     Triple Net     USD
   9     IMPERIAL HEALTH SCIENCES      Logistics                            2.7%          PAN AFRICAN     Triple Net     USD
  10 EXXON                             Mining and Natural Resources         2.6%            FORBES          Gross        USD
  11 CLUB MED CAP SKIRRING             Hospitality                          2.6%         OTHER GLOBAL     Triple Net     EUR
  12 INTERNATIONAL RETAIL MOROCCO      Retail                               2.2%         OTHER GLOBAL       Gross       MAD
  13 GHANA COMMUNITY NETWORK SERVICES Communications                        1.8%         OTHER GLOBAL       Gross        USD
  14 GAME                              Retail                               1.6%            FORBES          Gross        USD
  15 ABSA BANK                         Finance and Banking                  1.5%          Other Global      Gross       MUR
Total                                                                      70.7%
1. Ranked by income
Ι 21
Vale potential exit from Mozambique
Quality asset subject to long lease mitigates near term risks

• Vale announced in late January the consolidation of its ownership in Moatize mine and the Nacala Corridor
  infrastructure project, and although re-iterated its intention to reshape mine operations and to ramp up
  production to 18mln tonnes, it also announced its intention to divest of its coal assets in Mozambique
➢ Vale have 3.5 years remaining on VDE Housing Estate lease.
➢ Vale remain committed to completing the project and still have
  US$2.5bln in capex to spend over the coming 24 months
➢ VDE housing estate is one of the only fully self-sufficient
  compounds with desalination plants, full back up generators and
  well-developed local infrastructure

Ι 22
Letting activities
Significant new lettings and renewals and commercial terms agreed in the 6 month period (100% basis)

                                                                                                                 2
PROPERTY                                 TYPE                TENANT                  SECTOR            AREA (M )     LEASE TERM
                                   Commercial terms
Vodacom Building                                             Vodacom                  Office            10,659          5.0
                                      agreed*
Mukuba Mall                             Renewal                Game                   Retail             5,060          4.9

Mukuba Mall                             Renewal               Shoprite                Retail             4,262          4.9

VDE Housing Estate                     New Deal                Tsebo          Corporate Accomodation     3,600          3.0

Anfaplace Shopping Center               Renewal              Label Vie                Retail             3,573          12.0

Cosmopolitan Mall                    Replacement           Cress Motors               Retail             2,539          4.9

Bollore                                 Renewal               Bollore                 Office             2,511          5.0

Mukuba Mall                             Renewal            Pick and Pay               Retail             2,240          4.9

Mukuba Mall                          Replacement         Home Essentials              Retail             1,510          2.0

Mukuba Mall                          Replacement        Carnival Furnishers           Retail             899            5.0

Total                                                                                                   36,853          5.2

* Vodacom Building commercial terms agreed, subject to final contracting

Ι 24
Financial Review
Financial highlights (as at 31 December 2020)
Robust cost control offset revenue weakness to generate strong profit from operations and net income growth. Well
positioned to rebound once COVID-19 impacts dissipate
                                                        31 Dec 2020     31 Dec 2019     12M Movement
       Dividend per share (US$ cps)                         1.50            5.25           (71.4%)
       Gross rental income (incl. associates) (US$ m)      31.6             31.7            (0.1%)
       Profit from operations (US$ m)                      12.9             10.7            19.7%
       Adjusted EPRA earnings per share (US$ cps)          3.16             5.67           (44.2%)
       Distributable earnings                              3.88             5.48           (29.2%)
       EPRA cost ratio (incl. associates) (US$ m)         14.3%            18.6%           (4.3ppt)

                                                        31 Dec 2020     30 June 2020    6M Movement
       EPRA NAV per share (US$ cps)                        124.4           117.1            6.3%
       Total Income Producing Assets (US$ m)               849.2           823.5            3.1%
       Weighted average lease expiry (years)                5.2             5.0              0.2
       EPRA portfolio occupancy rate                      92.0%            94.1%           (2.1ppt)
       Group LTV                                          49.3%            50.2%           (0.9ppt)
       Property LTV                                       46.5%            46.5%              -

Ι 26
EPRA Net Reinstatement Value evolution – HY21
                                                                                                     Portfolio Performance
US$ cents

 # Other non-cash items include: ECL provisions, movement in foreign currency translation reserve, and deferred tax
 Ι 27
Like for like Revenue and NOI y-o-y movement **
Strong Operating cost control offset revenue weakness; specifically in retail sector

                 HY2021                                                                 HY2021                                                                                  19.3%
                                                                                                                                                                                        21.0%
                 ➢ Revenue -6.2% on like for like basis                                 ➢ NOI +0.9% on like for like basis
                 ➢ Revenue -0.1% inclusive of acquisitions                              ➢ NOI +8.1% inclusive of acquisitions

                                               1.8%                                                                                                    2.4%    2.7%
                                                                           0.5%

                                                                 -0.8%                       -1.0%      -0.1%
                                                                                                                              -5.8%     -6.7%

                                  -19.1%

                                       Retail                       Office                   Corp. Accomm                     Light Industrial*         Hospitality                Other

       USD'000 movement               Retail            Office           Corp. Accomm    Light Industrial*      Hospitality           Other       L-F-L mvt      Acquisitions       Total
       Revenue                       (1,912.7)          (72.3)               (62.5)           (59.7)              124.5                20.4       (1,962.1)           1,933.2      (28.9)
       Net operating income            87.6              41.0                (5.8)            (67.4)              136.5                21.8        213.6              1,798.2      2,011.8

             * light industrial decrease as a result of Bollore being redeveloped
            ** Including Associates
Ι 28
Key financial metrics

         Income producing assets ($m), Group LTV (%), WACD (%)              Revenue and Net income ($m)                                         Interest cover (x)
                                                                                        Revenue
                                                                                        Total Comprehensive Income

                          Group LTV          WACD
                                                                                                       24.1           23.6                                  2.3x
                                                                               19.6    19.4 19.7
  1,000.0                                                      80.0%    15.3
                                                                                                              10.3                     2.1x       2.1x                2.1x
       900.0                      860.1                                                                                      6.4
                                                       849.2   70.0%
                                               823.5
                        796.4
       800.0
                                                               60.0%      HY18            HY19           HY20            HY21          HY18       HY19     HY20       HY21
       700.0   642.3                           50.2%   49.3%
                                                               50.0%
       600.0   51.4%                                                           Admin cost to asset value (%)                                  Net EUR exposure (€m)
                                  50.2%
       500.0            43.1%                                  40.0%
                                                                                                                1
       400.0                                                                                               2.1%                                   62.3
                                                               30.0%                                                         1
                                                                               1.5%                                      1.6%
       300.0             6.3%                                                               1.3%                                                                      57.7
                                      6.1%                     20.0%                                                                   54.9                 55.7
       200.0                                    5.9%
               5.7%                                     5.8%
                                                               10.0%
       100.0
                                                                               HY18         HY19          HY20           HY21          HY18       HY19     HY20       HY21
           -                                                   0.0%
               HY18     HY19      HY20         FY20    HY21
                                                                       1. Impacted by one off professional costs and increased staff
                                                                       compliment ahead of acquisitions and premium listing

Ι 29
Loan to value (“LTV”)
Deleveraging and strengthening of the balance sheet is a strategic imperative in the medium term

                                          COVID-19 pandemic

                                                          GRIT COVID-19 initiatives

               51.4%                            50.2%                                         Initiatives under consideration to achieve
       49.2%                                                  49.3%
                                       43.9%                           45.0%                  LTV target in the near and medium term:
                       43.4%   43.1%
                                                                                35% - 40.0%
                                                                                              Initiatives                    Potential LTV
                                                                                                                             impact
                                                                                              Asset Recycling/ Debt          1.0% - 2.3%
                                                                                              Repayment
                                                                                              Equity Pref notes              1.5% - 3.0%

                                                                                              Accretive asset acquisitions   0.5% - 2%

                                                                                              Valuation recovery             TBC
       HY18    FY18    HY19    FY19    HY20      FY20         HY21    Near term   Medium
                                                                        focus   term target

Ι 30
Debt Financing Update – December 2020

                                        % DEBT EXPIRY PROFILE (excl. associates)                                                                                                                                                      MULTI BANK STRATEGY
                                                                          59.4%                                                                                                                                                           1.8%
                                                                                                                                                                                                                                   4.0%           0.4%                          Standard Bank
                                                                                                                         38.6%                                                                                              4.1%
                                                                                                                                                                                                                                                                                Bank of China
                                1.1%                                                                                                                                  1.0%
                                                                                                                                                                                                                                                                                State Bank of Mauritius
                     Expiring within 1Y                      Expiring within 2Y                              Expiring within 3Y                                Expiring 3Y >                                              12.0%
                                                                                                                                                                                                                                                               41.5%            Investec

                              DEBT EXPIRY PROFILE (EXCL. ASSOCIATES) (US$m)                                                                                                                                                                                                     ABSA
                                                                                                                                                                                                                         15.6%

                                                                                                                                                                                                  141.1
                                                                                         76.4
                                                                   52.6

       Maturity settlement value                                                                                                                                                                                                                                                ABC Banking Corporation
       Capital repayments
                                                                                                                                                                                                                                                                                Maubank
                                                                                                              30.0
                                                                              27.3

                                                                                                                                                                                                                                          20.7%
Under COVID                                                                                                                                                                                                                                                                     Nedbank

                                                                                                                                              20.0
consideration

                                                                                                                                   17.1

                                                                                                                                                                    14.9

                                                                                                                                                                                                                 8.1
                                                                                                                                                                                        7.7
                                                                                                                                                                                                                                                    DEBT MATURITY

                                                                                                                                                                                                              3.9
  1.8

                                                                                                                         1.5

                                                                                                                                                                                  1.4
                                                                                                       1.4

                                                                                                                                                              1.4
                                                                                                                                                     0.8
                                                    0.7
 0.7

                        0.3

                                                             0.4
                                  0.3
                                  0.0
               0.0

                                                                                                                                                                                                                                                            2.0 years
                                                                                Mar 22
            Mar 21

                                                                     Feb 22

                                                                                           Apr 22

                                                                                                                                                                                                              Post Oct
                                                                                                                                     Sep 22
                                        Sep 21

                                                 Oct 21

                                                                                                                                                Oct 22

                                                                                                                                                                                                     Oct 23
   Jan 21

                                                          Nov 21

                                                                                                                                                           Nov 22
                     May 21

                                                                                                    May 22

                                                                                                                                                                               May 23
                                                                                                                          Aug 22
                               Jun 21

                                                                                                                Jun 22

                                                                                                                                                                                         Jun 23
                                                                                                                                                                      Dec 22

                                                                                                                                                                                                               2023
                                                                                                                                                                                                                                                         (June 20: 2.4 years)

 Debt expiry of Associates facilities within the next 24 months (not included above)
 •     Beachcomber hotels facility c.$58.3m expires in Dec 21                                                    •         Tullow Cads (ABSA) facility of $15m expires in Nov 23
 •     LLR facility of c.$19.8m expires in Mar 23                                                                •         Buffalo Mall facility of c.$4.5m expires in Sept 2031

Ι 31
Drive In Trading (DiT) Refinance Update
A new loan facility1 with the Public Investment Corporation (PIC) has been approved and proposed in principle, subject to
documentation

                                                                      PIC PROPOSED LOAN TERMS
 • Duration: 5 years (2 years with option to extend for another 3 years)

 • Interest rate: 9% per annum (from the current 5.85%)

 • Requirement for Grit to fully guarantee / remedy any shortfall in interest payment obligations

 • Guarantee agreement between Grit and the PIC to remain in place for the duration of the loan
Notes
1 By virtue of the Group’s historic listing on                                                                                 NEXT STEPS
the Johannesburg Stock Exchange, the
Company’s largest shareholder, the Public
Investment Corporation (“PIC”), facilitated       • Should the transaction be concluded, it would be subject to an independent fairness opinion and
the Group’s black economic empowerment
and transformation partner, Drive in                  consideration under Grit’s related party policy as a result of PIC’s shareholding in Grit of 25.5%
Trading (“DIT”), in the acquisition of
23.25m Grit shares in June 2017 by
providing a guarantee against their external      • The DIT guarantee contingent liability is currently accounted for under “Other Financial liabilities” at
debt facility. Separately, Grit indemnified
the PIC for up to 50% of any potential
losses suffered by PIC as a result of the
                                                      31 December 2020 at a fair value of c.US$4.1m (December 2019: US$1.1m)
guarantee, capped at US$17.5m.
Following the expiry of the loan facility, PIC has assumed the position of lender to DIT, and continues to reserve its rights under the Grit indemnity.

Ι 32
Distributable Income
                                                                   31 Dec 2020    31 Dec 2019
                                                                      US$’000        US$’000
Basic Earnings attributable to the owners of the parent                  9,706         16,874
                                                                                                                       12.07           12.19         12.20
Company specific distribution adjustments
- VAT Credits utilised on rentals                                        1,132            304
- Interest related to Anfa Place Mall areas under construction                -            53

                                                                                                 US$ cents per share
- Listing and set-up costs under Administrative expenses                   121               -
                                                                                                                                                                   9.58
- Depreciation and amortisation                                            306            259
- Share based payments                                                      64             90
- Antecedent dividend                                                         -           418                                                                       4.33
- Retirement fund & PRGF                                                    55               -
- LLR Initial day one gain                                                    -        (2,066)
                                                                                                                        5.95            6.07
- Amortisation of capital funded debt structure fees                       425               -
                                                                                                                                                      5.25          5.25
- Operating costs related to Anfa Place Mall refurbishment costs              -           271                                                                                      3.88
Total company specific distribution adjustments                          2,103          (671)
TOTAL DISTRIBUTABLE EARNINGS (BEFORE PROFITS WITHELD)                   11,809         16,203                                                                                      2.38
DISTRIBUTABLE INCOME PER SHARE (DILUTED) (cents per share)                3.88           5.48
- Profits released/(withheld)                                           (7,241)         (678)                                                                                      1.50
TOTAL DISTRIBUTABLE EARNINGS TO GRIT SHAREHOLDERS                        4,568         15,525
DIVIDEND PER SHARE (cents)                                                1.50           5.25                          FY17             FY18          FY19         FY 20           HY21

Distribution shares (‘000)                                             304,505        295,722                                  Interim dividend   Final dividend   Earnings held back

Interim distribution proposed (US$ cps)                                   1.50           5.25

Ι 33
Statement of Financial Position
                                                                                                       INCOME PRODUCING ASSETS
As at                                                31 Dec 2020   30 June 2020    Movement      31 Dec 2020   30 June 2020      Movement
                                                        (US$’m)        (US$’m)              %       (US$’m)        (US$’m)               %
Assets
Non-current assets
Investment properties                                     584.8          572.1           2.2%         584.8          572.1            2.2%
Deposits paid on investment properties                      5.1            4.5          12.2%           5.1            4.5           12.2%
Investments in associates and joint ventures              168.3          161.3           4.3%         210.5          198.9            5.9%
Other loans receivable                                     29.5           39.6        (25.4%)          29.3           29.3                -
Related Party loans receivable                              2.6            0.0      87766.7%           13.0           13.6          (4.4%)
Deferred tax                                               28.0           24.5          14.4%             -              -                -
Other non-current assets                                    5.6            6.8        (18.2%)           0.5            0.5          (0.7%)
Total non-current assets                                  823.9          808.7           1.9%         843.2          818.8            3.0%
Total current assets                                       62.1           37.0          68.0%           6.1            4.7           29.7%
Total assets                                              886.0          845.7           4.8%         849.2          823.5            3.1%
Equity and liabilities
Total equity attributable to ordinary shareholders
Ordinary share capital                                     463.8          454.1          2.1%
Treasury shares reserve                                   (18.4)         (18.4)              -
Preference share capital                                    25.5               -             -
Reserves                                                 (115.1)        (137.9)       (16.5%)
Equity attributable to owners of the Company               355.9          297.9         19.5%
Non-Controlling interests                                 (12.0)           (0.6)     1859.0%
Total equity                                               343.8          297.3         15.7%
Liabilities
Non-current liabilities
Redeemable preference shares                               12.8           12.8              -
Interest-bearing borrowings                               400.5          337.6         18.6%
Deferred tax                                               65.6           57.4         14.2%
Other non-current liabilities                              17.0           14.4         17.9%
Total non-current liabilities                             496.0          422.3         17.4%
Interest-bearing borrowings                                 7.9           55.4       (85.6%)
Other current liabilities                                  38.2           70.7       (46.0%)
Total current liabilities                                  46.2          126.1       (63.4%)
Total liabilities                                         542.2          548.4        (1.1%)
Total equity and liabilities                              886.0          845.7          4.8%

Ι 34
Statement of Comprehensive Income
 For the 6 months ended
                                                                   31 Dec 2020   31 Dec 2019   Movement
                                                                      (US$’m)       (US$’m)            %
 Gross rental income                                                      23.9          24.3      (1.6%)
 Straight-line rental income accrual                                     (0.3)         (0.2)       56.7%
 Revenue                                                                  23.6          24.1      (2.1%)
 Property operating expenses                                             (4.1)         (6.3)     (34.2%)
 Net property income                                                      19.5          17.8        9.3%
 Other income                                                              0.1           3.0     (96.9%)
 Administrative expenses (including corporate structuring costs)         (6.7)        (10.0)     (33.2%)
 Profit from operations                                                   12.9          10.7        19.7%
 Total fair value adjustment on investment properties                    (4.2)           3.0     (240.5%)
 Total other fair value adjustment on other investments                    0.8           0.2       346.3%
 Impairment / (charge) of loan / financial asset                           1.6         (1.1)     (239.3%)
 Share-based payment expense                                             (0.1)         (0.1)      (28.9%)
 Share of profits from associates and joint ventures                       1.6          12.6      (87.6%)
 Foreign currency gains                                                    1.3           0.0    16537.5%
 Profit before interest and taxation                                      13.8          25.3     (45.5%)
 Interest income                                                           1.3           2.4     (45.4%)
 Finance costs                                                          (12.5)        (12.6)      (1.1%)
 Profit for the period before taxation                                     2.6          15.1     (82.6%)
 Taxation                                                                (4.9)         (3.4)       45.2%
 Gain / (loss) on translation of functional currency                       8.6         (1.4)    (715.1%)
 Total comprehensive income                                                6.4          10.3     (38.1%)

 Loss / (Profit) attributable to:
 Owners of the parent                                                      1.7          13.1     (86.8%)
 Non-controlling interests                                               (4.0)         (1.4)     180.5%
                                                                         (2.3)          11.7    (119.5%)
 Total comprehensive income/ (loss) attributable to:                         -             -           -
 Owners of the parent                                                      8.8          11.7     (25.4%)
 Non-controlling interests                                               (2.4)         (1.4)      66.5%
                                                                           6.4          10.3     (38.1%)

Ι 35
5TH AVENUE CORPORATE OFFICES
                       GHANA

Growth, Investment &
Pipeline
Pipeline & investment considerations in light of COVID-19
                                               3. Accelerated disposals of non-core
                                               assets and other recycling initiatives

       2. Defending and strengthening                                                        4. Reassessed all target acquisitions
       Grit’s Balance Sheet key priority                                                     in light of COVID-19 impacts

           1. Grit extended target execution                                            5. Progressing accretive investments once
       dates on all announced pipeline deals                                            funding solutions are secured

Ι 37
Pipeline Transactions no longer being progressed
COVID-19 impacts have resulted in the non-closure of a number of pipeline opportunities
                                             Announced          October 2019
                                                                                      • Adjacent acquisitions were announced
         PWC                                   Location:         Accra, Ghana           prior to the onset of the COVID-19
       BUILDING                                                                         pandemic.
                                                Sector:             Office

                                                                                      • Upon further deliberation, the Group
                                             Announced          October 2019
                                                                                        has concluded that these transactions
        HUAWEI                                 Location:         Accra, Ghana           no longer make commercial sense in
       BUILDING                                                                         light of the Group’s revised Corporate
                                                Sector:             Office
                                                                                        Strategy.
                                             Announced          February 2020
                                                                                      • Light industrial, corporate
        MASSIRA                                Location:     Casablanca, Morocco        accommodation and healthcare assets
       CORNER **                                                                        will be identified and prioritized for
                                                Sector:
                                                             Mixed-Use (Hospitality     acquisition going forward.
                                                                   & Retail)

 ** Grit will still be pursuing a Moroccan REIT strategy and will be make further announcements in due course

Ι 38
Pipeline Developments being progressed
Funding either secured through asset recycling initiatives or through DFI funding

                                                                      Target
                                                                    Completion                Q3 2022                Size (GLA):               6,087m2                  Property Yield:           10.5%
   ST. HELENE                                                         Date:
     CLINIC                                                           Location:
                                                                                             Curepipe,               Transaction
                                                                                                                                              US$7.3m            Avg Annual Escalation:
                                                                                                                                                                                          European Harmonised
                                                                                             Mauritius                 Value:*                                                              CPI, min. of 2.0%
    (38.35%)
                                                                                                                                                                    Anchor Tenant lease   PDL (Artemis), 15 years;
                                                                       Sector:               Healthcare                 WALE:                  15 years
                                                                                                                                                                          terms            Triple Net, EUR-linked

                                                                   Target Closing
                                                                                              Q4 2022                Size (GLA):              10,080m2                  Property Yield:           10.5%
                                                                       Date:
 COROMANDEL
                                                                                           Coromandel,               Transaction                                                          European Harmonised
   HOSPITAL                                                           Location:
                                                                                            Mauritius                  Value:*
                                                                                                                                             US$12.2m            Avg Annual Escalation:
                                                                                                                                                                                            CPI, min. of 2.0%
   (38.35%)
                                                                                                                                                                    Anchor Tenant lease   PDL (Artemis), 15 years;
                                                                       Sector:               Healthcare                 WALE:                  15 years
                                                                                                                                                                          terms            Triple Net, EUR-linked

                                                                   Target Closing                                                         Ph 1 - 29,243m2                                     Ph 1 – 10.12%
                                                                                              Q2 2021                Size (GLA):                                        Property Yield:
                                                                       Date:                                                              Ph 2 – 14,741m2                                     Ph 2 – 9.91%
        ORBIT                                                                              Mlolongo,                 Transaction           Ph 1 - $30.8m                                       Ph 1 - 2.0%
                                                                      Location:                                                                                  Avg Annual Escalation:
        AFRICA                                                                            Nairobi, Kenya               Value:*             Ph 2 - $14.6m                                       Ph 2 – 2.0%
       (PHASE 1 & 2)                                                                                                                       Ph 1 - 25 years
                                                                                                                                                                    Anchor Tenant lease
                                                                                                                                                                                           Orbit Products Africa;
                                                                       Sector:                Industrial                WALE:               Ph 2 – c.23                                     25 years; Triple Net
                                                                                                                                                                          terms
                                                                                                                                               years                                         Lease; USD lease

*Indicative estimates only of Grit share of acquisition/development value using currently available indicative valuations and should not be relied upon as a forecast
Ι 39
Announced Redevelopments underway
Significant redevelopment activity to complement existing asset acquisitions

                                                                   Target Closing
                                                                                               Q4 2021                Size (GLA):   7,324m2        Property Yield:               8.00%
                                                                       Date:
    Bolloré
                                                                                              Pemba,                  Transaction
   Warehouse                                                          Location:
                                                                                            Mozambique                  Value:*
                                                                                                                                    US$7.6m     Avg Annual Escalation:       US CPI + 1.5%

(Redevelopment)                                                                                                                                  Anchor Tenant lease     Bollore Transport and
                                                                        Sector:            Light Industrial               WALE:     5.0 years
                                                                                                                                                       terms             Logistics, 5 years, USD

                                                                   Target Closing
                                                                                               Q4 2021                Size (GLA):   326 keys       Property Yield:               7.88%
                                                                       Date:
  Club Med Cap
                                                                                                                      Transaction
 Skirring (Phase 1                                                    Location:                Senegal
                                                                                                                        Value:*
                                                                                                                                    US$5m       Avg Annual Escalation:           1.5%
 Redevelopment)
                                                                                                                                                 Anchor Tenant lease      Club Med; 12 year;
                                                                        Sector:               Hospitality                 WALE:     12 years
                                                                                                                                                       terms                Triple Net; Euro

* Indicative estimates only using currently available indicative valuations and should not be relied upon as a forecast
Ι 40
Gateway Real Estate Africa Limited
Grit’s development associate provides a “one solution” approach to client’s real estate
needs
                                                                                                                                  GREA SHAREHOLDER STRUCTURE
                                                                                                                                 48.6%
  •    Founded and co-sponsored by Grit, GREA is a private company funded with
       US$175mln equity commitments and is staffed by an experienced team of                                                               28.5%
                                                                                                                                                     20.0%
       professionals with an established track record in African property development and                                                                      2.9%
       project delivery. GREA is designated as one of Grit’s preferred development partners
                                                                                                                                  PIC     Gateway     Grit   Prudential
  •    Through it’s 19.98% equity interest in GREA, Grit has minority exposure to the                                                     Partners

       developers assets and returns

  Updated investment and operating relationship
  •    Grit’s investment charter allows Pre-funding of outsourced and turnkey style
       developments under 2 models with GREA
                                                                                                                             •    Ethiopia
         ▪   Upfront funding and participation in development projects                                                       •    Kenya
                                                                                                                             •    Ghana
                                                                                                                             •    Mauritius
         ▪   “Buy-in option” to participate in developments under construction                                               •    Morocco
                                                                                                                             •    Mozambique
                                                                                                                             •    Uganda
  •    Upon completion Grit retains right of offer on any assets; specifically ones within its                               •    Senegal
                                                                                                                             •    Rwanda
       investment mandate can be considered for acquisition by the Group                                                     •    Nigeria
                                                                                                                             •    Mali

Ι 41
                                                  ** By virtue of PIC’s large equity holdings in both GREA and Grit, GREA is regarded as a related party
Attractive GREA pipeline and capital investments
GREA’s focus on US embassy corporate accommodation and data centre sectors aligned with Grit strategy
       No.           Project            Country                Sector              Ownership %   Project Start   Project End

                                                   Secured Projects include inter alia:

       1       DH1 (US Embassy)        Ethiopia        Diplomatic Housing             50%        Q1 2019         Q1 2021

       2           Metroplex            Uganda                Retail                 100%        Q2 2019         Q1 2021

             Rendeavour Head Office
       3                                Ghana                 Offices                100%        Q1 2021         Q1 2022
                  (Appolonia)

       5       DH3 (US Embassy)         Kenya          Diplomatic Housing             50%        Q3 2020         Q1 2022

       6            Bollore           Mozambique            Industrial                0%         Q3 2020         Q3 2021

                                                            Pipeline Projects

       1       DH4 (US Embassy)          Mali          Diplomatic Housing             tbc        Q4 2020         Q2 2022

       2       Africa Data Centres      Nigeria            Data Centre                tbc        Q4 2020         Q1 2021

Ι 42
KAFUBU MALL
                 ZAMBIA

Sustainability
Our sustainability agenda
SDG’s that are significant to our business

                                                                         Grit employs 76% of local talent
     We’ve supported the local                                                                               We have procedures in place for
                                        We ensure that all genders are    across its offices in Africa. We
   community in Mauritius during                                                                             the daily running of the business
                                         valued in the workplace and     design customized career paths,
  COVID-19 by providing protective                                                                           aiming to reduce consumption of
                                         given equal opportunities at    where our talents are uplifted to
  gear, sanitizers and food packs for                                                                         energy, water, single-use plastic
                                          every level of the business.      an international level and
   the needy during confinement.                                                                                       and recycling.
                                                                                    networking.

Ι 44
Our sustainability priorities - Ongoing efforts to reach our ESG targets
                                                           25%                                                                   25%                                                                   > 40%                                                             > 65%
     Targets                                    Reduction by 2025                                                  Improvement by 2025                                                Woman leadership positions                                                           Localised
                                             CARBON EMISSIONS                                                    BUILDING EFFICIENCY                                                    GENDER EQUALITY                                                LOCAL REPRESENTATION

                                                2019/20 Achievements                                                    2019/20 Achievements                                                   2019/20 Achievements                                               2019/20 Achievements
                                 ✓ 42% reduction in plastic usage at our                               ✓ 37.5% rate of recycling of our total                                 ✓ 42% women employed occupy                                              ✓ 78% employees are local.
                                   head office in Mauritius.                                             weekly waste at our head office in                                     managerial positions and above.
                                                                                                         Mauritius.
                                 ✓ 67% reduction in paper usage at our                                                                           ✓ 45% of overall Grit staff are women.
                                   head office in Mauritius.                                           ✓ 28% reduction in water usage across our
                                                                                                         assets in Africa1                       ✓ 33% Board members are women.

                                                                                                       ✓ 18% reduction in electricity usage across
                                                                                                         our assets in Africa1

     Ι 45
1.   Note: Data provided includes the following properties (Ghana: 5th Avenue, Capital Place) (Kenya: Buffalo Mall) (Morocco: Anfa Place) (Mozambique: Acacia Estate, Hollard/KPMG, Vodacom, Commodity House Phase 1 & Phase 2, Vale Dos Embondeiros, Mall De Tete, Zimpeto Square)
     (Zambia: Cosmopolitan Shopping Centre, Kafubu Mall, Mukuba Mall)
ESG 2020/21 focus areas

                  •   Further develop our carbon offset strategy and plan in order to reach our target of net zero carbon by 2040.
  ENVIRONMENTAL   •   Deploy our Environmental Sustainability Management and Reporting Policy across all our assets in Africa.
                  •   Develop and implement a strategy to support life on land.

                  •   Maintain our diversity, equality and inclusion target across our offices.

       SOCIAL     •   Strengthen the Performance Management with 360 feedback and introduce a calibration committee to
                      review the scoring and employee data.
                  •   Launch an Employee Program around wellbeing and work-life balance.

                  •   Enhancing Board Evaluation process.

   GOVERNANCE     •   Appointment of additional Non-Executive Independent Director(s).
                  •   Continued training with the UK code of Corporate Governance 2018 ahead of redomiciling to Guernsey and
                      Premium listing on the LSE.

Ι 46
CLUB MED CAP SKIRRING
                  SENEGAL

Closing Remarks
Dividend policy guidance
USD1.50cps interim dividend proposed, reflecting recent strong rent collection trends and the Group’s early progress
towards its near-term LTV target of 45%

                    ➢ To protect the long-term strength of the business, the Board temporarily suspended the
                      dividend in the second half of FY20 in response to the Covid-19 pandemic
   Resumption       ➢ As a result of encouraging early results of LTV reduction strategies and recent strong rent
    rationale         collections the Board has proposed a modest resumption of dividends in HY21
                    ➢ Extra-ordinarily the Board envisages recommending an additional one-off quarterly dividend
                      in 2021 dependent and measured on a pre-determined set of guiding principles

                    ➢ Further progress and confidence in LTV reduction strategies
                    ➢ Continued strong rent collections, specifically in the hospitality sector
        Guiding
       principles   ➢ Finalisation of the Drive in Trading guarantee restructure
                    ➢ Assessment of the impacts that the second wave of Covid is having on our assets, specifically
                      in the retail and hospitality sectors

Ι 48
Premium Listing & Redomiciliation to Guernsey
    Grit is a proudly African, now Premium LSE-Listed and UK-domiciled Company, headquartered in Mauritius

                                                                                   Premium Listing on LSE                                                                                                                                                                             Redomiciliation to Guernsey

                                                             Represents the highest listing standards                                                                                                                                                                                   Migration of corporate seat of listed entity
                                                               and places Grit amongst some of the                                                                                                                                                                                      (GREIG1) only; operations, staff, physical head
                                                                world’s leading companies in the UK                                                                                                                                                                                     office, tax residency and domicile of OpCo
                                                                                                                                                                                                                                                                                        (GSL2) remain in Mauritius
                                                                                                                                                                                                                                                                                                  Company’s Depositary Interest facility on the
                                        Pathway created for inclusion in the                                                                                                                                                                                                                      LSE collapsed in favour of electronic
                                     FTSE indices; potential improvement of                                                                                                                                                                                                                       settlement via CREST; Grit’s primary listing
                                               liquidity in shares (see below                                                                                                                                                                                                                     on SEM- converted to a Secondary Listing
                     Liquidity across LSE’s Main Market by market cap band                                                                                AuM of active open-ended funds benchmarked to indices                                                                             Est. tracking demand by index & min. market cap for inclusion ($m)
                                                               FTSE Constituents       Premium           Standard
                                                                                                                                                                                                          350                        AuM (LHS)         1000
                                                                                                                                                                                                                                     No. Funds (RHS)                                                  FTSE All-Share                                       57
Free float adjusted turnover ratio

                                     0.44%                                                                                                                                                                                                             900
                                                                                                                                                                                                          300

                                                                                                                                                                           Active Benchmarked AuM ($bn)
                                                                                                                                                                                                                                                       800

                                                                                                                                                                                                                                                              No. Funds Benchmarked
                                                                                                                                                                                                                                                                                                           FTSE 100                                       7,266
                                                                                                                                                                                                          250                                          700
                                                                                                                                      0.33%
                                                                                                                                                                                                          200                                          600                                                 FTSE 250                                       1,034
                                                                                                                                                                                                                                                       500
                                                                                                          0.25% 0.25% 0.25%   0.25%
                                                                                                                                                                                                          150                                          400
                                                                                   0.21% 0.21%                                                                                                                                                                                                             FTSE 350                                       1,034
                                                                                                                                                                                                          100                                          300
                                             0.16%                                               0.16%
                                                     0.15%   0.15% 0.15%
                                                                                                                                                                                                                                                       200                                                STOXX 50                                        22,864
                                                                           0.11%                                                                                                                           50
                                                                                                                                                                                                                                                       100
                                                                                                                                              0.06%
                                                                                                                                                                                                            0                                          0                                                 STOXX 600                                        1,029
                                                                                                                                                                                                                FTSE UK Series STOXX 50   STOXX 600
                                                                                                                                                                                                                                                                                                                       0%   1%   2%   3%   4%   5%   6%
                                        $0-100m                $100-500m              $500-1bn                $1-5bn             $5-10bn              Notes:
                                                                                                                                                      1. Grit Real Estate Income Group Limited – Grit’s corporate listed entity (TopCo) domiciled in Guernsey
                                                                                                                                                      2. Grit Services Limited – Grit’s operational entity (OpCo) domiciled and tax resident in Mauritius
    Ι 49
Closing Remarks

                  1         Reduced our exposure to the Retail sector

                        Strong collection rates and effective management of
                  2                           our assets

                       Refined our current investment strategy to include more
                  3          resilient, essential and high-growth sectors

                          Successful redom to Guersney & Premium Step Up
                  4                            on LSE

                      Resuming conservative dividend to protect and strengthen
                  5         the business. LTV and cash collection are key

                            Confident progress towards improved liquidity
                  6                            in 2021

Ι 50
ANFAPLACE MALL
            MOROCCO

Annexures
Shareholder Base Evolution
JSE shareholder contraction over time was the primary driver for JSE delisting and to concentrate liquidity through
fewer exchanges
                                                                                                                                 Successful JSE de-listing
            19.14

                     19.16

                              19.80

                                       21.44

                                                21.55

                                                         25.14

                                                                           27.50
                                                                  27.69

                                                                                    27.77

                                                                                             27.88

                                                                                                               27.88

                                                                                                                         27.88
                                                                                                      27.90

                                                                                                                                  30.91

                                                                                                                                           30.92

                                                                                                                                                    30.92

                                                                                                                                                             31.73

                                                                                                                                                                      31.73

                                                                                                                                                                               34.82
                                                                                                                                                                                        LSE holders have
                                                                                                                                                                                       steadily increased
                                                                                                                                                                                          since the IPO
            59.49

                     59.55

                              58.91

                                       57.42

                                                57.34
                                                                                                                                                                                         from c.12% to
                                                         54.58

                                                                           54.59
                                                                  54.59

                                                                                    54.73

                                                                                                               54.72
                                                                                             54.73

                                                                                                      54.72

                                                                                                                         55.56
                                                                                                                                                                                              c.35%

                                                                                                                                  69.09

                                                                                                                                           69.08

                                                                                                                                                    69.08

                                                                                                                                                             68.27

                                                                                                                                                                      68.27

                                                                                                                                                                               65.18
            21.36

                     21.30

                              21.29

                                       21.14

                                                21.11

                                                         20.28

                                                                           17.90
                                                                  17.72

                                                                                    17.51

                                                                                                                17.40
                                                                                             17.40

                                                                                                      17.38

                                                                                                                         16.56
           06/19    07/19    08/19    09/19    10/19    11/19    12/19    01/20    02/20    03/20    04/20    05/20     06/20    07/20    08/20    09/20    10/20    11/20    12/20

Ι 53
Corporate Awards and Accolades
Recognised for leadership, governance and compliance excellence

                                    EPRA 2020 Best Practices Recommendations Compliance
       SEP 2020
                                        Bronze Award – Grit Real Estate Income Group

                                              2020 API Top Africa Real Estate CEO
       SEP 2020
                                          of the Year Award – Bronwyn Corbett (CEO)

                                  PWC (Mauritius) Corporate Reporting Awards 2020 Winner for
       OCT 2020
                                    Corporate Governance– Grit Real Estate Income Group        (Mauritius)

       Jan 2021                    AIFA Awards Best Growing International Company –
                                            Grit Real Estate Income Group

Ι 54
Coronavirus impact on Africa
     Africa remains relatively less affected versus other territories

                                                                                                                                               Impact on Grit’s Footprint Countries*
                                                                                                                                                                                           Per 1mn
                                                                                                                                               Country                 Total cases
                                                                                                                                                                                            pop’n
                                                                                                                                                                  Grit’s footprint
                                                                                                                                                     Morocco             475,355           12,787
                                                                                                                                                     Kenya               101,819            1,869
                                                                                                                                                     Ghana                70,768            2,249
                                                                                                                                                     Zambia               62,633            3,351
                                                                                                                                                     Senegal              28,760            1,691
                                                                                                                                                     Mozambique           44,600            1,403
                                                                                                                                                     Botswana             23,503            9,875
Source: https://covid19.who.int/ - as at 09.02.2021                                                                                                  Mauritius             584              459
                                                                                                                                                                   Comparatives
                                                                                                                                               USA                     27,611,403          83,122
                                                                                                                                               France                   3,337,048          51,056
                                                                                                                                               UK                       3,945,680          57,938
                                                                                                                                               Germany                  2,291,441          27,297
                                                                                                                                               South Africa             1,476,135          24,701
                                                                                                                                              *as at 8 February 2021, per
                                                                      Source: https://news.yahoo.com/ -   Source: https://news.yahoo.com/ -   https://www.worldometers.info/coronavirus/
     Ι 55       Source: https://covid19.who.int/ - as at 09.02.2021   as at 26.01.2021                    as at 28.01.2021
Vaccine deployment in Africa

                                                                Africa                                                                                            Mauritius

                                                                                                                                        January 2021
  90
MILLION DOSES
                     February 2021
                     90 million doses ordered for African countries – this will
                     vaccinate 3% of the African population.
                                                                                                                     100k
                                                                                                                        DOSES
                                                                                                                                        100,000 doses deployed in Mauritius to front liners
                                                                                                                                        such as doctors, nurses, police, airport and customs
                                                                                                                                        staff.

 600
MILLION DOSES
                     H2 of 2021
                     To be distributed in second half of 2021 – this will vaccinate 20%
                     of the African population.
                                                                                                                     200k                March 2021
                                                                                                                                         200,000 doses arriving in March 2021
                                                                                                                         DOSES
                     2021 & 2022
 670
MILLION DOSES
                     Secured by the African Union for deployment in 2021 % 2022 –
                     this will vaccinate over 20% of the African population.                                         240k
                                                                                                                                        H1 of 2021
                                                                                                                                        T240,000 additional doses have been ordered from
                                                                                                                                        COVAX through the WHO initiative.
                                                                                                                     ADDITIONAL DOSES
                     February 2021
320kDOSES
                     Additional doses secured for South Africa, Cabo Verde, Rwanda
                     and Tunisia for deployment in February 2021.                                                    60%
                                                                                                                                         2021
                                                                                                                                         60% of the Mauritian population will be vaccinated
                                                                                                                                         before the end of 2021.
                     2021
US$20                African Export Bank to provide advance procurement
   MILLION           commitment of US$20 million for funding of vaccines.

 Ι 56
    Source:
    https://www.afro.who.int/news/covax-expects-start-sending-millions-covid-19-vaccines-africa-february
    https://www.africanews.com/2021/01/26/mauritius-begins-vaccinating-frontline-health-workers-against-covid-19//
Portfolio Key Metrics – Geographic                                                              (as at 31 December 2020)
                                                                                                                                           Botswana                      Other
% Attributable to GRIT                                Morocco     Mozambique        Ghana       Mauritius        Kenya        Zambia                       Senegal                    Total
                                                                                                                                             (LLR)5                  Investments 6

Number of Properties/Investments                          1             9             3              5             2             3             26             1           4            54

Grit attributed Asset Value 1                          93,678        313,903        47,766       171,864        27,864        85,119         27,345        23,862       10,479       801,881

Weighted Average Property Cap rate                      8.3%          8.2%           8.0%          7.5%          8.3%          8.3%          11.0%          8.3%           -          8.1%

Wale by Income % Owned                                   4.8           4.0           3.0            9.1           6.1           3.0            2.5          11.9           -           5.2
Weighted Average Lease Escalations (Income) %
                                                        3.3%          3.5%           2.2%          0.7%          4.3%          3.7%           6.7%          0.0%           -          2.9%
Owned
Grit attributed Weighted Avg US$ Rental per m2
                                                       $27.50        $24.96         $37.43        $14.34        $10.83        $12.04         $4.41          $8.18          -         $16.40
per month2
Full GLA                                               31,588        88,880         17,603       120,043        19,410        65,535        185,604        16,462          -         545,125

Grit attributed GLA                                    31,588        88,880         11,337        69,907        16,556        46,886         55,681        16,462          -         337,296

EPRA Operating Cost to Income Ratio3                   54.9%          13.7%         12.4%          0.8%          5.3%          16.4%          8.9%          0.0%           -         14.3%

EPRA Vacancies 4                                       27.3%          5.3%           7.5%          0.0%          13.4%         9.6%           5.0%          0.0%           -          8.0%

Weighted average cost of property debt (%)              7.4%          7.0%           6.1%          4.2%          5.9%          4.7%           7.0%          4.9%           -          6.0%

Debt to property value 7(%)                            51.9%          44.6%         40.9%         44.1%          38.7%         62.6%         21.7%         32.9%           -         46.5%

           1.   Value as at 31 December 2020 at Grit proportionate ownership. Portfolio value includes land values for Imperial Ph2 and Buffalo Mall Ph2.
           2.   Weighted by contractual income
           3.   Based on EPRA cost to income ratio calculation methodology
           4.   Vacancy is measured as a percentage of Total Estimated Rental Value, excludes those units under rental guarantee
           5.   LLR reflected separately to enable comparable analysis of portfolio against prior reporting period, including 4 new acquisitions during the period
           6.   Includes land owned by Grit (Imperial Ph 2) and associate properties owned by our development associate – Gateway Real Estate Africa
           7.   Excluding corporate facilities
Ι 57
Portfolio Key Metrics – Sectoral                                                        (as at 31 December 2020)

                                                          Corporate                                                                                        Other
 % Attributable to GRIT                                                   Hospitality   Light Industrial    Office          Retail          LLR                             Total
                                                       Accommodation                                                                                   Investments6

Number of Properties/Investments                              2                5               2              8               7              26              4               54

Grit attributed Asset Value 1                              138,979         181,497          30,039         203,449        210,092          27,345          10,479          801,881

Weighted Average Property Cap rate                           8.4%            7.5%            8.1%           7.9%            8.4%           11.0%              -             8.1%

Wale by Income % Owned                                       3.2              9.7             6.3            4.4             4.0             2.5              -              5.2
Weighted Average Lease Escalations (Income) %
                                                             3.4%            0.4%            3.8%           3.3%            3.5%            6.7%              -             2.9%
Owned
Grit attributed Weighted Avg US$ Rental per m2 per
                                                            $22.79          $13.39          $9.83          $31.34          $16.83          $4.41              -            $16.40
month2
Full GLA                                                    43,955         128,239          16,213         52,277         118,838         185,604             -            545,125

Grit attributed GLA                                         43,955          78,103          16,213         46,010          97,335          55,681             -            337,296

EPRA Operating Cost to Income Ratio3                        15.7%              -             4.1%           10.3%          31.7%            8.9%              -            14.3%

EPRA Vacancies 4                                              -                -               -            4.5%           22.8%            5.0%              -             8.0%

Weighted average cost of property debt (%)                   7.0%            4.2%            4.9%           6.6%            5.9%            7.0%              -             6.0%

Debt to property value 7(%)                                 32.8%           41.9%           25.7%           54.1%          55.2%           26.3%              -            46.5%

           1.   Value as at 30 Value as at 31 December 2020 at Grit proportionate ownership. Portfolio value includes land values for Imperial Ph2 and Buffalo Mall Ph2.
           2.   Weighted by contractual income
           3.   Based on EPRA cost to income ratio calculation methodology
           4.   Vacancy is measured as a percentage of Total Estimated Rental Value, excludes those units under rental guarantee
           5.   LLR reflected separately to enable comparable analysis of portfolio against prior reporting period, including 4 new acquisitions during the period
           6.   Includes land owned by Grit (Imperial Ph 2) and associate properties owned by our development associate – Gateway Real Estate Africa
           7.   Excluding corporate facilities
Ι 58
EPRA key performance metrics (as at 31 December 2020)
                                                                                                     EPRA COST RATIOS       EPRA COST RATIOS
   % Attributable to GRIT   GLA (m²)   EPRA NIY   IFRS NIY   EPRA TOPPED-UP NIY EPRA VACANCY RATE
                                                                                                    (incl. direct vacancy) (excl. direct vacancy)
       Mozambique            88,880     7.0%       7.2%            7.6%               5.3%                 14.3%                   13.7%
         Mauritius           69,907     6.4%       6.7%            6.4%               0.0%                  0.8%                   0.8%
           Kenya             16,556     7.1%       6.2%            7.1%              13.4%                  8.6%                   5.3%
           Ghana             11,337     8.1%       8.2%            8.1%               7.5%                 13.3%                   12.4%
           Zambia            46,886     6.6%       7.0%            6.6%               9.6%                 17.2%                   16.4%
          Morocco            31,588     1.6%       1.5%            5.2%              27.3%                 67.8%                   54.9%
         Botswana            55,681     8.9%       8.6%            8.9%               5.0%                  9.4%                   8.9%
          Senegal            16,462     6.6%       6.7%            6.6%                 -                     -                       -
            Total           337,296     6.3%       6.4%            7.0%               8.0%                 16.0%                   14.3%

                                                                                                     EPRA COST RATIOS       EPRA COST RATIOS
   % Attributable to GRIT   GLA (m²)   EPRA NIY   IFRS NIY   EPRA TOPPED-UP NIY EPRA VACANCY RATE
                                                                                                    (incl. direct vacancy) (excl. direct vacancy)
           Office            46,010     7.4%       7.6%            7.4%               4.5%                 10.7%                   10.3%
           Retail            97,335     4.3%       4.2%            6.0%              22.8%                 38.0%                   31.7%
       Light Industrial      16,213     6.0%       6.2%            6.0%               0.0%                  4.1%                   4.1%
Corporate Accommodation      43,955     7.3%       7.4%            8.4%               0.0%                 15.7%                   15.7%
             LLR             55,681     8.9%       8.6%            8.9%               5.0%                  9.4%                   8.9%
         Hospitality         78,103     6.4%       6.7%            6.4%                 -                     -                       -
            Total           337,296     6.3%       6.4%            7.0%               8.0%                 16.0%                   14.3%

Ι 59
Disclaimer
This report has been prepared by Grit Real Estate Income Group Limited ("Grit" or the “Company”) solely for your information and should not be considered to be an offer or solicitation of an offer to buy or sell or subscribe
for any securities, financial instruments or any rights attaching to such securities or financial instruments. In particular, this report does not constitute an offer to sell, or the solicitation of an offer to acquire or subscribe for,
securities in any jurisdiction where such offer or solicitation is unlawful.

All information and statistics provided in this presentation relating to targeted acquisitions or post-targeted acquisitions status is predicated on information available to the Company at the time of printing of this
presentation. Such information may be subject to change depending on final negotiations and documentation related to such targeted acquisition.

None of the directors, officers or employees of Grit make any representation or warranty, express or implied, as to the accuracy or completeness of the information or opinions contained in this report.

This report is a summary only and does not include all material information about Grit. This report contains certain statements which are, or may be deemed to be, 'forward-looking statements'. By their nature, these
forward-looking statements and the facts contained therein are subject to a number of known and unknown risks, uncertainties and contingencies, many of which are beyond Grit’s control or influence, and actual results
and events could differ materially from those currently being anticipated as reflected in such statements. These forward-looking statements speak only as of the date of this publication. Past performance should not be
taken as an indication or guarantee of future results and no representation or warranty, express or implied, is made regarding future performance. Except as required by any applicable law or regulation, the Company
expressly disclaims any obligation or undertaking to release publicly any updates or revisions to any forward-looking statements contained in this publication to reflect any change in Grit's expectations or any change in
events, conditions or circumstances on which any such statement is based. Accordingly, undue reliance should not be placed on any such forward-looking statements.

Forward-looking statements have not been reviewed by external auditors and are the responsibility of the Board of Directors of the Company.

All targets mentioned in this presentation are targets only and are not guaranteed. These targets are based on a number of bases and assumptions. which may or may not materialize and have not been assessed or validated
by the auditors. Nothing in this presentation should be construed as a profit forecast.
Thank You
               Grit Real Estate Income Group
                                             Reg. No. C128881
3rd floor, La Croisette Shopping Centre, Grand Baie 30517, Mauritius
      Level 5, Alexander House, 35 Cybercity Ebene 72201, Mauritius

                                              T +230 269 7090
                                               E ir@grit.group
You can also read