ILUKA RESOURCES LIMITED - for the half-year 30 June 2021
←
→
Page content transcription
If your browser does not render page correctly, please read the page content below
ILUKA RESOURCES LIMITED
ABN 34 008 675 018

INTERIM REPORT
for the half-year 30 June 2021
ILUKA RESOURCES LIMITED
ABN 34 008 675 018
Interim Report for the half-year 30 June 2021

CONTENTS

                                                               Page

Results for announcement to the market                            1
Review of results and operations                                  2
Governance                                                       13
Financial statements
    Condensed consolidated statement of profit or loss           16
    Condensed consolidated statement of comprehensive income     17
    Condensed consolidated balance sheet                         18
    Condensed consolidated statement of changes in equity        19
    Condensed consolidated statement of cash flows               20
    Notes to the condensed consolidated financial statements     21
Directors' declaration                                           37
Independent auditor's review report to the members               38
RESULTS FOR ANNOUNCEMENT TO THE MARKET
Provided below are the results for announcement to the market in accordance with Australian Securities
Exchange (ASX) Listing Rule 4.2A and Appendix 4D for the Consolidated Entity comprising Iluka Resources
Limited (Iluka) and its controlled entities for the half year ended 30 June 2021 (the current period) compared with
the half year ended 30 June 2020 (the previous corresponding period).
This report should be read in conjunction with the Annual Report for the year ended 31 December 2020, and
public announcements made by Iluka during the half year ended 30 June 2021 in accordance with the continuous
disclosure requirements of the Corporations Act 2001 and the ASX Listing Rules.
Iluka demerged its royalty business in November 2020 to create Australia's largest ASX-listed royalty company,
Deterra Royalties (Deterra). Deterra is described as a discontinued operation in this interim report.
All currencies shown in this report are Australian dollars unless otherwise indicated.
Revenue from ordinary activities Up 62.3% to $765.0m
Net profit after tax for the period from ordinary activities - continuing operations Up 61.7% to $129.0m
Net profit after tax for the period attributable to equity holders of the parent Up 14.0% to $129.0m
Dividends
2021 interim: 12 cents per ordinary share (100% franked), to be paid in October 2021
2020 final: 2 cents per ordinary share (100% franked), paid in April 2021
2020 interim: nil
Demerger dividend: $1,808.1 million, distributed in November 2020
1st Half 1st Half
Key ratios 2021 2020
Basic profit per share (cents) - continuing operations 30.6 18.9
Diluted profit per share (cents) - continuing operations 30.3 18.8
1
Free cash flow per share (cents) 42.4 10.9
Net tangible assets per share ($) 2.22 1.82
1
Free cash flow is determined as cash flow before refinance costs, proceeds/repayment of borrowings and dividends paid in
the year.
Dividend Reinvestment Plan (DRP)
The current Dividend Reinvestment Plan (DRP) was approved by the Board of Directors, effective for all dividends
from the 2017 final dividend onwards. Under the plan, eligible shareholders can reinvest either all or part of their
dividend payments into additional fully paid Iluka shares. The DRP remains active for the 2021 interim dividend.
The Directors have determined that no discount will apply for the DRP in respect of the 2021 interim dividend.
Shares allocated to shareholders under the DRP for the 2021 interim dividend will be allocated at an amount
equal to the average of the daily volume weighted average market price of ordinary shares of the Company
traded on the ASX over the period of 10 trading days commencing on 13 September 2021. The last date for
receipt of election notices for the DRP is 9 September 2021.
Independent auditor's review report
The Condensed Consolidated Financial Statements upon which this Appendix 4D is based have been reviewed.
Iluka Resources Limited 1 30 June 2021REVIEW OF RESULTS AND OPERATIONS
Review of Results
Net profit after tax of $129.0 million
Underlying mineral sands EBITDA of $299.2 million
Free cash flow of $179.3 million, bringing net cash to $220.1 million
Revenue
Mineral sands revenue increased by 61% to $735.6 million in the first half of 2021 as zircon/rutile/synthetic rutile
(Z/R/SR) sales volumes increased 89% from the previous corresponding period to 458 thousand tonnes. Zircon
sales volumes in the first half of 2021 reflected Chinese tile manufacturers returning to pre-pandemic production
levels. Sales of high-grade titanium dioxide feedstock (rutile and synthetic rutile) increased 72% to 280 thousand
tonnes on improved market conditions, with synthetic rutile sales of 191 thousand tonnes up 116% as already
strong demand was amplified by increased concern around the future supply of high-grade feedstocks and the
settlement of the contractual dispute with major synthetic rutile customer, Chemours.
Iluka’s weighted average zircon premium and standard price received in the first half of 2021 was US$1,321 per
tonne and rutile price was up 2% from the second half of 2020 to US$1,224 per tonne. Synthetic rutile sales are, in
large part, underpinned by commercial off-take arrangements and the terms of these arrangements are
commercial in confidence and as such cannot be disclosed.
1st Half 1st Half
Sales (kt) 2021 2020 % change
Zircon 177.2 78.4 126.0
Rutile 89.0 74.7 19.1
Synthetic rutile 191.4 88.5 116.3
Total Z/R/SR sales 457.6 241.6 89.4
Ilmenite 130.4 107.1 21.8
Monazite concentrate 20.7 10.0 107.0
Total sales volumes 608.7 358.7 74.6
.
Z/R/SR revenue ($m) 680.0 408.1 66.6
Ilmenite and other revenue ($m) 55.6 48.5 14.6
Total mineral sands revenue1 ($m) 735.6 456.6 61.1
Revenue per tonne of Z/R/SR sold2($/t) 1,486 1,689 (12.0)
1 Mineral sands revenue includes revenue derived from other materials not included in production volumes, including monazite concentrate,
activated carbon products and iron concentrate.
2 Calculated as revenue from the sale of zircon, rutile and synthetic rutile (Z/R/SR) products divided by Z/R/SR sales volumes.
Earnings
Iluka recorded a profit after tax for the half-year ended 30 June 2021 of $129.0 million (2020: $113.2 million) as
markets recovered from the impacts of COVID-19 pandemic on the broader economy. Prices have returned to pre-
pandemic levels and sales volumes rebounded strongly, though profit was impacted by the appreciation of the
AUD:USD foreign exchange rate as foreign exchange markets stabilised, which unfavourably impacts mainly USD
denominated revenue.
Owing to improved business conditions, Iluka’s underlying mineral sands EBITDA increased 69% to $299.2 million.
Group underlying EBITDA increased 37% to $308.2 million, with the lower percentage increase the result of a
significantly reduced earnings contribution from the Mining Area C royalty. Iluka demerged its royalty business in
November 2020 and retains a 20% stake in Deterra Royalties. First half cash production costs decreased by $39.8
million to $253.4 million due to lower production as the Synthetic Rutile Kiln 2 (SR2) was idled for two months to
manage synthetic rutile stock levels, Cataby heavy mineral concentrate (HMC) production was impacted by
Tropical Cyclone Seroja and lower grades in line with the mine plan sequence, and lower run time and feed rates
at Sierra Rutile.
Iluka Resources Limited 2 30 June 2021Earnings per share for the period were 30.5 cents compared to an earnings per share of 26.8 cents in the previous
corresponding period.
Income statement analysis
1st Half 1st Half
$ million 2021 2020 % change
Z/R/SR revenue 680.0 408.1 66.6
Ilmenite and other revenue 55.6 48.5 14.6
Mineral sands revenue 735.6 456.6 61.1
Cash costs of production (242.0) (283.0) 14.5
Ilmenite and by-product costs (11.4) (10.2) (11.8)
Inventory movement - cash costs of production (89.5) 98.1 n/a
Restructure and idle capacity charges (17.4) (8.2) (112.2)
Government royalties (17.0) (9.5) (78.9)
Marketing and selling costs1 (14.9) (15.7) 5.1
Asset sales and other income 0.3 6.5 (95.4)
Major projects, exploration, and innovation (17.0) (31.2) 45.5
Corporate and other costs (30.8) (29.3) (5.5)
Foreign exchange 3.3 3.0 10.0
Underlying mineral sands EBITDA2 299.2 177.1 68.9
EBITDA from discontinued operations - 48.0 n/a
Share of profit of associate - Deterra 9.0 - n/a
Underlying Group EBITDA 308.2 225.1 36.9
Depreciation and amortisation (76.7) (74.7) (2.7)
Inventory movement - non-cash production costs (17.0) 24.5 n/a
Rehabilitation costs for closed sites (0.4) (0.4) -
Impairment of exploration assets (6.2) - n/a
Group EBIT 207.9 174.5 19.1
Net interest and bank charges (2.6) (4.0) 35.0
Rehabilitation unwind and other finance costs (5.3) (7.3) 27.4
Profit before tax 200.0 163.2 22.5
Tax expense (71.0) (50.0) (42.0)
Profit for the period (NPAT) 129.0 113.2 14.0
Average AUD/USD rate for the period (cents) 77.2 65.8 17.3
1 Freight revenue and expenses are included as a net number in marketing and selling costs.
2Underlying Group EBITDA excludes non-recurring adjustments including impairments and changes to rehabilitation provisions for closed sites,
which are non-cash in nature.
Iluka Resources Limited 3 30 June 2021Movement in NPAT
The key drivers for the movement in NPAT from the 2020 half-year were:
significantly higher Z/R/SR sales volumes at 458 thousand tonnes (2020: 242 thousand tonnes), driven mainly
by strong demand for zircon and synthetic rutile;
the average Australian dollar exchange rate remained volatile from the 2020 half-year as it appreciated against
the US dollar following COVID-19 lows, ending at 77 cents achieved on sales, compared to 65 cents in the
previous corresponding period;
lower unit COGS of $915 per tonne in the first half of 2021 (2020: $961 per tonne) due to a combination of
factors including change in sales mix as the proportion of zircon sales grew and reduced Sierra Rutile sales
dropping the average cost of goods sold in favour of lower-cost Australian product;
idle costs increased with the idling of SR2 kiln through February and March to manage synthetic rutile stock
levels;
operating spend on major projects decreased due to the exclusion of the Balranald underground mining trials,
which concluded in 2020;
Iluka demerged its royalty business in November 2020 to create the ASX’s largest resources royalty company,
Deterra Royalties Limited. Iluka retained a 20% stake in Deterra. Iluka’s earnings contribution from Deterra no
longer reflects the cash generated from that asset, with $3.2 million of depreciation charges in H1 2021;
increase in tax expense for the half-year 2021 as net profit before tax improved with higher sales volumes and
improving business conditions.
Iluka Resources Limited 4 30 June 2021Cash flow and balance sheet
Operating cash flow for the 2021 half-year was $306.4 million (2020: $96.7 million) reflecting higher receipts from
customers as sales volumes increased dramatically from the prior comparative period and drew down on inventory
built up in 2020.
Capital expenditure was $16.7 million (2020: $49.6 million) as spend focused on Eneabba Phase 2. Other spend in
the first half reflected development work for the Cataby southern area expansion and sustaining capital spend at
Australian operations. Sustaining capital and Sembehun study costs at Sierra Rutile were reduced and formed part
of operating cash flows.
Tax payments represent both income tax payments in Australia and Sierra Leone. Tax instalments in Australia have
been based on the instalment rate provided by the Australian Tax Office (ATO). A final 2019 tax instalment of $99
million was deferred to September 2020 in the previous half, while strong sales in the second half of 2020 and first
half of 2021 resulted in higher tax instalments in the year-to-date. Sierra Rutile Limited’s annual Sierra Leone
income tax payments are the greater of 3.5% of revenue or 30% of profit, based on the Sierra Rutile Act.
Iluka accessed the Australian Government JobKeeper payment in 2020, recording a grant of $13.9 million.
Subsequent to improved performance in the second half of 2020, Iluka voluntarily elected to return the JobKeeper
grant and repaid the amount in the current period.
Drawings under the Multi Option Facility Agreement (MOFA), which comprises a series of five-year committed
unsecured bilateral revolving credit facilities, at 30 June 2021 were $53.2 million (31 December 2020: $38.0
million).
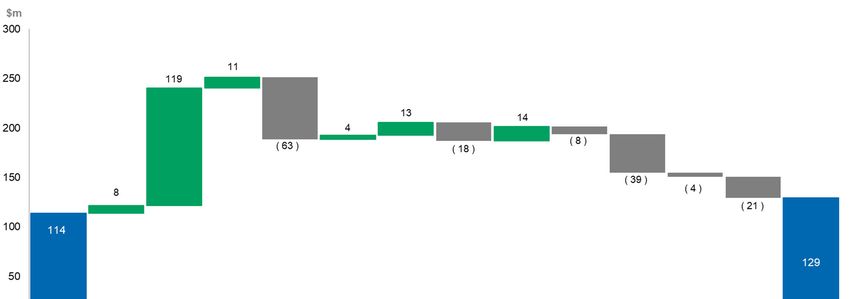
Net cash increased to $220.1 million from $50.2 million at 31 December 2020.
Movement in net debt ($million)
1st Half 2nd Half 1st Half
2020 2020 2021
Opening net cash (debt) 43.3 62.1 50.2
Operating cash flow 96.7 86.0 306.4
Discontinued operations 41.6 50.6 -
Exploration (5.5) (4.5) (3.8)
Interest (net) (1.) (1.5) (0.8)
Tax (39.4) (125.3) (84.7)
Capital expenditure (49.6) (21.6) (16.7)
Dividends received - Deterra - - 2.6
Government grants 4.3 9.6 (13.9)
Principal element of lease payments AASB 16 (4.8) (4.5) (3.8)
Asset sales 3.9 1.2 0.1
Share purchases - - (6.3)
Free cash flow 46.2 (10.0) 179.3
Dividends (32.6) - (7.9)
Net cash flow 13.6 (10.0) 171.4
Exchange revaluation of USD net debt 5.5 (1.6) (1.2)
Amortisation of deferred borrowing costs (0.3) (0.3) (0.3)
Increase in net cash/(debt) 18.8 (11.9) 169.9
Closing net cash/(debt) 62.1 50.2 220.1
Iluka Resources Limited 5 30 June 2021Production
1st Half 1st Half
Production (kt) 2021 2020 % change
Zircon 141.9 92.2 53.9
Rutile 79.9 84.0 (4.9)
Synthetic rutile 78.9 111.6 (29.3)
Total Z/R/SR production 300.7 287.8 4.5
Ilmenite 235.3 215.4 9.2
Monazite concentrate 26.2 9.7 170.1
Total Mineral Sands Production 562.2 512.9 9.6
.
HMC produced 501 601 (16.7)
HMC processed 562 520 8.2
.
Cash costs of production, excluding ilmenite and by-products ($m) 242.0 283.0 14.5
Unit cash cost per tonne of Z/R/SR produced excluding by-products1 ($/t) 805 983 18.1
Unit cost of goods sold per tonne of Z/R/SR sold ($/t) 915 961 4.8
1 Unit
cash cost per tonne of Z/R/SR produced is determined as cash costs of production less the cost of ilmenite and by-products, divided by total
Z/R/SR production volumes.
Australian Operations
Mining at Jacinth-Ambrosia in South Australia produced 129 thousand tonnes of heavy mineral concentrate (HMC),
down from 184 thousand tonnes in the prior comparative period. The lower HMC production was the result of
reduced ore grades as mining at the lower grade part of the Jacinth North deposit continues over the next 12
months.
In Western Australia, the Cataby operation produced 108 thousand tonnes of HMC, down from 234 thousand
tonnes in the previous half. Reduced HMC production was a result of lower runtime due to the impact of lower ore
grades in line with the mining sequence and the impact of Tropical Cyclone Seroja.
The Narngulu mineral separation plant (MSP) operated at full capacity and processed 232 thousand tonnes of
HMC, up from 148 thousand tonnes in the first half of 2020. The plant processed both Cataby and Jacinth-
Ambrosia material to produce a total of 142 thousand tonnes of zircon and 24 thousand tonnes of rutile.
Production of synthetic rutile from SR2 at Capel was 79 thousand tonnes, down from 112 thousand tonnes in the
previous half, with SR2 returning to full production on 1 April following the planned suspension in February and
March.
Eneabba Phase 1 produced 26 thousand tonnes of monazite-zircon concentrate, in line with planned shipment
requirements and the offtake agreement in place to underpin this initial phase of rare earths operations.
Sierra Leone Operations
HMC production was 138 thousand tonnes, compared to production of 153 thousand tonnes in the first half of
2020. Lower production was a result of lower run time and feed rates.
Rutile production was 56 thousand tonnes, compared to 62 thousand tonnes as maintenance issues and COVID-
19 continued to impact productivity.
In May, Iluka provided the Government of Sierra Leone six months’ notice of its intention to temporarily suspend
operations at Sierra Rutile towards the end of 2021. The company is currently exploring ways to reset the cost base
of these operations and attract new investors to pursue the Sembehun development.
Iluka Resources Limited 6 30 June 2021Jacinth-Ambrosia/Mid West
1st Half 1st Half
2021 2020 % change
Production volumes
Zircon kt 131.0 68.8 90.4
Rutile kt 16.8 10.4 61.5
Total Z/R production kt 147.8 79.2 86.6
Ilmenite kt 65.2 41.1 58.6
Monazite concentrate kt 26.2 9.7 170.1
Total production volume kt 239.2 130.0 84
HMC produced kt 129 184 (29.9)
HMC processed kt 232 148 57.0
Unit cash cost of production - Z/R/SR 1 $/t 516 944 (45.3)
Mineral sands revenue $m 287.8 143.2 101.0
Cash cost of production $m (76.2) (74.8) (1.9)
Inventory movements - cash costs of production $m (19.7) 39.0 n/a
Restructure and idle capacity charges $m (1.2) (1.4) 14.3
Government royalties $m (8.9) (2.8) (217.9)
Marketing and selling costs 2 $m (6.3) (2.8) (125.0)
EBITDA $m 175.5 100.4 74.8
Depreciation and amortisation $m (22.1) (17.5) (26.3)
Inventory movement - non-cash production costs $m 2.5 9.7 (74.2)
EBIT $m 155.9 92.6 68.4
1 Calculated as cash costs of production, including by-product costs divided by Z/R/SR production.
2 Freight revenue and expenses are included as a net number in marketing and selling costs.
Production of zircon and rutile increased 87% from the previous corresponding period as the Narngulu mineral
separation plant returned to standard production settings following changes made in April 2020 to reduce zircon
production during the market uncertainty of COVID-19 in early 2020.
Mineral sands revenue increased 101% to $287.8 million (2020: $143.2 million) as sales rebounded from 2020 and
stockpiled products were sold.
Cash costs of production were 2% higher than the previous corresponding period as the Narngulu plant ramped
up, offset slightly by lower mining costs at Jacinth-Ambrosia on lower HMC production.
The inventory movement reflects the drawdown of finished goods stocks, with finished goods inventory decreasing
by $53.3 million to $68.0 million at 30 June 2021.
Depreciation and amortisation charges have increased 26% from the previous corresponding period due mainly to
the completion of Ambrosia capital works that commenced depreciation part way through half-year 2020.
Government royalties rose to $8.9 million as HMC haulage volumes increased while drawing down inventory at
Jacinth-Ambrosia, with the royalty being charged when HMC leaves the mine gate, regardless of sale.
Iluka Resources Limited 7 30 June 2021Cataby/South West
1st Half 1st Half
2021 2020 % change
Production volumes
Zircon kt 10.9 23.4 (53.4)
Rutile kt 7.6 11.8 (35.6)
Synthetic rutile kt 78.9 111.6 (29.3)
Total Z/R/SR production kt 97.4 146.8 (33.7)
Ilmenite kt 149.9 150.4 (0.3)
Total production volume kt 247.3 297.2 (16.8)
HMC produced kt 234 264 (11.4)
HMC processed kt 182 219 (16.9)
Unit cash cost of production - Z/R/SR 1 $/t 913 817 11.8
Mineral sands revenue $m 347.8 188.6 84.4
Cash cost of production $m (88.9) (120.0) 25.9
Inventory movements - cash costs of production $m (70.9) 43.0 n/a
Restructure and idle capacity charges $m (6.2) (0.8) (675.0)
Government royalties $m (4.3) (2.3) (87.0)
Marketing and selling costs 2 $m (2.4) (6.1) 60.7
Asset sales and other income $m 0.2 0.6 (66.7)
EBITDA $m 175.3 103.0 70.2
Depreciation and amortisation $m (39.4) (35.8) (10.1)
Inventory movement - non-cash production costs $m (19.4) 11.0 n/a
Rehabilitation costs for closed sites $m (0.3) (0.3) -
EBIT $m 116.2 77.9 49.2
1 Calculated as cash costs of production, including by-product costs divided by Z/R/SR production.
2 Freight revenue and expenses are included as a net number in marketing and selling costs.
Total Z/R/SR production dropped by 34% from the previous corresponding period predominantly due to reduced
synthetic rutile production at SR2 kiln in Capel due to the planned idling for two months in the first half to help
reduce inventories following the contractual dispute with a major customer in 2020.
Mineral sands revenue increased 84% from the previous corresponding period to $347.8 million (2020: $188.6
million) reflecting higher synthetic rutile sales volumes and the settlement of the Chemours take-or-pay contract
dispute.
Cash costs of production were $31.1 million lower than the previous corresponding period, again reflecting the
reduced production at Cataby and the idling of SR2, which is also seen in the increased idle capacity expenses in
the first half of 2021.
The inventory drawdown reflects the resumption of customers taking contracted volumes.
Iluka Resources Limited 8 30 June 2021Sierra Rutile Operations
1st Half 1st Half
2021 2020 % change
Production volumes
Zircon kt - - n/a
Rutile kt 55.5 61.8 (10.2)
Ilmenite kt 20.2 23.9 (15.5)
Total production volume kt 75.7 85.7 (11.7)
HMC produced kt 138 153 (9.9)
HMC processed kt 148 153 (3.3)
Unit cash cost of production - Z/R $/t 1,495 1,511 (1.0)
Mineral sands revenue $m 88.3 107.1 (17.6)
Cash cost of production $m (83.0) (93.4) 11.1
Inventory movements - cash costs of production $m 1.3 17.8 (92.7)
Restructure, idle capacity and other non-production costs $m (6.5) (1.3) (400.0)
Government royalties $m (3.4) (4.2) 19
Marketing and selling costs 1 $m (1.2) (1.5) 20
Asset sales, write downs and other income $m - (1.7) n/a
EBITDA $m (4.5) 22.8 n/a
Depreciation & amortisation $m (13.4) (19.3) 30.6
Inventory movement – non-cash costs of production $m 0.3 4.5 (93.3)
EBIT $m (17.6) 8.0 n/a
1 Freight revenue and expenses are included as a net number in marketing and selling costs.
Sierra Rutile’s total Z/R production was 12% lower than the previous corresponding period due to ongoing
operational challenges and the impact of the COVID-19 pandemic.
Mineral sands revenue was $88.3 million, an 18% decrease from the previous corresponding period, due to lower
ilmenite sales volumes.
Sierra Rutile’s cash production costs increased US$2.6 million due to higher maintenance and consumables costs.
As their costs are translated to group currency for reporting, foreign currency exchange volatility since 2020
resulted in a A$10.4 million decrease.
Higher non-production costs reflect costs associated with COVID-19 pandemic medical support and Sembehun
project study costs, including the hydro mining trial, which were all expensed.
In May, Iluka provided the Government of Sierra Leone six months’ notice of its intention to temporarily suspend
operations at Sierra Rutile towards the end of 2021. The company is currently exploring ways to reset the cost base
of these operations and attract new investors to pursue the Sembehun development.
Iluka Resources Limited 9 30 June 2021Marketing
Zircon
Demand for zircon was strong through the half year. Zircon sales were 177 thousand tonnes, including zircon in
concentrate (ZIC).
Chinese tile production returned to pre-pandemic levels, despite significant financial pressure caused by increased
raw material costs and challenges associated with increasing tile prices to real estate developers.
India's second wave of COVID-19 cases has stalled plans of ceramic tile makers as they look to commence
production at several newly constructed plants. Tile production lines in Spain, Italy, Brazil, and Turkey are reported
to be operating at 90% capacity.
Chinese fused zirconia producers continue to report favourable market conditions, with demand for refractory from
domestic glass producers responding to strong growth in the photovoltaic industry. Exports of refractory materials
with alumina-zirconia-silica remain subdued. In the United States, fused zirconia producers are running at full
capacity.
The weighted average zircon price achieved in the first half of 2021 for premium and standard sand was US$1,321
per tonne, following a US$70 per tonne price increase effective 1 April. The company announced a minimum price
increase of US$125 per tonne effective 1 July.
Titanium Dioxide Feedstocks
Demand from the titanium dioxide market was robust, with numerous requests received for additional volumes of
high-grade feedstock. Sales of rutile and synthetic rutile were 280 thousand tonnes in the first half of 2021, up 72%
compared to the prior period.
Chlorine supply in the US was constrained following outages from the winter storm season, along with spring
flooding and planned permanent shutdowns of sub-economic capacity by certain producers. As a result, pigment
producers have sought ways to boost head grades in order to minimise chlorine consumption and maximise
throughput. The pull forward of volume in H1 reduced available inventory.
The announcement of the potential suspension of operations at Sierra Rutile, coupled with violence at a major
feedstock producer in South Africa, has created additional concern around future supply of feedstocks heading
into the second half and beyond. As a result, pigment producers are seeking additional volumes ahead of any
potential disruptions to supply.
The welding market continues to perform well, with demand outstripping supply of feedstocks. Iluka announced a
9% price increase in this market for Q3 and is allocating volumes to welding customers.
With inventory normalised, Iluka’s sales of high-grade feedstocks will likely be production constrained in H2 2021.
Iluka and Chemours have settled the previously disclosed contractual dispute. The terms are commercial in
confidence but include Chemours taking all of the synthetic rutile not taken in 2020.
1st Half 2020 2nd Half 2020 1st Half 2021
Weighted Average Received Prices (US$/t FOB)
Zircon Premium and Standard 1,354 1,301 1,321
Zircon
1,265 1,194 1,254
(all products including zircon-in-concentrate)1
Rutile
1,246 1,197 1,224
(excluding HyTi)2
Synthetic rutile Refer Note 3
1 Zircon prices reflect the weighted average price for zircon premium, zircon standard and zircon-in-concentrate. The prices for each product vary
considerably, as does the mix of such products sold period to period. In the first half of 2021 the split of zircon sand and concentrate by zircon
sand-equivalent was approximately: 85%:15% (2020 full year: 78%:22%).
2Included in rutile sales volumes reported elsewhere in this Report is a lower titanium dioxide product, HyTi that typically has a titanium dioxide
content of 70 to 90%. This product sells at a lower price than rutile, which typically has a titanium dioxide content of 95%.
3 Iluka’s synthetic rutile sales are underpinned by commercial offtake arrangements. The terms of these arrangements, including the pricing
arrangements are commercial in confidence and as such not disclosed by Iluka. Synthetic rutile, due to its lower titanium dioxide content than rutile,
is priced lower than natural rutile.
Iluka Resources Limited 10 30 June 2021Capital and major projects Eneabba, Western Australia The Eneabba project in Western Australia involves the reclaiming, processing, and sale of a strategic stockpile rich in monazite (a mineral containing rare earth elements) and zircon. Eneabba is currently the highest-grade rare earths operation globally. Phase 1 of operations is producing a mixed monazite-zircon concentrate, with the monazite fraction at approximately 20%. Phase 2 of the project is currently in execute. Once commissioned, this will see the production of two separate concentrates: a dedicated monazite concentrate at approximately 90%, suitable as a direct feed to a downstream rare earths refinery; and a zircon-ilmenite concentrate, which will be processed into finished products (zircon and ilmenite) at Narngulu. Site works have commenced and the upgraded high voltage infrastructure has been commissioned. Fabrication of third-party vendor packages continues off-site. Completion remains on-track for the first half of 2022. The feasibility study for Phase 3 at Eneabba, a fully integrated rare earths refinery, is progressing. In May, Iluka received a letter of support from the Australian Government setting out the alignment of Iluka’s development plans and the Government’s policy objectives regarding critical minerals and modern manufacturing (disclosed to market). Engagement with Commonwealth and State governments is ongoing. Balranald, New South Wales Balranald and Nepean are two rutile-rich deposits in the northern Murray Basin, New South Wales. Owing to their relative depth, Iluka is assessing the potential to develop these deposits via a novel, internally developed, underground mining technology. Iluka completed the third trial (T3) of the underground mining method late in 2020. The trial confirmed the effectiveness of the underground mining method and validated key elements of the mining unit design. With confidence growing in the application of the underground mining technology, Iluka has been focused on scoping the development pathway for Balranald. Wimmera, Victoria The Wimmera project involves the mining and beneficiation of a fine grained heavy mineral sands ore body in the Victorian Murray Basin for the potential long-term supply of zircon and rare earths. One characteristic shared by the fine-grained mineral sands deposits located in Western Victoria (those held by Iluka and other project proponents) is higher levels of impurities in their zircon. Absent a processing solution to remove these impurities, the zircon is ineligible for sale into the ceramics market. The study work for Wimmera is focussed on validating Iluka’s zircon processing solution and on progressing baseline environmental studies. The rare-earth bearing minerals within the Wimmera deposit are very similar to the stockpiled minerals at Eneabba; and could supplement feed to Iluka’s potential downstream refining activities at Eneabba in future years. Results from Iluka’s testing of a novel zircon processing solution continue to be pleasing. Equipment to pilot this solution on a larger scale is expected to be commissioned in the second half of 2021. The processing of Wimmera’s rare earth minerals through a potential Eneabba refinery would serve to simplify the Wimmera development. Sembehun mine, Sierra Leone The Sembehun group of deposits are situated 20 to 30 kilometres north-west of the existing Sierra Rutile operations. Sembehun is one of the largest and highest quality known rutile deposits in the world. Iluka is focused on determining an approach which balances the risk and reward associated with the development of Sembehun and has commenced a process to identify third parties willing to invest in the next phase of Sierra Rutile’s growth. The hydraulic mining trial at site has been completed and assessment of the trial data is now underway. Iluka Resources Limited 11 30 June 2021
Reconciliation of non-IFRS financial information
A reconciliation of the statutory results to the segment and commentary presented in this 4D for the half-year
ended 30 June 2021 is presented below:

                                                                                                 Expl &       Mineral
                                            JA/MW          C/SW        US/MB1         SRL                                   Corp        Group
                                                                                                  Oth         Sands
Mineral sands revenue                           287.8        347.8         11.7         88.3             -      735.6               -      735.6
AASB 15 freight revenue                          15.8           7.5         2.5          3.4             -        29.2              -       29.2
Expenses                                      (128.1)      (180.0)       (11.6)       (96.2)       (22.2)       438.1               -    (438.1)
Share of profits in associate                        -             -           -            -            -            -          9.0          9.0
FX                                                   -             -           -            -            -            -          3.3          3.3
Corporate costs                                      -             -           -            -            -            -      (30.8)       (30.8)
EBITDA                                         175.5        175.3           2.6        (4.5)       (22.2)       326.7        (49.5)       277.2
Depn & Amort                                   (22.1)       (39.4)        (0.2)       (13.4)         (0.1)      (75.2)         (1.5)      (76.7)
Inventory movement - non-cash                     2.5       (19.4)        (0.4)          0.3                    (17.0)              -     (17.0)
Rehabilitation for closed sites                      -        (0.3)       (0.1)             -             -      (0.4)              -       (0.4)
Impairment of exploration
                                                      -            -            -            -       (6.2)        (6.2)             -       (6.2)
assets
EBIT                                            155.9       116.2            1.9      (17.6)       (28.5)        227.9       (20.0)       207.9
Net interest costs                               (0.1)       (0.2)              -       (0.1)           -         (0.4)        (2.2)       (2.6)
Rehab unwind and other finance
                                                 (1.5)        (1.6)        (0.8)        (1.4)             -       (5.3)             -       (5.3)
costs
Profit Before tax                               154.3       114.4            1.1      (19.1)       (28.5)        222.2       (22.2)       200.0

Segment result                                  154.3       114.4            1.1      (19.1)           n/a       250.7           n/a      250.7
1 Includes discontinued operations in the Murray Basin and the United States. Revenue is derived from the depletion of zircon, rutile and ilmenite

stockpiles.

Iluka Resources Limited                                                 12                                                        30 June 2021
GOVERNANCE The Directors of Iluka Resources Limited present their report together with the financial statements of the Group for the half-year ended 30 June 2021 and the auditor’s review report thereon. Board of Directors G Martin (Chairman) T O’Leary (Managing Director and CEO) M Bastos R Cole S Corlett J Ranck (retired 29 April 2021) L Saint A Sutton (appointed 11 March 2021) Principal activities The principal activities and operations of the Group during the financial year were the exploration, project development, mining operations, processing and marketing of mineral sands, and rehabilitation. Iluka has an emerging position in rare earths elements, which are contained in the mineral sands monazite and xenotime. Iluka holds a 20% stake in Deterra Royalties Limited (Deterra), the largest ASX-listed resources focused royalty company. Review of results and operations The Review of Results and Operations is set out on pages 2 to 12, and forms part of the Directors’ Report. Dividends The Board of Directors have determined a fully franked interim dividend of 12 cents per share, payable on 6 October 2021 with a record date of 8 September 2021. Auditor’s independence declaration A copy of the auditor’s independence declaration as required under section 307C of the Corporations Act 2001 is set out on page 14. Rounding of amounts The Company is of a kind referred to in ASIC Corporations Instrument 2016/191 (Rounding in Financial/Directors' Reports). Amounts in the financial statements and Directors' Report have been rounded off in accordance with that Rounding Instrument to the nearest million dollars to one decimal place, or in certain cases, to the nearest dollar. All amounts are in Australian dollars, unless otherwise stated. This report is made in accordance with a resolution of the Directors. G Martin T O’Leary Chairman Managing Director and CEO Perth, 25 August 2021 Iluka Resources Limited 13 30 June 2021
Auditor’s Independence Declaration
As lead auditor for the review of Iluka Resources Limited for the half-year ended 30 June 2021, I
declare that to the best of my knowledge and belief, there have been:

(a) no contraventions of the auditor independence requirements of the Corporations Act 2001 in
    relation to the review, and
(b) no contraventions of any applicable code of professional conduct in relation to the review.
This declaration is in respect of Iluka Resources Limited and the entities it controlled during the period.

Helen Bathurst                                                                                    Perth
Partner                                                                                  25 August 2021
PricewaterhouseCoopers

 PricewaterhouseCoopers, ABN 52 780 433 757
 Brookfield Place, 125 St Georges Terrace, PERTH WA 6000, GPO Box D198, PERTH WA 6840
 T: +61 8 9238 3000, F: +61 8 9238 3999, www.pwc.com.au

 Liability limited by a scheme approved under Professional Standards Legislation.

                                                     14
ILUKA RESOURCES LIMITED ABN 34 008 675 018 FINANCIAL INFORMATION for the half-year ended 30 June 2021
CONDENSED CONSOLIDATED STATEMENT OF PROFIT OR
LOSS
For the half-year ended 30 June 2021

                                                                                                        Half-year                Half-year
                                                                                                            2021                     2020
                                                                                           Notes              $m                       $m

CONTINUING OPERATIONS
Revenue                                                                                     3              765.0                   471.4

Other income                                                                                                 3.8                     9.7
Expenses                                                                                     4            (569.6)                 (354.1)
Equity accounted share of profit - Deterra                                                  11               9.0                        -
[]                                                                                                                  (0.1)                   0.1

Interest and finance charges                                                                                 (2.9)                  (4.3)
Rehabilitation and mine closure provision discount unwind
HY21CR
                                                                                                             (5.3)      0.1
                                                                                                                                    (7.3)      -

Total finance costs                                                                                          (8.2)                 (11.6)

Profit before income tax                                                                                   200.0                   115.4

Income tax expense                                                                           5             (71.0)                   (35.7)
-
HY21CR
                                                                                                                       -
                                                                                                                        0.1                    -
                                                                                                                                            (0.1)
HY20 DR

Profit after income tax for the half-year from continuing operations                                       129.0                    79.7

DISCONTINUED OPERATIONS

Profit after tax from discontinued operations                                               11                  -                   33.5

Profit for the half-year, attributable to:                                                                 129.0                   113.2
   Equity holders of Iluka Resources Limited                                                               131.5                   113.2
   Non-controlling interest                                                                                  (2.5)                      -

                                                                                                            Cents                   Cents

Earnings per share from continuing operations attributable to the ordinary
equity holders of the parent
Basic earnings per share                                                                                     30.6                   18.9
Diluted earnings per share                                                                                   30.3                   18.8
-
Earnings per share attributable to the ordinary equity holders of the parent
Basic earnings per share                                                                                     30.6                   26.8
Diluted earnings per share                                                                                   30.3                   26.7

          The above condensed consolidated statement of profit or loss should be read in conjunction with the accompanying notes.

Iluka Resources Limited                                             16                                                        30 June 2021
CONDENSED CONSOLIDATED STATEMENT OF
COMPREHENSIVE INCOME
For the half-year ended 30 June 2021
Half-year Half-year
2021 2020
Notes $m $m
Profit for the half-year 129.0 113.2
OTHER COMPREHENSIVE INCOME
Items that may be reclassified subsequently to profit or loss
Currency translation of foreign operations (3.0) (2.0)
Hedge of net investment in foreign operation, net of tax 6 - 0.4
Movements in foreign exchange cash flow hedges, net of tax 6 (1.1) (2.5)
Items that will not be reclassified to profit or loss
Actuarial gains (losses) on defined benefit plans, net of tax - 0.1
Total other comprehensive income (loss) for the half-year, net of tax (4.1) (4.0)
Total comprehensive income for the half-year attributable to: 124.9 109.2
Equity holders of Iluka Resources Limited 127.4 109.2
Non-controlling interest (2.5) -
-
Total comprehensive income for the half-year attributable to the equity
holders of the parent arises from:
Continuing operations 127.4 75.8
Discontinued operations - 33.4
The above condensed consolidated statement of comprehensive income should be read in conjunction with the accompanying
notes.
Iluka Resources Limited 17 30 June 2021CONDENSED CONSOLIDATED BALANCE SHEET
As at 30 June 2021
30 June 31 December
2021 2020
Notes $m $m
ASSETS
Current assets
Cash and cash equivalents 272.6 87.1
Receivables 180.5 95.5
Inventories 476.0 504.1
Derivative financial instruments 6 0.1 1.9
Total current assets 929.2 688.6
Non-current assets
Investments accounted for using the equity method 11 458.5 452.1
Derivative financial instruments 0.3 0.6
Property, plant and equipment 1,007.7 1,066.8
Deferred tax assets 32.6 28.4
Inventories 36.0 112.0
Right of use assets
HY21DR
11.5 0.1
15.4 -
Total non-current assets 1,546.6 1,675.3
- -
Total assets 2,475.8 2,363.9
LIABILITIES
Current liabilities
Payables 154.5 129.4
Current tax payable 18.1 29.3
Provisions 98.6 95.0
Lease liabilities 5.5 7.5
Total current liabilities 276.7 261.2
Non-current liabilities
Interest-bearing liabilities 7 52.5 36.9
Provisions 717.6 750.5
Financial liabilities at fair value through profit or loss 7.3 7.2
Lease liabilities
HY21DR
13.6 (0.1)
15.8 -
Total non-current liabilities 791.0 810.4
Total liabilities 1,067.7 1,071.6
- -
0.1 -
Net assets 1,408.1 1,292.3
EQUITY
Contributed equity 8 1,148.8 1,150.5
Reserves 34.1 37.1
Retained earnings 227.3 104.3
Non-controlling interests (2.1) 0.4
Total equity 1,408.1 1,292.3
The above condensed consolidated balance sheet should be read in conjunction with the accompanying notes.
Iluka Resources Limited 18 30 June 2021CONDENSED CONSOLIDATED STATEMENT OF CHANGES IN
EQUITY
For the half-year ended 30 June 2021
Attributable to owners of
Iluka Resources Limited
Share Other Retained Total
capital reserves earnings Total equity
Notes $m $m $m $m NCI¹ $m
Balance at 1 January 2020 1,157.6 24.0 (472.0) 709.6 2.0 711.6
Profit for the period - - 113.2 113.2 - 113.2
Other comprehensive income - (4.0) - (4.0) - (4.0)
Total comprehensive income for the
half-year - (4.0) 113.2 109.2 - 109.2
Transfer of asset revaluation reserve - (0.7) 0.7 - - -
Transactions with owners in their capacity as owners:
Transactions with owners in their capacity as owners:
Transfer of shares to employees, net of tax 1.7 (1.7) - - - -
Share-based payments, net of tax - 0.7 - 0.7 - 0.7
Dividends paid 9 1.2 - (33.8) (32.6) - (32.6)
2.9 (1.0) (33.8) (31.9) - (31.9)
Balance at 30 June 2020 1,160.5 18.3 (391.9) 786.9 2.0 788.9
Attributable to owners of
Iluka Resources Limited
Share Other Retained Total
capital reserves earnings Total NCI¹ equity
Notes $m $m $m $m $m $m
Balance at 1 January 2021 1,150.5 37.1 104.3 1,291.9 0.4 1,292.3
Profit for the period - - 131.5 131.5 (2.5) 129.0
Other comprehensive income - (4.1) - (4.1) - (4.1)
Total comprehensive income for the
half-year - (4.1) 131.5 127.4 (2.5) 124.9
Transfer of asset revaluation reserve - (0.1) 0.1 - - -
space
Transactions with owners in their capacity as owners:
Transfer of shares to employees, net of tax 2.8 (2.8) - - - -
Purchase of treasury shares, net of tax (5.2) - - (5.2) - (5.2)
Share-based payments, net of tax - 4.0 - 4.0 - 4.0
Dividends paid 9 0.7 - (8.6) (7.9) - (7.9)
(1.7) 1.2 (8.6) (9.1) - (9.1)
Balance at 30 June 2021 1,148.8 34.1 227.3 1,410.2 (2.1) 1,408.1
¹Non-controlling interest
The above condensed consolidated statement of changes in equity should be read in conjunction with the accompanying notes.
Iluka Resources Limited 19 30 June 2021CONDENSED CONSOLIDATED STATEMENT OF CASH FLOWS
For the half-year 30 June 2021
30 June 30 June
2021 2020
Notes $m $m
Cash flows from operating activities
Receipts from customers 676.7 534.7
Payments to suppliers and employees (384.1) (433.7)
Operating cash flow 292.6 101.0
.
Interest received 0.3 0.5
Interest paid (1.1) (1.5)
Income taxes paid (84.7) (39.4)
Exploration expenditure (3.8) (5.5)
Mining Area C royalty receipts - discontinued operation 11 - 41.6
Net cash inflow from operating activities 12 203.3 96.7
Cash flows from investing activities
Payments for property, plant and equipment (16.7) (49.6)
Sale of property, plant and equipment 0.1 3.9
Dividends received - Deterra 2.6 -
Net cash (outflow) from investing activities (14.0) (45.7)
Cash flows from financing activities
Repayment of borrowings (64.6) (158.8)
Proceeds from borrowings 78.2 198.9
Purchase of treasury shares (6.5) -
Principal element of lease payments (3.8) (4.8)
Dividends paid 9 (7.9) (32.6)
Net cash (outflow) inflow from financing activities (4.6) 2.7
Net increase in cash and cash equivalents 184.7 53.7
.
Cash and cash equivalents at 1 January 87.1 97.3
Effects of exchange rate changes on cash and cash equivalents 0.8 (0.7)
Cash and cash equivalents at end of half-year 272.6 150.3
The above condensed consolidated statement of cash flows should be read in conjunction with the accompanying notes.
Iluka Resources Limited 20 30 June 2021NOTES TO THE CONDENSED CONSOLIDATED FINANCIAL STATEMENTS For the half-year ended 30 June 2021 1 BASIS OF PREPARATION This general purpose financial report for the interim half-year reporting period ended 30 June 2021 has been prepared in accordance with Accounting Standard AASB 134 Interim Financial Reporting and the Corporations Act 2001. This interim financial report does not include all the notes of the type normally included in an annual financial report. Accordingly, this report is to be read in conjunction with the Annual Report for the year ended 31 December 2020 and any public announcements made by Iluka Resources Limited during the interim reporting period in accordance with the continuous disclosure requirements of the Corporations Act 2001 and ASX Listing Rules. (a) Accounting policies The accounting policies adopted and applied by the Group are consistent with those of the previous financial year and corresponding interim reporting period. New and amended standards adopted by the Group in the current reporting period had no material impact. Where applicable, certain comparatives have been adjusted to conform with current year presentation. Government grants The Group received $13.6 million under the Australian Government's Jobkeeper Payment scheme in the prior reporting period ended 31 December 2020. The scheme was a response by the Australian Government to assist businesses impacted by the economic effects of the COVID-19 pandemic. It subsidised employee costs of eligible nominated employees, provided the employer met certain eligibility criteria and elected to participate in the scheme. Iluka was eligible following a significant decline in zircon demand and associated revenue in Q1 2020 and it accordingly elected to participate in the scheme. Subsequently, Iluka voluntarily decided to return amounts received in light of financial performance for the remainder of 2020. No amount was included in the income statement for the year ended 31 December 2020, and a payable of $13.6 million was reflected in the balance sheet as at that date. The full amount was repaid in the current reporting period. (b) Critical accounting estimates and judgements Estimates and underlying assumptions are reviewed on an ongoing basis, with revisions recognised in the period in which the estimates are revised and future periods affected. (i) Impairment of assets Assets are assessed for the presence of impairment indicators whenever events or changes in circumstances suggest that their carrying amounts may not be recoverable. For the purposes of impairment indicator assessments (and, if required, impairment testing) operating assets are grouped at the lowest levels for which there are separately identifiable cash flows (Cash Generating Units - CGUs). If an impairment indicator is found to be present for a CGU, then the Group estimates its recoverable amount and compares it to its carrying amount. If necessary, an impairment charge is recognised for the amount by which the asset’s carrying amount exceeds its recoverable amount. Iluka Resources Limited 21 30 June 2021
NOTES TO THE CONDENSED CONSOLIDATED FINANCIAL
STATEMENTS
For the half-year ended 30 June 2021

1 BASIS OF PREPARATION (CONTINUED)

The Group assessed all CGUs for the presence of impairment indicators at the reporting date, including those
which may have arisen due to the global economic impact of the ongoing COVID-19 pandemic.

Impairment indicators were found to be present in the SRL CGU, largely due to current poor operational
performance. Impairment indicators were also found to be present in respect of an exploration asset following a
decision by the Group to cease related exploration activities and expiration of applicable exploration licences.

Accordingly, the Group performed impairment tests on the SRL CGU and the exploration asset. The SRL CGU's
recoverable amount exceeds its carrying amount and therefore does not require an impairment writedown. The
Group also determined an exploration asset exceeded its recoverable amount in the period and recognised a
write-down of $6.2 million (see note 4(e)).

The Group did not note any conditions that suggest previously recognised impairments can be reversed.
Key estimate: recoverable amount of SRL
Determining the recoverable amount of SRL involves estimates that require significant judgement subject to risk
and uncertainty that may be beyond the control of the Group (including political risk, climate change risk, and
other global uncertainty risks, like the impacts of the COVID-19 pandemic). Given the nature of the Group’s
mining activities, changes in assumptions may give rise to material adjustments which could lead to recognition
of new impairment charges in the future or the reversal of impairment charges already recognised.
SRL’s recoverable amount is estimated with reference to the following key considerations, amongst others:
•   Indicative fair value observations from market data, or from transactions involving entities with similar
    characteristics, operations and size to those of the CGU on terms similar to those that would apply to the
    Group, together with resultant costs to complete a transfer, and
•   the estimated future cash flows in the absence of quoted market prices, which incorporate estimates of:
  •    quantities of mineral reserves and ore resources for which there is a high degree of confidence of
       economic extraction and the timing of access to these reserves and ore resources;
  •    future production levels, sales, cash costs of production, sustaining capital expenditure, and
       rehabilitation and mine closure; and
  •    future product prices based on the Group’s assessment of short and long-term prices for each of the key
-
-
       products.
         -
         -
-        -
-        -

Iluka Resources Limited                               22                                           30 June 2021
NOTES TO THE CONDENSED CONSOLIDATED FINANCIAL STATEMENTS For the half-year ended 30 June 2021 1 BASIS OF PREPARATION (CONTINUED) (ii) Rehabilitation and mine closure provisions These provisions represent the discounted value of the present obligation to restore, dismantle and rehabilitate certain items of property, plant and equipment. The discounted value reflects a combination of management’s assessment of the nature and extent of the work required, the future cost of performing the work required, the timing of the cash flows and the discount rate. Changes to one or more of these assumptions is likely to result in a change to the provision and the related asset (for open sites), or a charge to profit or loss (for closed sites) in accordance with the Group's accounting policy. Key estimate: discount rate for rehabilitation and mine closure provisions Australian rehabilitation and mine closure provisions have been calculated by discounting risk adjusted cash flows at a risk-free discount rate, being 1.3% (2020: 1.3%). Rehabilitation and mine closure provisions in the US and Sierra Rutile are similarly calculated by discounting risk adjusted cash flows at risk-free discount rates, being 0.5% and 1.0%, respectively. The risk free discount rate used in calculating the US and Sierra Leone rehabilitation provisions was reduced from 2.5% at the end of 2020. An increase of 1% to each of the above discount rates (in the absence of any changes to inflation assumptions) would result in a $63.3 million decrease to the provision, of which $23.5 million would be credited to profit or loss for closed sites. (iii) Net realisable value and classification of inventory The Group’s assessment of the net realisable value and classification of its inventory holdings requires the use of estimates, including the estimation of the relevant future product price and the likely timing of the sale of the inventory. Total inventory at 30 June 2021 was $512.0 million (31 December 2020: $616.1 million). Inventory write-downs of $11.3 million occurred for work in progress or finished goods during the period (30 June 2020: $0.1 million). Inventory of $36.0 million (31 December 2020: $112.0 million), comprised of work in progress, is classified as non-current as it is not expected to be sold within 12 months of the balance sheet date. Iluka Resources Limited 23 30 June 2021
NOTES TO THE CONDENSED CONSOLIDATED FINANCIAL
STATEMENTS
For the half-year ended 30 June 2021

2 SEGMENT INFORMATION
(a) Description of segments
The Group has identified its operating segments based on the internal reports that are reviewed and used by the
executive management team (the chief operating decision-makers) in assessing performance and in determining
the allocation of resources. The operating segments of the Group are:
Jacinth-Ambrosia/Mid West (JA/MW) comprises the mining operations at Jacinth-Ambrosia located in South
Australia, and associated processing operations at the Narngulu mineral separation plant in mid-west Western
Australia.
Cataby/South West (C/SW) comprises mining activities at Cataby and processing of ilmenite at Synthetic Rutile
Kiln 2, both located in Western Australia.
Sierra Rutile (SRL) comprises the integrated mineral sands mining and processing operations in Sierra Leone.
Mining Area C (MAC) comprised a deferred consideration iron ore royalty interest over certain mining tenements
in Australia operated by BHP, which was demerged from the Group as outlined in note 23 of the 2020 Annual
Report. The results of the MAC operating segment have been reclassified in the prior reporting period as a
discontinued operation (refer to note 11).
United States/Murray Basin (US/MB) comprises rehabilitation obligations in the United States (Florida and
Virginia), where mining and processing activities were substantially completed in December 2015, although sale
of remnant product remains an activity; and certain idle assets located in Australia (Murray Basin).
Cash, debt and tax balances are managed at a group level, together with exploration and other corporate
activities, and are not allocated to segments.
Where finished product capable of sale to a third party is transferred between operating segments, the transfers
are made at arm’s length prices. Any transfers of intermediate products between operating segments are made
at cost. No such transfers took place between segments during the half-year ended 30 June 2021 (2020: $nil).

Iluka Resources Limited                               24                                           30 June 2021
NOTES TO THE CONDENSED CONSOLIDATED FINANCIAL
STATEMENTS
For the half-year ended 30 June 2021

2 SEGMENT INFORMATION (CONTINUED)

(b) Segment information
Half-year 2021                                    JA/MW        C/SW       SRL    MAC¹   US/MB       Total
                                                     $m          $m        $m     $m       $m        $m

Total segment sales of mineral sands               287.8      347.8      88.3       -     11.7     735.6
Total segment freight revenue                       15.8        7.5       3.4       -      2.5      29.2
Total segment result                               154.3      114.4     (19.1)      -      1.1     250.7
Segment assets at 30 June 2021                     593.2      818.2     128.9       -    135.9   1,676.2
Segment liabilities at 30 June 2021                265.0      297.7     142.7       -    236.1     941.5

Half-year 2020                                      JA/MW        C/SW     SRL    MAC¹   US/MB       Total
                                                       $m          $m      $m     $m       $m        $m

Total segment sales of mineral sands                 143.2      188.6   107.1       -     17.7     456.6
Total segment freight revenue                          7.2        3.0     2.5       -      1.7      14.4
Total segment result                                  90.6       76.2     6.5       -      4.1     177.4
Segment assets at 31 December 2020                   606.4      763.1   196.8       -    144.9   1,711.2
Segment liabilities at 31 December 2020              231.3      240.0   171.4       -    297.7     940.4

¹MAC operating segment results have been reclassified as a discontinued operation in the consolidated
statement of profit or loss in the prior reporting period. Refer to note 11.

Segment result is reconciled to profit before income tax as follows:

                                                                                  Half-year      Half-year
                                                                                      2021           2020
                                                                                        $m             $m

Segment result                                                                      250.7          177.4
Interest income                                                                       0.2            0.4
Other income                                                                            -            5.8
Marketing and selling                                                                (5.2)          (5.7)
Corporate and other costs                                                           (30.9)         (29.3)
Depreciation                                                                         (1.6)          (1.7)
Major projects, innovation and exploration                                          (17.0)         (31.2)
Interest and finance charges                                                         (2.5)          (3.3)
Net foreign exchange gain/(loss)                                                      3.5            3.0
Equity accounted profit - Deterra                                                     9.0               -
Impairment - exploration asset                                                       (6.2)              -
Profit before income tax from continuing operations                                 200.0          115.4

Iluka Resources Limited                                 25                                    30 June 2021
NOTES TO THE CONDENSED CONSOLIDATED FINANCIAL
STATEMENTS
For the half-year ended 30 June 2021
3 REVENUE
Half-year Half-year
2021 2020
$m $m
CONTINUING OPERATIONS
Sales revenue
Sale of goods 735.6 456.6
Freight revenue 29.2 14.4
Other revenue
Interest 0.2 0.4
765.0 471.4
(a) Sale of mineral sands
The Group earns revenue by mining, processing, and subsequently selling mineral sands (including zircon, rutile,
synthetic rutile, ilmenite and monazite) by export to customers based in the Americas, Europe, China, the rest of
Asia, and other countries under a range of commercial terms.
Revenue from the sale of product is recognised when control has been transferred to the customer, generally
being when the product has been dispatched and is no longer under the physical control of the Group. In cases
where control of product is transferred to the customer before dispatch takes place, revenue is recognised when
the customer has formally acknowledged their legal ownership of the product, which includes all inherent risks
concomitant with control of the product. In these cases, product is clearly identified and immediately available to
the customer.
Sales to customers are generally denominated in US Dollars, which are translated into the functional currency of
the Group using the spot exchange rate applicable on the transaction date. The effect of variable consideration
arising from rebates, discounts and other similar arrangements with customers is included in revenue to the
extent that it is highly probable that there will be no significant reversal of the cumulative amount of revenue
recognised when any pricing uncertainty is resolved. Revenue is recognised net of duties and other taxes.
A receivable is recognised at the earlier of dispatch or formal acknowledgement of legal ownership by a
customer, as this is the point in time that the consideration is unconditional because only the passage of time is
required before payment is due.
The Group does not expect to have any contracts where the period between the transfer of the promised goods
or services to the customer and payment by the customer exceeds one year. Accordingly, the group does not
adjust transaction prices for the time value of money.
Iluka Resources Limited 26 30 June 2021NOTES TO THE CONDENSED CONSOLIDATED FINANCIAL STATEMENTS For the half-year ended 30 June 2021 3 REVENUE (CONTINUED) (b) Freight revenue The Group also earns revenue from freighting its products to customers in accordance with the incoterms in each particular sales contract. Freight revenue is recognised to the extent that the freight service has been delivered, specifically with reference to the proportion of completed freight distance to total freight distance, which is determined by the Group at each reporting date. Freight revenue is allocated from the overall contract price at its standalone selling price (where observable) or otherwise at its estimated cost plus margin. (c) Interest income Interest income is recognised in profit or loss as it accrues, using the effective interest method. (d) Mining Area C royalty income and amortisation of royalty asset - discontinued operation Iluka held a royalty over BHP’s Mining Area C (MAC) iron ore mine, which it demerged on 2 November 2020. Amounts previously recognised as revenue have been reclassified to discontinued operations - refer to note 11. Iluka Resources Limited 27 30 June 2021
You can also read