IMPACT OF COVID-19 ON SHARED MOBILITY: A STUDY OF BANGALORE, INDIA - WIT Press
←
→
Page content transcription
If your browser does not render page correctly, please read the page content below
Urban and Maritime Transport XXVII   131

         IMPACT OF COVID-19 ON SHARED MOBILITY:
              A STUDY OF BANGALORE, INDIA
                                                 GARGI GHOSH
                                                 Sky Group, India

                                               ABSTRACT
Shared mobility has been documented as one of the most common urban transport services and one of
the fastest growing service markets of recent times. In India, the shared mobility market was poised to
grow at a CAGR of 13.7% in the period 2019–2025 with a fleet size of two million units in 2019.
However, the global pandemic has had an extraordinary impact on the shared mobility space. Bangalore
is one of the most prominent metropolises of Asia. The city is India’s Silicon Valley, and attracts people
from all across the country. Planning for mobility is an important aspect of a growing metropolis, and
Bangalore appears to be an excellent area for exploratory research. This study presents the challenges
and opportunities presented by the COVID-19 on shared mobility in Bangalore. The World Health
Organization (WHO) has recognised the novel coronavirus thereafter called COVID-19, as the greatest
pandemic in a century. The global pandemic has impacted human activity in unprecedented ways.
Working situations have changed globally with a significant segment of workers moving to remote
working situations. Schools, colleges and other educations institutions have fast adapted to the online
mode. Leisure trips have taken a back seat. In light of these significant changes in lifestyle several
research works in the field of urban transportation highlight the changing travel pattern and preferences
of the urban users. The study presents the user perceptions towards shared mobility modes and changed
travel patterns in Bangalore in the wake of COVID-19 through a user survey. The study includes a
documentation of the government issued COVID related standard operating procedures (SOPs), altered
travel patterns, perceived and real barriers to travel and the attitude of users to shared mobility.
Keywords: COVID-19, user perception, shared mobility, bike share, rideshare, car share, ride
splitting, ride sourcing, Bangalore.

                                     1 INTRODUCTION
Shared mobility has been documented as one of the most common urban transport services
and one of the fastest growing service markets of recent times. In India, the shared mobility
market was poised to grow at a CAGR of 13.7% over the 2019–2025 period [1]. Studies in
conducted pre COVID-19 outbreak have shown that shared mobility services form a
significant mobility mode in India used by user groups of cross cutting economic, social and
age groups [2]. It has also been established that shared mobility services in the form of bike
share, ride-share, ride-hailing and ride-splitting form a significant part of commuting and
leisure trips.
    The SARS-CoV-2, commonly known as COVID-19 emerged as a global pandemic in the
year 2020. The virus affected 10.9 million people in India with 0.15 million deaths [3]. In
Bangalore 0.4 million cases were registered until February 2021 with a mortality rate of 1.1%
[4]. COVID cases started emerging in India in late February 2020. In response to the rising
cases the Government of India ordered a nation-wide lockdown on March 24th 2020 for an
initial period of 21 days which was later extended till May 31st 2020. The lifting of the curfew
and measures termed as ‘Unlock 1.0’ came with strict protocols for travel, gathering and
business hours. The peak active cases in India appeared in September 2020 [5] where after
there was a steady decline in active cases, new cases as well as deaths related to COVID-19.
    There was a startling shift in economic activities and business processes in the wake of
the pandemic. Businesses, education and major lifestyle-based ac moved to an online mode.

     WIT Transactions on The Built Environment, Vol 204, © 2021 WIT Press
     www.witpress.com, ISSN 1743-3509 (on-line)
     doi:10.2495/UT210111
132 Urban and Maritime Transport XXVII
Public transportation (including metro rail, intercity railway, bus service) were either shut or
reduced service frequency to reduce the transmission rates and shopping moved to a largely
online/home delivery platform.
These changing dynamics have added new dimensions to mode choice and travel patterns.
There is significant ongoing and published research on the impact of COVID-19 on mobility
globally, however research data and results on COVID-19 impact on shared mobility is
limited. There have been some research findings in the Indian context as well on the altered
mobility patterns post COVID. However, there is no data on COVID impacted scenario
focusing on shared mobility in Bangalore. Recognition of these changes is important to
understand the long-term impact of COVID-19 on shared mobility service market. This paper
intends to bridge the gap by presenting survey results focusing around impact of COVID-19
outbreak user perception towards shared mobility and changed travel patterns in Bangalore
city.
2 LITERATURE REVIEW
Shared mobility can be defined in terms of the vehicle-type, usage types, business model or
technology. Shared mobility is an “umbrella” term that refers a broad array of innovative
transportation modes with different use cases, business models, and travel behaviour impacts
[6]. The market for personal mobility is being changed quickly due to structural modifications
[7] of the social and cultural trends, as well as technological advances such as smartphones,
Internet of Things (IoT), Big Data, Cloud Computing, information processing, and
widespread data connectivity. Shared mobility is an innovative transportation concept, which
can be considered as a set of disruptive mobility services [8] enabling urban trip planning,
booking, real-time information, and fare payment into a single-user interface.
The literature review captures the pre-COVID trends of shared mobility market and the
impact of COVID-19 related guidelines on shared mobility in the global context. Availability
of research data on mobility and shared mobility in the Indian context has also been presented
along with research techniques used for studying the impact of COVID-19 on transportation
and mobility services.
2.1 Impact of COVID-19 on mobility
The COVID-19 brought about a fundamental change in the business processes in the
economy. Spurred by the lockdown regulations major economic sectors like banking,
financial sector, IT and ITES services, retail, education, healthcare have moved to a remote
working mode. The uncertainty related the changing landscape of guidelines, procedures and
unpredictability of the disease itself has forced businesses and decisions makers to a faster
adoption of digital technology in business processes and a transformation of the business
models [9]. The impact of the COVID-19 pandemic hence is expected to have far reaching
effects on the economy that would last beyond the predicable lifecycle of the pandemic.
Behavioural response to the COVID-19 is also expected to bring about some natural changes
in travel behaviour. Study of these changes in travel pattern and mode choice is important in
transportation planning.
Studies on preliminary changes mobility pattern due to COVID-19 has been conducted
in various countries. Road traffic during the pandemic fell to 1955 levels in the UK [10] and
many countries saw spectacular drop in public transport ridership. It has been found that
social distancing is likely to lead to a reduced travel demand and reduced usage of public
transportation [11]. Survey conducted in Australia indicated that there was a fall in the total
trips and an increase in trips using private modes. The same study reflected the user
WIT Transactions on The Built Environment, Vol 204, © 2021 WIT Press
www.witpress.com, ISSN 1743-3509 (on-line)Urban and Maritime Transport XXVII 133
perception of private modes being safer than public modes like buses and trains [12]. Similar
surveys in UK, Budapest, Chicago exhibited a pattern of public transportation modes being
perceived unsafe due to potential risk of exposure to coronavirus and private modes such as
bikes, cars being perceived as safe [13], [14].
There has been some research in the Indian scenario as well focusing on mobility in the
post COVID era. A user survey carried out in New Delhi showed that there is a significant
shift of choice from public modes to private modes [15]. The same study indicated that the
shift is likely to be a long-term trend. Results in the study also indicated towards a shift of
business processes to an online mode as well as increased anxiety caused by the COVID-19
and its various implications on the travel patterns of the respondents. There is also published
research for mathematical modelling of the impact of COVID-19 on travel patterns in India
[16]. The results of the study indicate a significant inertia to maintain the pre-COVID travel
pattern as well as a high propensity to of changed business processes (e.g. work from home,
online shopping, etc.) and shift towards private modes.
2.2 Impact of COVID-19 on shared mobility
Shared mobility has been established as having the maximum disruptive potential over urban
transportation system [17]. It is also established that short term access to shared vehicles
instead of using owned vehicles offer a possibility of vast change in the urban transportation
market [18]. This phenomenon is due to changing demographics and cultural shifts, new
social attitudes and advancement of internet and mobile phone technology. The global market
for shared modes of transportation is expected to grow from US$ 1.1 billion in 2015 to US$
6.5 billion by 2024 [19]. However, these predictions are from the pre-COVID era and trends
are expected to change significantly.
Studies on shared mobility in the post COVID scenario are limited. An expert’s opinion
study believes that COVID-19 affects the overall sustainability of the shared mobility market.
The demographics using the shared mobility market is vulnerable to perceiving the shared
modes as unsafe due to a lack of trust on co-passengers, drivers and the service. The study
also reveals that the public trust should be bolstered by implementing social distancing and
COVID protection norms [20]. Data on usage of public bike riding system from Thessaloniki,
Greece revealed higher attraction of shared bikes during the pandemic [21].
2.3 Impact of COVID-19 guidelines in Bangalore
The COVID-19 was an unprecedented event in recent history. In cue with several other
COVID-19 impacted countries, the Government of India imposed strict curfew measures to
restrict the spread of the disease. The curfew regulations or ‘lockdown for containment of
COVID-19 epidemic’ as it was termed by the Government of India was announced on March
25th 2020 for a period of 21 days which was further increased in phases till May 3rd 2020
and finally till May 31st 2020. The guidelines instructed closure of offices of Government of
India, offices of the States, commercial and private establishments, industrial establishments,
transport services, hotels and hospitality, educational institutions and all social and gatherings
[22]. These guidelines were slightly relaxed starting from June 1st 2020 with private offices;
commercial establishments were allowed to operate with operating protocols of social
distancing and reduced working hours. The normalcy was restored in a phased manner over
a period of 8 months till February 2021. COVID-19 vaccination was launched country wide
on 26th January 2021 staring with front line workers and progressing for other age groups.
WIT Transactions on The Built Environment, Vol 204, © 2021 WIT Press
www.witpress.com, ISSN 1743-3509 (on-line)134 Urban and Maritime Transport XXVII
Data analysed from Google mobility reports reflected a 40% reduction in traffic to work
places and 36% reduction to retail and entertainment in Bangalore [23]. Bangalore being the
‘Silicon Valley of the East’ is home to the largest cluster of IT and ITES companies in India.
Market data indicators from the pre-COVID scenario reflected shared mobility to be a
popular mode of transport in the city The Bangalore shared mobility market is represented
by service providers from ride sourcing (use of online platforms to connect passengers with
drivers and automate reservations, payments, and customer feedback), ride-sharing (adding
passengers to a private trip in which driver and passengers share a destination), ride splitting
(a type of ride sourcing that allows customers requesting a ride for one or two passengers to
be paired in real time with others traveling along a similar route), and bike sharing (short-
term bike rental) [24] categories. There are about 12 major service providers in the shared
mobility market. A user survey showed Ola, Uber and Bounce to occupy major share. Cars,
motorbikes and auto-rickshaws comprise the major vehicular modes in the shared mobility
market. It is also noted that these services were used by users across social, economic and
age groups for trips of essential and non-essential nature all across the city [25].
There is no data on user perception on shared mobility in the context of COVID-19 for
Bangalore. This paper intends to bridge the gap by presenting survey results focusing around
impact of COVID-19 outbreak user perception towards shared mobility and changed travel
patterns in Bangalore city.
3 METHODOLOGY
3.1 Study area
Bangalore is one of the prominent metropolises in India and well as Asia. Its population of
8.6 million is representative of the major cities in Asia like Bangkok (8.2 million), Seoul (9.9
million), Lahore (10 million) and Mumbai (12.4 million). The city is India’s Silicon Valley,
and attracts people from all across the country. Bangalore has the largest cluster of IT based
service industry in the country. The city has a strong digital infrastructure and is an incubation
centre for start-ups. Many of the digital business processes that were adopted in other
economic sectors in response to the pandemic were already present and running is a large
section of the Bangalore’s economy. It was also seen that preparedness and support for
remote and digitally enhanced working were one of the highest in the IT&ITES sector. Hence
the adaption and the long term extension of such process are expected to continue for a
foreseeable future [16].
There changes are expected to have an impact of the travel pattern and the choice of travel
mode in the city in the long term mobility planning. Hence Bangalore appears to be an
excellent are for exploratory research on the impact of COVID-19 on shared mobility modes.
3.2 Survey design and implementation
The purpose of this research is to document impact of COVID-19 on shared mobility services
in Bangalore. Similar research globally has established the use of user survey in studies
related to mobility choice as well as specifically the case of shared mobility in the background
of COVID-19 [18]. An online survey was designed with 26 questions, to understand the trip
characteristics and preferences of mobility in the post COVID outbreak period. The
questionnaire had four sections with relevant questions on demography, pre COVID travel
behaviours, post COVID travel behaviour and perception towards shared mobility modes in
the post COVID scenario. A combination of close-ended questions (multiple selection, linear
WIT Transactions on The Built Environment, Vol 204, © 2021 WIT Press
www.witpress.com, ISSN 1743-3509 (on-line)Urban and Maritime Transport XXVII 135
scale) and open-ended questions were included. The survey instrumented was pre-tested with
10 pilot surveys and modified slightly based on user feedback. The survey was conducted in
the month of February 2021.
Convenience sampling method was used for the survey implementation which is an
established method in exploratory surveys. A database of users, proprietary to our company
was used to disseminate the survey. Google forms, a freely available software was chosen as
the platform to reach the respondents. The forms were emailed to 1,000 potential respondents
whom we assumed to be residents of Bangalore or frequent and occasional visitors to the
city.
3.3 Analysis
Out of 1,000 forms sent out, 120 completed surveys were received, which is about 11%
response rate. Out of 120, 101 responses were used for analysis. The rest (19) were discarded
due to data inconsistency. Considering ethics of research, we did not collect any personal
information such as name or other identifiers. The responses were found to be reasonably
well distributed spatially, across age groups, working groups, income groups and gender
groups. The responses were exclusively from residents and visitors of the city which further
strengthened the results. The responses were hence considered as representative of the user
base in the city for the purpose of exploratory research. Data was collated in a statistical
database analysis software for gathering statistics for various indicators. Correlation analysis
was carried out using SPSS software, to understand the association between the variables
through computation of Pearson’s Correlation coefficients. Given the exploratory nature of
the survey, the correlation analysis provided preliminary understanding on the strength of
association between the variables used in the survey.
4 RESULTS OF SURVEY
4.1 Respondent profile
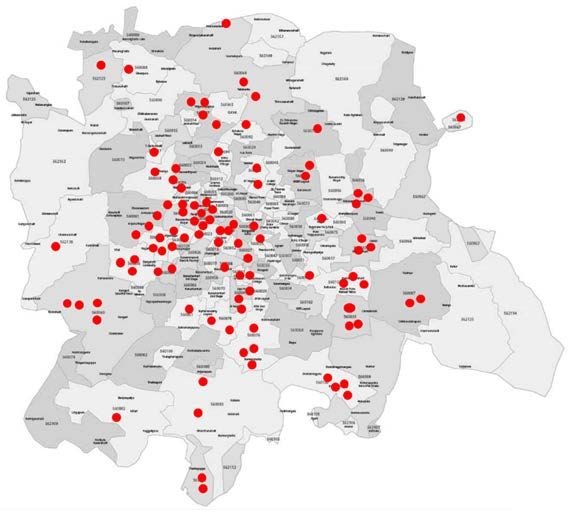
Distribution of the samples by the postal codes collected during the survey show that samples
are reasonably well distributed within the city. About 97% of the respondents were residents
of Bangalore city, about 70% were male respondents and 30% were female. Majority of the
respondents (77%) belonged to the age group 25–77 years where as other were from a higher
or a lower age group. The respondents were almost equally distributed among the middle-
income group ($214–$714 per month), the upper middle-income group ($714–$1,428 per
month) and the higher income group (more than $1,428 per month). About 73% of the
respondents owned multiple vehicle while only 1% reported owning no vehicle (see Fig. 1
and Table 1).
4.2 Impacts on trip characteristics due to COVID-19
During the survey, the lockdown measures were significantly relaxed and India as a whole
was witnessing a downward curve of COVID-19 infections. Vaccination drive was also in
implementation. The study reveals that there were significant changes in trip characteristics
after COVID-19. 30% of the respondents reported no daily travel after COVID-19 outbreak
in comparison to 10% before the pandemic. Significant reductions (13% and 25%) were also
noticed in users commuting more than 10 km and 15 km per day before the pandemic as seen
in Fig. 2.
WIT Transactions on The Built Environment, Vol 204, © 2021 WIT Press
www.witpress.com, ISSN 1743-3509 (on-line)136 Urban and Maritime Transport XXVII
Figure 1: Distribution of survey samples in Bangalore city.
Change in Trip Length after COVID-19
40%
20% 14%
20% 4%
0%
-20% No daily travel 1-5km 5-10km 10-15 km More than 15km
-13%
-40% -25%
Figure 2: Change in trip length after COVID-19.
19% of the respondents reported similar pattern of shared mode usage after the COVID-
19 while 81% reported either a reduction or non-existence of such trips. There was also a
transformation of mode choice after the COVID-19 among the respondents who reported a
shift from shared mode. About 24% reported transfer to self-owned cars, 18% of self-owned
scooter while 54% reported shifting to a combination of bicycle, cars and scooters.
About 70% of the respondents described cost per trip to be less than INR 300 (US $4.28)
before the COVID-19 outbreak while 25% spent between INR 300–INR 500 (US$4.28–
$7.14). There was an increase in travel cost reported by 19% of the respondents while 33%
reported not being able to gauge the difference in daily travel cost as they had shifted to
personal modes. 49% reported decrease in travel costs after the COVID-19. Among the
respondents reporting decreased travel cost, 32% stated shift of schooling or working to a
work-from-home mode while the other reported reduction in non-essential travel.
WIT Transactions on The Built Environment, Vol 204, © 2021 WIT Press
www.witpress.com, ISSN 1743-3509 (on-line)Urban and Maritime Transport XXVII 137
Table 1: Respondent demographics.
Survey
Indicators
Survey response Percentage
Gender
Male 71 70
Female 30 30
N 101
Resident status
Resident 98 97
Frequent visitor 1 1
Occasional visitor 2 2
N 101
Age (years)
Less than 18 years 1 1
18–25 years 9 9
25–50 years 78 77
More than 50 years 13 13
N 101
Employment status
Employed 69 67
Unemployed 28 33
Part-time employment 4
N 101
Type of employment
Government worker 6 7
Private company 60 65
Frontline worker (medical/police) 2 2
Business 24 26
N 92
Income (INR, lakhs per annum)
Less than 15,000 ($214) 6 6
15,000–50,000 ($214–$714) 27 27
50,000–100,000 ($714–$1,428) 25 25
More than 1,00,000 ($1,428) 33 33
No response 10 10
N 101
No of vehicle owned
Single vehicle 26 26
Multiple vehicles 74 73
No vehicle 1 1
N 101
Vehicles owned
Car 72 44
Bicycle 24 15
Motorcycle/scooter 67 41
N 163
WIT Transactions on The Built Environment, Vol 204, © 2021 WIT Press
www.witpress.com, ISSN 1743-3509 (on-line)138 Urban and Maritime Transport XXVII
4.3 Perceptions related to COVID-19
User perception related to the shared services and COVID-19 collected though a 5-point
Likert scale revealed that about 47% of the respondents perceived moderately high or high
risk of COVID-19 infections from usage of shared modes. About 92% of this group used
personal vehicles after the COVID-19 outbreak.
COVID-19 risk perception from shared mobility
37%
40%
27%
30%
20%
20%
8% 9%
10%
0%
Low Moderately low Moderate Moderately high High
Figure 3: COVID-19 risk perception from shared mobility.
However, 62% of respondents reporting similar pattern of shared mode usage pre and
post COVID outbreak stated shared mobility to either as a safer mode compared to other or
not being perceived as a huge risk. About 30% of respondents stated less than average
implementation of COVID-19 safety measure in the vehicles. 81% of this group reported
using shared services at least once after the COVID outbreak. Measures such as reduced no
of users per trip, vehicle sensitisation, drivers’ body temperature reporting was acknowledged
by the responding people. About 40% of the surveyed users reported likeliness of using
shared modes in the future where as 31% was unlikely and 30% were neutral about the
situation.
4.4 Correlation analysis
Correlation analysis was carried out to using Pearson’s correlation coefficient method to
analyse the association between the variables. The data was suitably treated and the
correlation matric was formed using SPSS software.
Results showed few meaningful correlations between the variables. A large number of
correlations were found negligible (−0.20 > R > 0.20), some of the correlations were weak
(−0.20 > R > −0.35) or (0.20 < R < 0.35). Few correlations were found to be ‘fair or moderate’
correlations (−0.35 > R > −0.50) or (0.35 < R < 0.50) and few were found to be ‘strongly
considerable’ high correlation (−0.5 < R < 0.70) or (0.5 > R > 0.7). Analysis of p value
revealed some of the variables to be significantly correlated. A section of the correlation
matric has been presented in Table 2.
Positive correlation was observed between income level and car ownership. Income level
as well as scooter ownership were positively correlated with mode switch to scooter post
COVID. It was also observed that perception of high risk from shared mobility was
negatively correlated with maintaining of pre-COVID travel modes. It was also found that
perception of shared modes taking adequate COVID safety measures was significantly
correlated to likeliness of usage of shared modes in future.
WIT Transactions on The Built Environment, Vol 204, © 2021 WIT Press
www.witpress.com, ISSN 1743-3509 (on-line)Table 2: Correlation matrix.
Income
Cycle ownership
Sco-MB own
Car ownership
Use SM_P-COV
Per_HR-SM
Red-SM-Small
Red_SM_NO
Red_SM_complete
Mode switch-car
Mode switch-sco
Mode switch-bike
No mode switch
Income 1.0
Cycle ownership 0.25* 1.0
www.witpress.com, ISSN 1743-3509 (on-line)
Sco-MB own – – 1.0
Car ownership 0.3** – (−) 0.27** 1.0
Use SM P-COV – – – – 1.0
Per HR-SM – – – – – 1.0
Red-SM-Small – – – – – – 1.00
WIT Transactions on The Built Environment, Vol 204, © 2021 WIT Press
Red SM NO – – – (−)0.03** – (−) 0.22* (−) 0.50** 1.00
** ** **
Red_SM complete – – – – (−) 0.37 0.35 (−)0.67 (−) 0.31** 1.00
* *
Mode switch-car – – – 0.22 – 0.25 – (−)0.16 – 1.00
Mode switch-sco (−)0.27** – 0.50** (−) 0.29** 0.25* – – (−)0.07 (−)0.08 – 1.00
*
Mode switch-bicy – 0.20 – – – – – – – – – 1.00
No mode switch – – – – – (−) 0.30** – 0.24* – (−)0.51** (−) 0.52** – 1.00
*Correlation is significant at 0.05 level (2 tailed); **Correlation is significant at 0.01 levels (2 tailed). Only data with significant correlation has been presented in the matrix. Sco-
MB own = scooter/motor bike ownership; Use SM_P-COV = used shared modes post COVID; Percep_HR-SM = perceived high risk from shared modes; Red-SM-Small = small
reduction in shared modes usage post COVID; Red_SM_NO = no reduction in usage of shared modes post COVID; Red_SM_complete = completely stopped using shared modes
post COVID; Mode Switch-bicy = switched mode to bicycle post COVID; Mode Switch-sco = switched mode to car post COVID.
Urban and Maritime Transport XXVII
139140 Urban and Maritime Transport XXVII
5 INFERENCE
The study provides useful insights into the impact of the COVID-19 on the usage of shared
mobility modes in Bangalore city. The survey results indicate that COVID-19 has significant
impact on the travel patterns among the commuters. A large segment of the commuters from
the private industry resorted to work-from-home mode. Travelling distances had reduced
from before COVID. Significant part of the users of shared modes in the pre-COVID era
shifted to personal vehicles like cars and scooters. There was reduced spending on travel for
a large segment of the users either due to work-from-home or due to reduction in non-
mandatory travel.
Among the group which continued usage of shared mobility modes after the COVID-19
outbreak, perception of linkage between usage of shared modes and COVID were low. In
some cases, shared modes were considered safer than other modes. However, the segment of
people retaining similar usage of share modes in pre and post COVID era was very low.
The travel choices were altered. Majority of respondents perceived a linkage between
usage of shared modes and COVID-19 infections. Perceptions of safety were also altered.
Personal vehicles like cars, scooters and bicycle as well as walking were perceived as safe.
About a third of the surveyed population expressed less than average satisfaction level with
the implementation of the COVID-19 safety measures in the shared modes. There were some
significant correlations observed between the surveyed variables. Income level was revealed
to be significantly correlated to car ownership and switching of travel mode to scooter post
COVID. Ownership of car and scooter were significantly correlated to switching of travel
mode to car and scooter respectively in the post COVID scenario. There was significant
correlations found between perception of COVID risk from shared modes with change in
travel mode post COVID as well as perception of COVID safety measures with likeliness of
usage of shared modes in future.
6 CONCLUSION
This paper presented the trip characteristics and user perception about shared mobility after
the outbreak of the COVID-19 during a period when the restrictions related to COVID-19
were significantly relaxed and vaccination was under implementation. There were no
restrictions in people’s movement during this period except personal COVID protection
advisories like wearing of mask, sanitisation, social distancing and reducing non-mandatory
travel. During the period of the survey the COVID-19 infection curve was in a downward
trajectory and majority of the business and activities has resume to business as usual except
mandatory closure of schools below the age of 12. Even though the situation cannot be
attributed as a ‘normal scenario’ however in the post COVID-19 era, it would appear as the
‘new normal’. Unlike the west, India had not seen the second or the third wave of COVID-
19 infection surge during the period of the survey. However, going by the global trend, a
second wave is a very realistic possibility. Coupled with that, the altered business processes
and nature of economic activities like work-from-home and online schooling could possibly
have a longer life cycle than the life cycle of the pandemic. Hence the results of the survey
during this period can be considered representative of people’s perception towards shared
mobility modes and travel patterns for the foreseeable future.
Research and data related to shared mobility is in a nascent stage in India. This paper
presents exploratory research data and is one of the first documented studies on impact of
COVID-19 on shared mobility in Bangalore. Bangalore is one of the prominent metropolises
of India and user perceptions about shared mobility could be representative of the trend in
major cities in the country. The research also presented correlations between some factors of
WIT Transactions on The Built Environment, Vol 204, © 2021 WIT Press
www.witpress.com, ISSN 1743-3509 (on-line)Urban and Maritime Transport XXVII 141
the survey. In the context of the high growth projected for this market in the past, this study
would be a significant first step of greater research on sustainability of the shared mobility
market.
ACKNOWLEDGEMENTS
I would like to express my gratitude to Sky Group for supporting and funding the research. I
also convey a huge vote of thanks to my peers in research and practice for advice and inputs
and to my family for their unconditional support.
REFERENCES
[1] Strategic Assessment of Shared Mobility Market in India, Frost and Sullivan, Sep.
2019.
[2] NITI Aayog, Moving Forward Together: Enabling Shared Mobility in India, Rocky
Mountain Institute, and Observer Research Foundation, 2018.
[3] Government of India Portal on COVID-19. https://www.mygov.in/covid-19.
[4] Bruhat Bangalore Mahanagara Palike (Bangalore Municipal Corporation) portal on
COVID-19. https://covid19.bbmpgov.in/.
[5] Corona Virus Resource Centre, John Hopkins University & Medicine.
https://coronavirus.jhu.edu/map.html.
[6] Shaheen, S., Bell, C., Cohen, A. & Yelchuru, B., Travel Behaviour: Shared Mobility
and Transportation Equity, Federal Highway Administration, 2017.
[7] Shaheen, S., Cohen, A. & Martin, E.U.S., Department of transportation’s mobility on
demand initiative: moving the economy with innovation and understanding.,
Transportation Research Circular, Washington, DC, USA, 2018.
[8] Dias, F.F., Lavieri, P.S., Garikapati, V.M., Astroza, S., Pendyala, R.M. & Bhat, C.R.,
A behavioral choice model of the use of car-sharing and ride-sourcing services.
Transportation, 44, pp. 1307–1323, 2017.
[9] Yogesh, K. et al., Impact of COVID-19 pandemic on information management
research and practice: Transforming education, work and life. International Journal of
Information Management, 55, p. 102211, 2020. ISSN 0268-4012.
[10] Carrington, D., UK road travel falls to 1955 levels as Covid-19 lockdown takes hold.
The Guardian, 3 Apr. 2020.
[11] De Vos, J., The effect of COVID-19 and subsequent social distancing on travel
behavior. Transportation Research Interdisciplinary Perspectives, 5, 2020.
[12] Beck, M.J. & Hensher, D.A., Insights into the impact of COVID-19 on household
travel and activities in Australia – The early days under restrictions. Transport Policy,
96, pp. 76–93, 2020.
[13] Mohammadian, A., Shamshiripour, A., Rahimi, E. & Shabanpour, R., TRB webinar:
How much will COVID 19 affect travel behavior, 2020.
[14] Bucsky, P., Modal share changes due to COVID-19: The case of Budapest.
Transportation Research Interdisciplinary Perspectives, 8, p. 100141, 2020.
[15] Singh, V., Gupta, K., Agarwal, A. & Chakrabarty, N., Psychological impacts on the
travel behavior post-COVID-19. WP #33, Indian Institute of Technology Roorkee, Jul.
2020.
[16] Bhaduri, E. et al., Modelling the effects of COVID-19 on travel mode choice behaviour
in India. Transportation Research Interdisciplinary Perspectives, 8, 2020.
[17] Cohen, B. & Kietzmann, J., Ride on! Mobility business models for the sharing
economy. Organization & Environment, 27, pp. 279–296, 2014.
WIT Transactions on The Built Environment, Vol 204, © 2021 WIT Press
www.witpress.com, ISSN 1743-3509 (on-line)142 Urban and Maritime Transport XXVII
[18] Shaheen, S., Chan, N., Bansal, A. & Cohen, A., Shared Mobility: A Sustainability and
Technologies Workshop—Definitions, Industry Developments, and Early
Understanding, Transportation Sustainability Research Center, University of
California, Berkeley and California Department of Transportation: Richmond, CA,
USA, 2015.
[19] Coates, M., The evolution of car sharing. Clean Fleet Report, 2016.
[20] Shokouhyar, S. et al., Shared mobility in post-COVID era: New challenges and
opportunities. Sustainable Cities and Society, 67, 2021.
[21] Nikiforiadis, A., Ayfantopoulou, G. & Stamelou, G., Assessing the impact of COVID-
19 on bike-sharing usage: The case of Thessaloniki, Greece. Sustainability, MDPI,
2020.
[22] Ministry of Home Affairs, Government of India, Guidelines on the measures to be
taken by Ministries/Departments of Government of India, State/Union Territory
Governments and state and union territory authorities for the containment of COVID-
19 Epidemic in the country, Mar. 2020.
[23] Google, COVID-19 community mobility reports. Accessed on: Feb. 2021.
[24] Shared mobility and the transformation of public transit. TCRP Research Report 188,
Transportation Research Board, 2017.
[25] Ghosh, G., Characteristics of shared mobility in Bangalore. WIT Transactions on the
Built Environment, vol. 200, WIT Press: Southampton and Boston, 2020.
WIT Transactions on The Built Environment, Vol 204, © 2021 WIT Press
www.witpress.com, ISSN 1743-3509 (on-line)You can also read