Impact of Ecological footprint, bio-capacity & biodiversity on environmental sustainability - IJRASET
←
→
Page content transcription
If your browser does not render page correctly, please read the page content below

International Journal for Research in Applied Science & Engineering Technology (IJRASET)
                                                                        ISSN: 2321-9653; IC Value: 45.98; SJ Impact Factor :6.887
                                                                      Volume 6 Issue I, January 2018- Available at www.ijraset.com

       Impact of Ecological footprint, bio-capacity &
        biodiversity on environmental sustainability
                                Prof. A. Asif Ali1, Prof. Vandana Srivastava2, Prof A. Seshachalam3
                            1
                             Assistant Professor, Department of Management, IFIM College, Bangalore.
                            2
                              Assistant Professor, Department of Management, IFIM College, Bangalore
                            3
                              Assistant Professor, Department of Management, IFIM College, Bangalore

Abstract: A healthy sustainable environment is to have a balance between human consumption and natural resources produced
periodically. In the past, resources were plenty and people were scarce, but, during the recent years, the evolution of development
in people lifestyle has let to consume natural resources tremendously while earth’s natural wealth in biodiversity is decreasing
drastically. So, it’s a challenge to maintain the balance, so that, our communities are sustainable locally, regionally and globally.
This paper is an attempt to explore the facts and figures on the impact of ecological footprints on environment and measures
required to reduce the ecological footprint for making human development through environment sustainable for current and
future generations.
Keywords: Biodiversity, ecological footprint, bio capacity, environment sustainability, natural resources

                                                            I.       INTRODUCTION
A healthy sustainable environment is to have a balance between human consumption and natural resources produced periodically. In
the past, resources were plenty and people were scarce, but, during the recent years, the evolution of development in people lifestyle
has let to consume natural resources tremendously while earth’s natural wealth in biodiversity is decreasing drastically. So, it’s a
challenge to maintain the balance, so that, our communities are sustainable locally, regionally and globally.
As we are a part of the earth every single human owns the impact he/she cause on the mother earth. As an individual consuming
more products and services of the nature causing depletion of the earth’s natural capital. Each generation is demanding more from
our stocks of natural capital than the last generation did. Population is increasing every second so as their need, wants and
consumption, but still there is only one planet earth.
We are living a risker world with more consumption, more waste, more poverty, poor patterns of usage of the available resources
leads to less forest, less fresh water, air, soil, and less ozone layer.
Therefore, many people have already started facing issues of sustainable development in their everyday lives. To have a better living
condition for us and our future generations, we must know where we are now and how far we need to go to attain environment
sustainability by reducing the ecological footprint.

                                                 II.        LITERATURE REVIEW
A. Ashish Kothari 2015
Assessment of various visions and frameworks being proposed globally or in individual countries, from which India could learn,
adopt, and evolve its own framework as suitable for its ecological, cultural, economic and political context.

B. Vivek Anand 2013
There are huge variations between the ecological footprint of highest and lowest decile consumption categories in both urban and
rural areas. Indian Ecological Footprint is not closer to that of developed countries. The bio capacity of forestland is only 0.022
global hectare per capita in India. This bio capacity limit will put a severe strain on Indian economy.

C. Jasna Patric
Moving sustainability of the city forward becomes far more likely if strategies are chosen that both improve people’s
quality of life and reduce the size of city’s ecological footprint. These strategies concern both city’s supply side (protection,
conservation, and restoration of natural ecosystems), and city’s demand side (improved resource-efficiency with which goods and
services are produced, reduced per capita consumption, and control- led population size.

  ©IJRASET (UGC Approved Journal): All Rights are Reserved                                                                               2706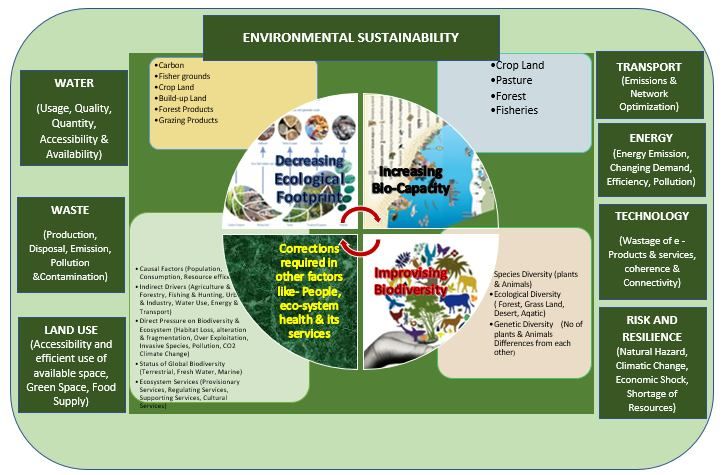
International Journal for Research in Applied Science & Engineering Technology (IJRASET)
                                                                         ISSN: 2321-9653; IC Value: 45.98; SJ Impact Factor :6.887
                                                                       Volume 6 Issue I, January 2018- Available at www.ijraset.com

D. Sonu Goel et al, 2011
By highlighting the inequities within and between people and nations, ecological footprint provides a useful tool that can help to
raise public awareness and shape a healthier and more sustainable future.

E. Rees William E, 2010
 The world community must work cooperatively to create a new ‘steady-state’ model of exchange that will actually
contribute to global sustainability for the common good.

F. Lenzen etal., 2003
The ecological footprint has been identified as a useful tool for identifying which impacts (and subsequent aspects) are significant
and, therefore, those aspects which should be managed in a company’s environmental management system.

G. Viebahn, 2002
corporate sustainability efforts have focused heavily on environmental aspects.

H. Ian Moffatt, 2000
The author in his study on ecological footprints and sustainable development had described the advantages and disadvantages of the
ecological footprint concepts.
The author had concluded that awareness must be raise among the people and a new concept of dynamic model should be developed
for sustainability development. Arguably, the most advantageous feature of the ecological footprint over other sustainability
indicators is that it is conceptually simple, with aggregated flows expressed in an easily digestible form – as land area.

I. Rees, 2000
 Society has experienced significant advancements in technology. To be noticeable difference is society has become isolated from
the physical realities of the land on which they live. Furthermore, by focusing on consumption, the ecological footprint concept
“personalizes sustainability”, as we are all consumers (Rees, 2000, p372).

J. Wackernagel and Rees, 1996; Chambers et al., 2000; Charlton, Unpublished
The ecological footprint has thus been described as a powerful indicator for communicating sustainability issues to the wider
community.

K. Ehrlich and Holdren, 1971
The ecological footprint also corresponds closely with the principles of the widely accepted ecological IPAT model, where I
(Impact) = P (Population) x A (Affluence) x T (Technology).

L. Wackernagel and Rees 1996
 developed the tool, which measures the carrying capacity in terms of land represented as a measure of land needed to sustain human
activities for a given population. They define ecological footprint approach as, “the area of ecologically productive land (and water)
in various classes – cropland, pasture, forests, etc – that would be required on a continuous basis to (a) Provide all the
energy/material resources consumed, and (b) Absorb all the wastes discharged by that population with prevailing technology,
wherever on Earth that land is located”.

M. Rees, 1992
The ecological footprint method has undergone significant changes since it was first introduced in 1992.

                                                  III.     OBJECTIVE OF THE STUDY
A.   To understand the sensitivity of ecological footprint
B.   To know the various concepts of ecological footprint, bio-capacity, biodiversity, environment and other eco-factors.
C.   To identify the key factors contributing ecological footprint and environmental sustainability
D.   To find the various Indian government policies towards ecological balance and environmental sustainability
E.   To formulate a model for attaining environmental sustainability

  ©IJRASET (UGC Approved Journal): All Rights are Reserved                                                                               2707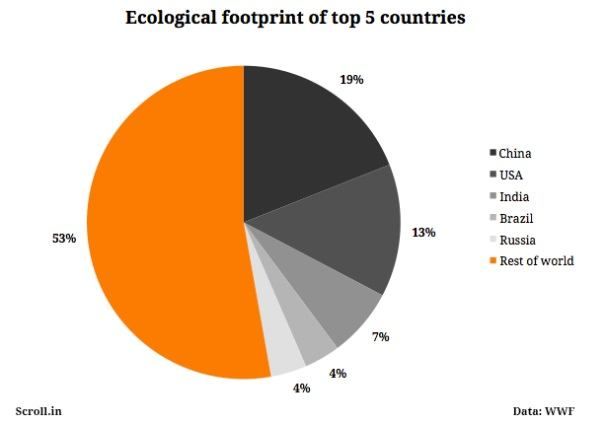
International Journal for Research in Applied Science & Engineering Technology (IJRASET)
                                                                      ISSN: 2321-9653; IC Value: 45.98; SJ Impact Factor :6.887
                                                                    Volume 6 Issue I, January 2018- Available at www.ijraset.com

              IV.      CONCEPTS & SENSITIVITY OF ECOLOGICAL FOOTPRINT AND ITS REQUIREMENT
1) Ecological footprint: The ecological footprint measures how much nature it takes to support people. It is an ecological
    accounting system. It contrasts how much biologically productive area people use for their consumption to how much
    biologically productive area is available (biocapacity). “The measures of impact human have on the environment”
2) Ecological Footprint of production (EF-P): A nation’s production Footprint is the sum of the Footprints for all the resources
    harvested and all the waste generated within the defined geographical region.
3) Ecological Footprint of imports (EF-I): The Footprint embodied in domestically consumed products which are imported from
    other countries.
4) Ecological Footprint of exports (EF-E): The Footprint embodied in domestically produced products which are exported and
    consumed in another country.
5) WWF defines Ecological Footprint as: “A country’s ecological footprint is the sum of all the cropland, grazing land, forest and
    fishing grounds required to produce the food, fibre and timber it consumes, to absorb the wastes emitted when it uses energy
    and to provide space for infrastructure”
6) Environmental sustainability: A safe state in which the footprint of human activities placed on the environment is kept within
    boundary of capacity.
7) Environmental unsustainability: An unsafe state in which the footprint of human activities placed on the environment exceeds
    boundary of capacity.
8) Global hectare (gha): Global hectares are the accounting unit for Ecological Footprint and Biocapacity accounts. These
    productivities weighted biologically productive hectares allow researchers to report both the Biocapacity of the earth or a
    region, and the demand on Biocapacity (the Ecological Footprint). A global hectare is a biologically productive hectare with
    world average biological productivity for a given year.
9) (Global Average Availability of Bio Productive Land + Sea = Global Hectares/Person)
10) Biocapacity: According to Global footprint network, “Biocapacity is shorthand for biological capacity, which is the ability of
    an ecosystem to produce useful biological materials and to absorb carbon dioxide emissions”
11) Bio Capacity Deficit/Ecological Deficit: The Ecological Footprint of a population exceeds the biocapacity of the area available
    to that population.
12) Biodiversity: 'Biological diversity' means the variability among living organisms from all sources including, inter alia,
    terrestrial, marine and other aquatic ecosystems and the ecological complexes of which they are a part; this includes diversity
    within species, between species and of ecosystems.
13) Human Carrying capacity: Maximum number of load of individuals that an environment can sustainably carry or support.
14) Carbon footprint (CO2): A carbon footprint is the total amount of greenhouse gas emission caused by an organization, event,
    product or individual. “Emissions associated with fossils fuel use”. In Ecological Footprint accounts, these amounts are
    converted into biologically productive areas necessary for absorbing this CO2.
15) Consumption Footprint: It is defined as the area used to support a defined population’s consumption. Consumption Land Use
    Matrix allocates the six major Footprint land uses (shown in column headings) allocated to the five basic consumption
    components (row headings).

                              Source: Global Footprint Network URL: http://www.zujiwangluo.org/glossary
Note:
Ecological Foot print of Consumption EP(c) = Ecological Footprint of Production EP (p) + Ecological foot print of Trade EP (t)

  ©IJRASET (UGC Approved Journal): All Rights are Reserved                                                                            2708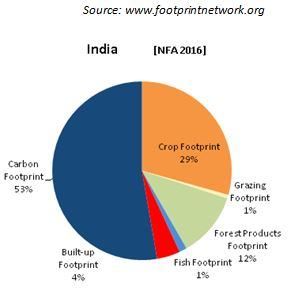
International Journal for Research in Applied Science & Engineering Technology (IJRASET)
                                                                          ISSN: 2321-9653; IC Value: 45.98; SJ Impact Factor :6.887
                                                                        Volume 6 Issue I, January 2018- Available at www.ijraset.com

Ecological Footprint of Trade EP (t) =Ecological Footprint of Import EP (i) – Ecological Footprint of Export EP (e)
As the world population increasing already crossed 7 billion people, so does the amount of resources required to sustain. As-Per the
Centre of Sustainable economy, each person should use 15.71 global hectares to sustain the Earth's resources, including clean air
and water. Right now, the average person's global footprint is 23.7 global hectares, nearly twice as much as the Earth's maximum
sustainable resource level.
                                  Year population (midyear) Average annual growth rate (%)
                                  2015       7,324,782,225                     1.09%
                                  2016       7,404,976,783                     1.07%
                                  2017       7,484,325,476                     1.05%
                                  2018       7,562,760,049                     1.02%
                            World’s population growth, Source: Geo Hive - World Population 1950-2050

There is a need to understand our fragile ecosystem that depends on a vast number of complex and interconnected physical systems,
making it extremely sensitive to rapid changes to its environment. Once the intricate balance responsible for sustaining life on earth
is broken, the planet would rapidly become inhospitable resulting in rapid loss of life and potentially, extinction of majority of the
species residing on the earth, including humans.
If we don't drastically reduce everyone’s ecological footprint, by the sheer numbers of our exponentially bulging population, our
insatiable appetites for the earth’s resources will drive this balance off the scale. The limits to our natural resources are expressed in
in myriad ways such as biodiversity loss, topsoil depletion, the collapse of fish stocks, peak oil etc. A key step is to understand and
repair our relationship by developing more sustainable approaches to living and development.
In 1961, our planet could supply 37 percent more resources and services than humanity demanded.
In 2016, the world population demands 64 percent more than what nature can regenerate in one year. Like emitting more carbon
dioxide than our ecosystems can absorb, over-harvesting our forests, overfishing. Thus, it affects collapsing fisheries, climate
change and wildlife habitat loss and fragmentation.

            V.       COMPONENTS/FACTORS CONTRIBUTING ECOLOGICAL FOOTPRINTS ACCOUNTING
A. Growing Crops
Calculated from the area used to produce food and fiber for human consumption, feed for livestock, oil crops and rubber.

  ©IJRASET (UGC Approved Journal): All Rights are Reserved                                                                                   2709
International Journal for Research in Applied Science & Engineering Technology (IJRASET)
ISSN: 2321-9653; IC Value: 45.98; SJ Impact Factor :6.887
Volume 6 Issue I, January 2018- Available at www.ijraset.com
B. Grazing land
Calculated from the area used to raise livestock for meat, dairy, hide and wool products.
C. Forest Footprint
Calculated from the amount of lumber, timber products and fuel woods consumed by a country each year.
D. Catching Fish
Calculated from the estimated primary production required to support the fish and seafood caught, based on each data for 1,439
marine species and more than 268 freshwater species.
E. Accommodating Infrastructure
(Transports, Industry, Housing, Buildup area): Calculated by the area of the land covered by human infrastructure, including
transportation, housing, industrial structures, and reservoir for hydropower.
F. Carbon Dioxide Emissions & Absorptions
(Burning Fossil Fuels): Calculated as the amount of forest land required absorbing CO2 emissions from burning fossil fuel, land-
use change and chemical process, other than the portions observed by the oceans.
VI. GLOBAL ECOLOGICAL FOOTPRINT STATISTICS
Rank Country Ecological Biocapacity Biocapacity Population
Footprint (gha/person) deficit in - or (millions of
(gha/person) reserve in people)
+(gha/person)
1 Luxembourg 15.82 1.68 -14.14 0.52
2 Aruba 11.88 0.57 -11.31 0.1
3 Qatar 10.8 1.24 -9.56 2.05
4 Australia 9.31 16.57 7.26 23.05
5 United States of America 8.22 3.76 -4.46 317.5
6 Canada 8.17 16.01 7.83 34.84
7 Kuwait 8.13 0.55 -7.58 3.25
8 Singapore 7.97 0.05 -7.92 5.3
9 United Kingdom 7.93 0.56 -7.37 9.206
10 Trinidad and Tobago 7.92 1.56 -6.36 1.34
164 INDIA 1.16 0.45 -0.71 1236.69
Source: Wikipedia, The above table is based on 2012 data from the Global Footprint Network National Footprint Accounts
published in 2016.
Source: htpps://scroll.in
©IJRASET (UGC Approved Journal): All Rights are Reserved 2710International Journal for Research in Applied Science & Engineering Technology (IJRASET)
ISSN: 2321-9653; IC Value: 45.98; SJ Impact Factor :6.887
Volume 6 Issue I, January 2018- Available at www.ijraset.com
India has Biocapacity deficit of 160% and -0.71 gha/person which is a high threat zone as population is keep increasing every
second. India stands at 164th rank globally and its ecological footprint stands 1.16 gha/person.
India stands at top three positions in Global Ecological Footprints 2016 next to china and USA. India has rich ecological resources
and is among the top 10 countries contributing to the world’s biocapacity. But it also has the third biggest ecological footprint,
according to the World Wildlife Fund’s Living Planet report released earlier this year.
VII. GLOBAL FOOTPRINT NETWORK HAS RELEASED ITS LIVING PLANET REPORT, ACCORDING TO IT –
UCCADMIN HAS REPORTED THE FOLLOWING
A. India ranks 3rd in its Ecological Footprint due to its high population levels despite a low per capita consumption of natural
resources.
B. The Top 2 countries include – China and USA.
C. National Footprint Accounts 2016 by World Bank says that the Cropland and forest footprints were the largest components of
India’s overall ecological footprint, until the late 1980s.
D. Carbon footprint which took over in the late 2000s & India’s carbon footprint currently makes up 53% of the country’s overall
Ecological Footprint.
VIII. INDIA’S ENVIRONMENTAL GOVERNANCE AND ITS POLICIES
Environment policies of the Government of India include legislations related to environment.
A. In the Directive Principles of State Policy, Article 48 says "the state shall endeavor to protect and improve the environment and
to safeguard the forests and wildlife of the country"
B. Article 51-A states that "it shall be the duty of every citizen of India to protect and improve the natural environment including
forests, lakes, rivers and wildlife and to have compassion for living creatures."India is one of the parties of the Convention on
Biological Diversity (CBD) treaty. Prior to the CBD, India had different laws to govern the environment.
C. The Indian Wildlife Protection Act 1972 protected the biodiversity. It was amended later multiple times. The 1988 National
Forest Policy had conservation as its fundamental principle.
D. In addition to these acts, the government passed the Environment (Protection) Act 1986.
E. Foreign Trade (Development and Regulation) Act 1992 for control of biodiversity
IX. TABLE FORMULATED BY THE AUTHORS OF THE RESEARCH PAPER
S.No Ecological Conditions Results Signal Period
1. If Ecological Footprint Availability of Global GREEN SIGNAL Long Year Ago
< Biocapacity Hectare/Person in within
(Demand < Supply) limits (Biocapacity
Global Strength Researve)
2. If Ecological Footprint Availability of Global ORANGE SIGNAL Few Years Before
= Biocapacity Hectare/Person has
(Demand = Supply) reached limits (Break- (Biocapacity Reach)
even point) Global Weakness
3. If Ecological Footprint Availability of Global RED SIGNAL Present Era
> Biocapacity Hectare/Person has (Biocapacity
(Demand > Supply) exceeded the available Deficit/Ecological
limits Global Threat Deficit)
A. Bio-Capacity(Supply) = Area * Bio- productivity
B. Ecological Footprint(Demand) = Population * Consumption per head * Footprint Intensity
C. Threats of Biodiversity:
D. Introduce & Invasive Specie
E. Pollutio
F. Over Exploitati
©IJRASET (UGC Approved Journal): All Rights are Reserved 2711International Journal for Research in Applied Science & Engineering Technology (IJRASET)
ISSN: 2321-9653; IC Value: 45.98; SJ Impact Factor :6.887
Volume 6 Issue I, January 2018- Available at www.ijraset.com
G. Climatic Chan
H. Human Overpopulatio
I. Hybridization & Food security
J. Destruction
X. MODEL FORMULATION FOR ENVIRONMENTAL SUSTAINABILITY
XI. CONCLUSION
The paper has described the advantages and limitations of the ecological footprint concept. It has been suggested the need of raising
awareness of our impact on the earth. As a matter of fact, there is a minimum amount of land per capita to support all life including
humans. This is an alarming message for the present generation, beyond this there is also a need to explore in depth the current
macroeconomic and political governance structures, assessment of current levels of ecological unsustainability (and related human
insecurity and inequity) using tools such as those listed above, and delineation of specific macroeconomic and governance changes
needed to move towards a framework of sustainability.
It has been argued that by combining ecological footprints with more detailed methods, such as input/output or natural resource
accounting, further detailed work of relevance to policy makers will become available. Such static approaches would still need to be
made crucial and dynamic. To develop an internally consistent theory of economical sustainability and ecological interactions
requires a fundamentally new theory and associated new measures of sustainable development.
If such research were pursued in an holistic, integrated manner then the ecological footprint concept would be greatly extended and
deepened. The outcomes of study in this field could offer policy makers and members of the public some direction in their heartfelt
quest to make development economically sound, socially just and ecologically sustainable.
The paper recognizes that this process is very unlikely without public mobilization and pressure; hence the crucial role of people’s
movements, civil society organizations, academic think-tanks, and progressive political leaders. It also recognizes that India cannot
achieve such a framework on its own, and needs to work towards parallel global changes.
©IJRASET (UGC Approved Journal): All Rights are Reserved 2712International Journal for Research in Applied Science & Engineering Technology (IJRASET)
ISSN: 2321-9653; IC Value: 45.98; SJ Impact Factor :6.887
Volume 6 Issue I, January 2018- Available at www.ijraset.com
REFERENCES
[1] Ashish Kothari, 2015, Development and ecological sustainability in India, Oxfam India working papers series, Pg:1-33
[2] Vivek Anand A, 2013, Dissertation, Measuring Sustainability of India through Ecological Footprint Approach, School of Habitat Studies, Tata Institute of
Social Sciences, Pg: 1 – 7
[3] Jasna Petric, Sustainability of the city and its ecological footprint, Spatium, Pg:48-52
[4] Sonu Goel, Binod Patro, Sonika Goel Raj, Ecological Footprint: A tool for measuring Sustainable development, International Journal of Environmental
Sciences Year : 2011, Volume : 2, Issue : 1 First page : ( 140) Last page : (144)Online ISSN : 0976-4402
[5] Rees William E, Globalization, Eco-Footprints and the Increasingly Unsustainable Entanglement of Nations, The State of the Art in Ecological Footprint
Theory and Applications, Foot print forum 2010, Pg:1-2
[6] Lenzen, M., Murray, S.A., Korte, B. and Dey, C.J (2003a) Environmental impact assessment including indirect effects - a case study using input-output
analysis. Environmental Impact Assessment Review, 5294, 1-20.
[7] Viebahn, P. (2002) An environmental management model for universities: from environmental guidelines to staff involvement. Journal of Cleaner Production,
10, 3-12.
[8] Ian Moffatt; 2000. Ecological footprints and sustainable development; Ecological Economics 32 (2000) 359 – 362
[9] Rees, W.E. (2000) Eco-footprint analysis: merits and brickbats. Ecological Economics,32, 371-374.
[10] Wackernagel, M., Rees, W.E. (1996) Our Ecological Footprint: Reducing Human Impact on the Earth New Society Publishers, Canada.
[11] Chambers, N., Simmons, C., Wackernagel, M. (2000) Sharing Nature's Interest: Ecological Footprints as an Indicator of Sustainability Earthscan Publications
Ltd., London.
[12] Charlton, K. (unpublished) An Ecological Footprint Analysis for Western Australia. Honours Thesis 2002, Curtin University of Technology, Perth.
[13] Ehrlich, P., Holdren, J. (1971) Impacts of Population Growth. Science, 171, 1212-17.
[14] Wackernagel, M., & Rees, W. (1996). Our Ecological Footprint: Reducing Human Impact on the Earth. Gabriola Island, BC, Canada: New Society Publishers.
[15] William E. Rees 1992, Ecological Foot Prints and appropriated carrying capacity: What urban economics leaves out, Ecological Footprints, Environmental and
Urbanization, Vol. 4, No. 2, October 1992, Pg:121 – 130.
©IJRASET (UGC Approved Journal): All Rights are Reserved 2713You can also read