INDIAN JOURNAL OF SCIENCE AND TECHNOLOGY
←
→
Page content transcription
If your browser does not render page correctly, please read the page content below

INDIAN JOURNAL OF SCIENCE AND TECHNOLOGY

RESEARCH ARTICLE

                                        Deep Learning based Long Short-Term
                                        Memory Recurrent Neural Network for
                                        Stock Price Movement Prediction
     OPEN ACCESS                        S Pandikumar1 ∗ , S Bharani Sethupandian2 , M Sakthi Saravanan3 ,

Received: 04.01.2022
                                        S Navin Prasad4 , M Arun5
Accepted: 04.02.2022                    1 Assistant Professor, Department of Computer Science, The American College, Madurai,
                                        Tamil Nadu, India
Published: 14.03.2022
                                        2 Assistant Professor, Department of Computer Science, Mannar Thirumalai Naicker College,
                                        Madurai, Tamil Nadu, India
                                        3 Assistant Professor, Department of Computer Science, Ayya Nadar Janaki Ammal College,
                                        Sivakasi, Tamil Nadu, India
Citation: Pandikumar S,                 4 Assistant Professor, Department of Computer Science, Nagarathinam Angalammal Arts and
Sethupandian SB, Saravanan MS,          Science College, Madurai, Tamil Nadu, India
Prasad SN, Arun M (2022) Deep           5 Assistant Professor, Department of Computer Science, Sri Krishna Adithya College of Arts
Learning based Long Short-Term          and Science, Coimbatore, Tamil Nadu, India
Memory Recurrent Neural Network
for Stock Price Movement
Prediction. Indian Journal of Science
and Technology 15(11): 474-480. htt
                                        Abstract
ps://doi.org/10.17485/IJST/v15i11.27
                                        Background/Objectives: Stock price movement prediction is a difficult task
∗
    Corresponding author.               that is simulated using machine learning algorithms to anticipate stock returns.
spandikumar@gmail.com                   Methods: This study uses the Long-Short-Term Memory (LSTM) Recurrent
Funding: None
                                        Neural Network deep learning algorithm combined with the stock’s price action
                                        method to predict the movement of intraday price for short-term forecasting.
Competing Interests: None
                                        The dataset uses data points such as date, open, high, low, close, volume. The
Copyright: © 2022 Pandikumar et
                                        predictions of price movement accuracy were tested on State Bank of India
al. This is an open access article
distributed under the terms of the      (SBI) stock and one year of the trading dataset used for training the algorithm.
Creative Commons Attribution            Findings: The proposed algorithm gives the prediction of price movement
License, which permits unrestricted
                                        accuracy is up to 98.9%, MSE is 0.918 and MAPE 0.987 with one year of the
use, distribution, and reproduction
in any medium, provided the             training dataset. The SBI share price can be predicted one day before and
original author and source are          the price prediction can be range level, which means upward or downward.
credited.
                                        The proposed method has proven to be better than traditional machine
Published By Indian Society for         learning methods in terms of prediction accuracy and speed. Novelty: This
Education and Environment (iSee)
                                        research suggested a fine-tuned and personalized deep learning prediction
ISSN                                    system that coupled the price action technique with LSTM to make predictions.
Print: 0974-6846
                                        The combination of the price action method with deep learning algorithm in
Electronic: 0974-5645
                                        forecasting is not tried before but this paper does.
                                        Keywords: LongShortTerm Memory; Stock Trading; Stock Price prediction;
                                        Recurrent Neural Network; Deep Learning; Machine Learning 1

                                        1 Introduction
                                        Investing in stock market is always been difficult. It takes more science than fluke to
                                        pick the right company at the appropriate time to invest in. Various machine learning

https://www.indjst.org/                                                                                                      474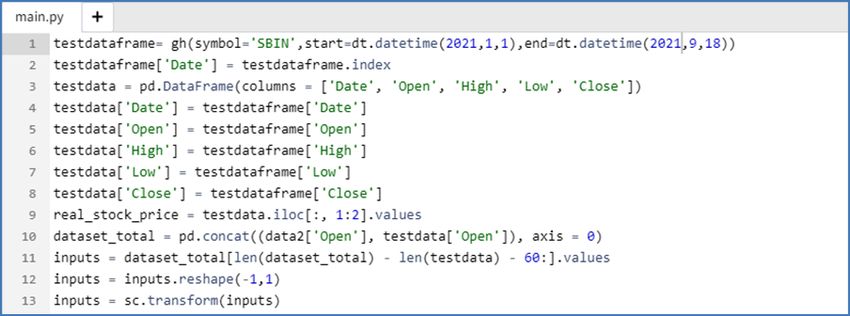
Pandikumar et al. / Indian Journal of Science and Technology 2022;15(11):474–480

 approaches have been utilized in stock market prediction over the years, but deep learning models are increasingly being used
because of the increased amount of data and the anticipation of more accurate predictions (1) . Deep learning uses a variety
of techniques and algorithms, one of which is a type of neural network called the Recurrent Neural Network (RNN) (2) . The
ensemble of time series analysis with the price action method is a rare phenomenon of predicting the stock price in a day
trading. The proposed method takes those two attributes as an input to RNN and forecasts the value. Linear regression and
ARIMA (Autoregressive Integrated Moving Average) [x3] is the techniques to predict the values up to 97.25 but the researchers
tested around 100 days only but the proposed RNN based LTSM can give up to 98.9% accuracy in price movement according
to 365 days of testing. With the one-year time frame MSE (Mean Squared Error) and Mean Absolute Percentage Error (MAPE)
can be better than ARIMA and SVM (Support Vector Machine) methods.
   In (3) , Sirignano and Cont introduced a deep learning approach that was trained on a universal collection of financial market
features. The dataset comprised all bought and sold records for all trades, as well as withdrawals of orders for about thousands
NASDAQ equities via the stock exchange’s order book. The NN is made up of three layers: LSTM units, a feed-forward layer,
and finally, a feed-forward layer using rectified linear units (ReLUs), with the Stochastic Gradient Descent (SGD) algorithm as
an optimizer. Those universal model could generalize and cover stocks that weren’t part of the training set. Despite mentioning
the benefits of a universal paradigm, the training costs were remained high. Meanwhile, it’s unknown whether there are any
meaningless features tainted when feeding data into the model due to the deep learning algorithm’s inexplicit programming.
The authors discovered that performing feature selection previously training the model would have been better and that it was
an efficient technique to reduce computational complexity.
   In (4) , Fischer and Krauss used LSTM to predict monetary markets. The dataset they used was Thomson Reuters’ S&P 500
index constituents. The research drawback is a lack of background knowledge in the financial domain. The effort to train an
LSTM with long-time dependencies was not mentioned by the author.
   The research (5) used RNN and LSTM to forecast the price of cryptocurrencies, with the feature engineering part improved
using the Boruta method, and it performs almost same to the random forest classifier. They employed Bayesian optimization
to select Long Short Term Memory attributes in addition to feature selection. Overfitting is the main issue in this study. The
problem of anticipating Bitcoin price trends is comparable to that of predicting stock market prices. This work is vulnerable by
hidden features and noise buried in the price data.
   Hushani (6) compared four stock market price movement prediction strategies, including an ARIMA, Vector Auto Regression
(VAR), Long Short Term Memory, and Nonlinear Auto-Regressive with exogenous inputs, in a recent study (NARX). The
NASDAQ closing price was utilised as the basis for the analysis. The findings demonstrated that NARX made accurate short-
term predictions but failed to make long-term predictions. Long-term dependencies can be learned by LSTM networks, giving
them a watchful influence on time series prediction. The authors of (7) used a dynamic LSTM network to forecast Nifty prices
using open, close, low and high as features, and got an RMSE of 0.00859 in terms of daily percentage changes.
   Yang Li (8) introduced a novel method to forecast trading stock movement with deep learning, Gated Recurrent Unit Network
and set of RNN. This combined architecture produces the accuracy of price movement by 33.34% and it improves the rate of
precision is upto 40%. The research uses trading dataset acquired from S&P 500. There are two stages to the blending ensemble
model. Two RNN, one LSTM, and one GRU make up the first level, which is followed by a fully connected NN as the second level.
The time series events in the input data are effectively captured by RNNs, LSTMs, and GRU models, and the fully connected
NN is utilized to joint numerous individual prediction outputs to improve forecasting precision.
   This paper is organized as follows: introductions about the proposed model and detailed literature study are carried out
in section 1. The methodology of the proposed study is discussed in section 3. Section 4 will be a detailed discussion on
experimental results and the conclusion and future work of this study are provided in section 5.

2 Methodology
The proposed architecture used open, close, high and low price levels and volumes to apply LSTM RNN algorithm to predict
price movements for the next trading day. Instead of modelling the data to time series, and decided to use one day ahead indices
data to predict the price trend of the next day to develop an efficient prediction model. The data set can be imported from the
National Stock Exchange (NSE) website through nsepy library for training. TensorFlow and nsepy libraries have used in this
proposed model. The backend for the LSTM model will be TensorFlow, and the historical stock data will be retrieved using
nsepy. The Figure 1 explores the overall process of proposed system.
   The imported libraries can be processed by the RNN algorithm. The algorithm can be trained by it , Cet , ft , ct, o_t, ht. The
formulae for computing each of these entities are as follows, based on the RNN architecture (Figure 2).

                                              it = σ (Wix Xt +Wih ht−1 + bi )                                                (1)

https://www.indjst.org/                                                                                                      475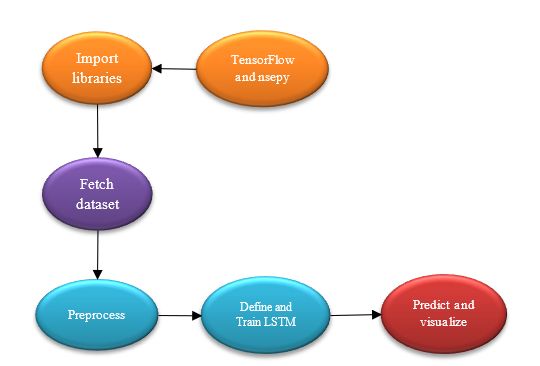
Pandikumar et al. / Indian Journal of Science and Technology 2022;15(11):474–480

                                           Fig 1. Proposed methodology by using LSTM

                                          Cet = σ (W− cxx−t +W− chht−1 + bc )                                               (2)

                                           ft = σ (W− f xxt +W− f hht−1 + b f )                                             (3)

                                                 ct = f _tc_t − 1 + ite
                                                                      ct                                                    (4)

                                         o_t = σ (W _oxx_t +W _ohht−1 + bo )                                                (5)

                                                    ht = ot tanh(ct)                                                        (6)

   The historical SBI stock dataset can then be extracted from the nsepy library and processed using the approach that involves
successively obtaining sets of training dataset, with each batch having a size of [batch size, 1]. Then there will be a measured
output batch for each set of input data. If num_unrollings=3 and batch size=4, for example, a collection of unrolled batches
would look like this:
   Input data: [x0,x10,x20,x30], [x1,x11,x21,x31], [x2,x12,x22,x32] [x0,x10,x20,x30], [x1,x11,x21,x31], [x2,x12,x22,x32]
   Output data: [x1,x11,x21,x31], [x2,x12,x22,x32], [x3,x13,x23,x33] [x1,x11,x21,x31], [x2,x12,x22,x32], [x3,x13,x23,x33]

2.1 Periotic Data Acquisition
You will also not make the output for x tx t to make your model more robust. always x_t+1x_t+1. Instead, you’ll take a random
sample from the set {xt+1.x_t+2, …, xt+Nx_t+1, x_t+2, …, xt+N} where NN is a small window size. In this case, you’re assuming
the following:

https://www.indjst.org/                                                                                                     476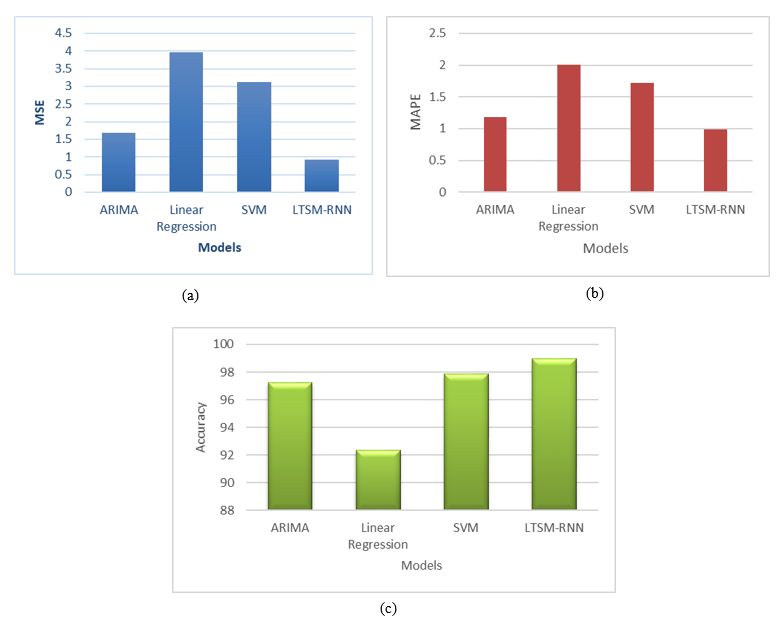
Pandikumar et al. / Indian Journal of Science and Technology 2022;15(11):474–480

                                                  Fig 2. Data flow with RNN

                                                  Fig 3. Data Augmentation

   x_t+1, x_t+2,…, xt+Nx_t+1, x_t+2,…, xt+N they will be close to each other.. Below is a graphic representation of how a
batch of data is created. Move each cursor by one to acquire the next batch of data. (Figure 3 ).
   The proposed method developed and tested through python and windows 10 operating system. The sample coding of the
system is given below (Figure 4). SBI stock data can be tested and visualized.
   The above code can apply to the dataset which taken in the year 2021. Table 1 and Table 2 is the sample data which import
from the NSE website.

3 Result and Discussions
According to the algorithms and experimental result, the suggested method has a prediction accuracy of 98.9 percent, which
is better than previous models. The prediction accuracy of LSTM with RNN is the most fruitful and compared with ARIMA
it has differences of almost 2%. The forecast shows the price movement for the next day with two statuses, indicating whether
it will be upward or downward (Figure 5). If the price movement is downward, the stock price will be negative the next day;
otherwise, the stock price will be positive.

https://www.indjst.org/                                                                                                  477
Pandikumar et al. / Indian Journal of Science and Technology 2022;15(11):474–480
Fig 4. Screenshot of sample code
Table 1. Daily data of SBI stock
Date Open High Low Close Volume
Oct 29, 2021 501.50 512.65 488.40 502.15 31,355,893
Oct 28, 2021 519.60 520.55 497.60 501.35 28,140,401
Oct 27, 2021 513.70 526.85 512.75 519.15 29,463,032
Oct 26, 2021 507.60 518.20 507.60 512.55 21,107,457
Oct 25, 2021 506.50 515.45 497.85 506.50 35,619,415
Oct 22, 2021 504.60 508.70 500.00 502.95 24,080,485
Oct 21, 2021 504.90 506.50 491.75 502.95 20,808,243
Oct 20, 2021 488.80 507.50 483.10 499.90 34,080,545
Oct 19, 2021 500.35 504.20 483.25 488.20 20,645,100
Oct 18, 2021 494.00 501.00 491.70 497.95 20,084,248
Oct 14, 2021 482.00 493.90 482.00 490.60 23,431,826
Oct 13, 2021 486.15 486.15 478.00 481.70 17,638,983
Oct 12, 2021 470.00 484.40 468.10 483.00 33,763,609
Oct 11, 2021 460.00 474.95 458.65 469.25 20,686,981
Oct 08, 2021 461.90 464.00 454.25 458.00 16,521,128
Oct 07, 2021 462.10 464.00 457.10 457.90 9,984,651
Oct 06, 2021 465.00 471.00 453.65 457.20 19,056,690
Oct 05, 2021 462.00 469.00 458.70 464.70 16,487,568
Oct 04, 2021 453.80 464.40 451.60 463.15 16,246,765
Oct 01, 2021 448.50 455.55 443.80 451.65 14,777,309
Table 2. Monthly data of SBI stock
Date Open High Low Close Volume
Dec 01, 2021 464.45 500.45 463.80 481.15 166,429,616
Nov 01, 2021 508.50 542.30 454.30 460.55 482,271,634
Oct 01, 2021 448.50 526.85 443.80 502.15 453,980,329
Sep 01, 2021 427.50 471.90 425.10 453.00 408,763,525
Aug 01, 2021 434.75 467.45 401.25 426.05 619,336,083
Jul 01, 2021 420.30 444.40 417.15 431.80 365,053,983
Jun 01, 2021 426.05 441.95 400.50 419.20 650,335,327
May 01, 2021 349.60 433.65 341.40 424.35 1,295,320,532
Apr 01, 2021 367.70 371.90 321.30 353.50 929,066,645
Mar 01, 2021 395.10 408.90 345.20 364.30 849,338,663
Feb 01, 2021 285.10 427.70 282.75 390.15 1,532,347,646
Jan 01, 2021 274.90 310.90 269.50 282.10 777,947,672
https://www.indjst.org/ 478Pandikumar et al. / Indian Journal of Science and Technology 2022;15(11):474–480
Fig 5. SBI stock price prediction
Table 3. Comparison of prediction methods
Models MSE MAPE Accuracy
ARIMA 1.681 1.187 97.259 %
Linear Regression 3.967 2.012 92.364 %
SVM 3.121 1.719 97.862 %
LTSM-RNN 0.918 0.987 98.957 %
hows the clear picture that LSTM with RNN predicts better accuracy than ARIMA (97.2), Linear regression (92.3), SVM
(97.862). The MSE of the LSTM is 0.98 which is closer to zero compared toARIMA, Linear regression and SVM models which
has 1.6, 3.9 and 3.2 respectively. Likewise, the MAPE of the proposed system is better than the existing researches that are 0.98,
and the MAPE of ARIMA, Linear regression, and SVM are 1.187, 2.012, and 1.719 respectively (Figure Figure 6 a-c).
Fig 6. (a) Comparison of MSE (b) Comparison of MAPE (c) Comparision of Accuracy
https://www.indjst.org/ 479Pandikumar et al. / Indian Journal of Science and Technology 2022;15(11):474–480 The error rate is very minimum that could be very important when the prediction of real-time share prices. The differences in the MSE and MAPE of existing methods from the proposed method are 2.0 and 1.1 respectively. As per the result, the time series analysis with RNN and LSTM produced much better than the existing time series analysis. 4 Conclusion and Future Work This research suggests RNN based LSTM was developed to anticipate future prices for SBI stock the results of the tests show that 98.9 percent prediction accuracy compared to ARIMA and Linear regression-based models and even produced better movement signal than the indicators such as RSI, Bollinger band, and Moving Average. The research used SBI stock historical data taken from NSE (National Stock Exchange) for the past one year (from 1st January to 31st December 2021) to forecast the price movement, particularly the model can track the evolution of opening prices for SBI stock with the addition of movement signal. In the future, the optimum sets of data length and training epochs can be used to enhance the accuracy of intra-day with time frame forecast. References 1) Joosery B, Deepa G. Comparative analysis of time-series forecasting algorithms for stock price prediction. In: Proceedings of the International Conference on Advanced Information Science and System;vol. 33. ACM. 2019;p. 1–6. Available from: https://doi.org/10.1145/3373477.3373699. 2) Harikrishnan H, Urolagin S. Prediction of Stock Market Prices of Using Recurrent Neural Network—Long Short-Term Memory. In: Advances in Machine Learning and Computational Intelligence . Singapore. Springer. 2021;p. 359–368. Available from: https://doi.org/10.1007/978-981-15-5243-4_33. 3) Sirignano J, Cont R. Universal Features of Price Formation in Financial Markets: Perspectives From Deep Learning. SSRN Electronic Journal. 2018. Available from: https://dx.doi.org/10.2139/ssrn.3141294. doi:10.2139/ssrn.3141294. 4) Fischer T, Krauss C. Deep learning with long short-term memory networks for financial market predictions. European Journal of Operational Research. 2018;270(2):654–669. Available from: https://dx.doi.org/10.1016/j.ejor.2017.11.054. 5) Mcnally S, Roche J, Caton S. Predicting the Price of Bitcoin Using Machine Learning. 26th Euromicro International Conference on Parallel, Distributed and Network-based Processing (PDP). 2018;p. 339–382. Available from: https://doi.org/10.1016/j.ejor.2017.11.054. 6) Hushani P. Using Autoregressive Modelling and Machine Learning for Stock Market Prediction and Trading. In: Third International Congress on Information and Communication Technology. Springer. 2019;p. 767–774. Available from: https://doi.org/10.1007/978-981-13-1165-9_70. 7) Nguyen DHD, Tran LP, Nguyen V. Predicting Stock Prices Using Dynamic LSTM Models. Communications in Computer and Information Science. 2019;6:199–212. Available from: https://doi.org/10.1007/978-3-030-32475-9_15. 8) Li Y, Pan Y. A novel ensemble deep learning model for stock prediction based on stock prices and news. International Journal of Data Science and Analytics. 2021;2021. Available from: https://dx.doi.org/10.1007/s41060-021-00279-9. https://www.indjst.org/ 480
You can also read