Indicators and Tools for the Cost of Nutritious Diets - Anna Herforth and William A. Masters 15 June 2019 Tufts ...
←
→
Page content transcription
If your browser does not render page correctly, please read the page content below

Photo: A Herforth, Ghana, 2016

Indicators and Tools for the Cost of Nutritious Diets
Anna Herforth and William A. Masters
15 June 2019

http://sites.tufts.edu/candasa

CANDASA Team (2018-2020)                       IANDA Team (2015-2017)

Tufts Friedman School:                         Tufts Friedman School:
Will Masters, PI                               Anna Herforth, PI
Anna Herforth, Co-Investigator                 Jennifer Coates, PI
Yan Bai, PhD student                           William Masters, Co-Investigator
Kate Schneider, PhD student                    Yan Bai, PhD student
Hallie Perlick, Research Administrator         Zachary Gersten, Research Administrator

IFPRI:                                         University of Ghana:
Derek Headey, Co-PI                            Daniel Sarpong, Research Economist
Kalyani Raghunathan, IFPRI-India               Mary Nana Anima Akrofi, Research Assistant
Fantu Bachewe, IFPRI-Ethiopia
                                               Sokoine University of Agriculture, Tanzania:
University of Ghana:                           Joyce Kinabo, Research Nutritionist
Daniel Sarpong                                 Fulgence Mishili, Research Economist
                                               Hussein Henry Mvungi, Research Assistant
Sokoine University of Agriculture, Tanzania:
Fulgence Mishili                               Johns Hopkins Bloomberg School of Public Health:
                                               Rebecca Heidkamp, Research Nutritionist
Government of Malawi:
Stevier Kaiyatsa
Evolution of new metrics for the cost of nutritious diets
IANDA: Indicators of Affordability of                 CANDASA: Changing Access to Nutritious Diets in Africa                 Publications, uptake, and future
Nutritious Diets in Africa (2015-17)                  and South Asia (2018-2020)                                             work
• Developed several new metrics: Cost of              • Refining and publishing CoNA and CoRD methodologies.                 • Articles include Masters et al. (2018),
  Recommended Diet (CoRD), Cost of                    • Researching the cost of nutrient adequacy and                          “Measuring the Affordability of
  Nutrient Adequacy (CoNA), and others.                 recommended diets in India, Malawi, Ethiopia, Tanzania,                Nutritious Diets in Africa” in Am. J. of
• Conducted a landscape analysis of food                Ghana, Myanmar; also exploring application in other                    Agric. Econ. 100(5):1285-1301.
  price data collection at national and global          countries such as Nigeria and Nepal.                                 • New indicators have been used by the
  levels, interviewing stakeholders in national       • Researching how access to nutritious diets changes based               World Bank, e.g. Dizon and Herforth
  and global institutions to understand their           on shifts over time and space in food prices, wages, and               (2018) “The Cost of Nutritious Food in
  role in collecting and disseminating food             upstream determinants such as infrastructure and GDP.                  South Asia” World Bank Policy
  price information, and how it is used in            • Researching how food prices are associated with diet and               Research Working Paper.
  decision-making.                                      nutritional status, where data are available.                        • We envision providing increased
• Engaged with stakeholders in two                    • Continued contact with Ghana government stakeholders,                  support to governments and global
  countries, Ghana and Tanzania, building               and establishing a group led by the University of Ghana                institutions to use cost of nutritious
  metrics using their existing data and                 Institute for Statistical, Social & Economic Research (ISSER)          diet metrics in routine food price
  exploring integration of metrics into their           to support integrating the new metrics into Ghana food                 monitoring, to shift dialogue and
  food price monitoring systems.                        price monitoring.                                                      focus toward incentivizing availability
                                                                                                                               and access to nutritious diets.

Rationale for this work:
Existing indicators used to measure change over time in the cost of food do not consider its nutritional quality. Global metrics such as the FAO’s Food Price Index
reflect quantities traded on world markets, while each country’s Consumer Price Index reflects quantities currently consumed by its population. Neither reflects
the healthy diets promoted by many policies and programs.

New indicators are needed to track differences in access to nutritious foods at each location, and thereby guide systemic change and other interventions to bring
healthy diets more closely within reach for people at risk of malnutrition. Market price indexes allow us to identify what interventions most effectively improve
affordability of healthy diets, and to measure their impact on nutrition outcomes.

Changing Access to Nutritious Diets in Africa and South Asia (CANDASA) is an $800,000 investment over 2.5 years (December 2017 – June 2020), jointly funded by
the UK Department for International Development and the Bill & Melinda Gates Foundation (BMGF), implemented by the Friedman School of Nutrition at Tufts
University with the International Food Policy Research Institute (IFPRI) and other research partners in India, Bangladesh, Ethiopia, Ghana, Malawi and Tanzania.
CANDASA builds directly on a prior project, Indicators of Affordability of Nutritious Diets in Africa (IANDA) funded by the UK Department for International
Development through an IMMANA grant (2015-2017), and Advancing Research in Agriculture-Nutrition Actions (ARENA) at IFPRI funded by BMGF (2014-2020).

The project’s objective is to answer the following questions:
        1) How do prices and availability of nutritious foods and diets vary over time and space, relative to wages and other earnings?
        2) When and where does investment in rural infrastructure and farming systems improve and stabilize access to healthy diets?
        3) Does the variation we see in price and availability of nutrient-rich foods have significant associations with nutrition outcomes?

Results will inform policies and programs in our target countries, and provide generalizable results to guide nutrition-smart investments elsewhere.
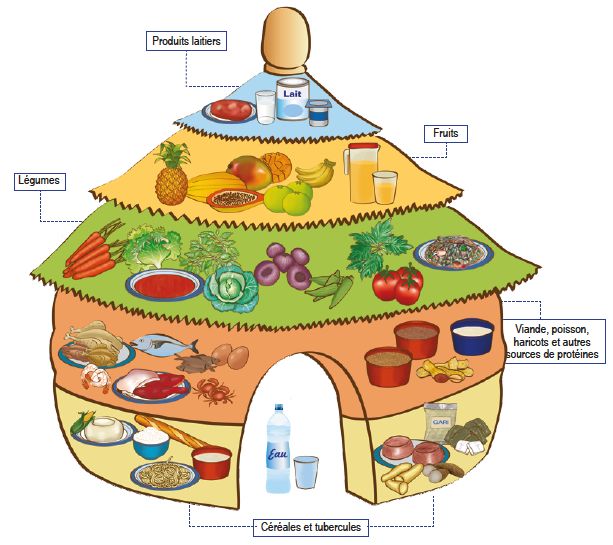
Key Metrics
Cost of Nutrient Adequacy (CoNA)
Purpose: CoNA measures the minimum cost of using locally-available foods to obtain enough of all essential nutrients needed for an active and healthy life. The
measure can be used for advocacy, design and evaluation of interventions, as well as research about the causes and consequences of changing food prices.

Methods: CoNA is calculated with linear programming using data on (1) the price of each locally-available food, (2) its nutrient composition, and (3) nutrient
requirements in terms of both lower and upper limits. Results become valuable only when accurate prices and nutrient composition data are available for the
full range of foods actually used to meet nutrient needs. Calculating least-cost diets with a lower diversity of foods than are actually available or incorrect
composition data will result in unrealistic costs using an infeasible combination of foods. Unrealistic nutrient requirements can also lead to unrealistic results.

Outputs: CoNA shows the minimum cost of achieving minimum nutrient adequacy for a target population (e.g. adult females, not pregnant or lactating), with no
other dietary constraints. It also shows which nutrients are the most constraining, and which foods contribute most to meeting each nutrient requirement.

Cost of Recommended Diet (CoRD)
Purpose: CoRD measures the minimum cost of using locally-available foods to meet dietary
recommendations. Any set of dietary recommendations can be used, provided they specify
quantitative serving recommendations. For policy relevance, we often use food-based dietary
guidelines (such as those pictured, right). These specify the quantity of each food group needed
for both nutrient adequacy and prevention of diet-related non-communicable disease within a
culturally acceptable diet.

Methods: CoRD is calculated by selecting the lowest-cost foods within each group, in sufficient
quantities to meet each recommendation, using data on (1) the price of each locally-available
food, (2) its edible portion and water content, and (3) the target quantity needed to meet
recommendations.                                                                                                Benin Food Guide
Outputs: CoRD measures diet costs for the set of recommendations used. National food-based
dietary guidelines (FBDG) are usually applicable to the general population. Where FBDG exist for
specific sub-populations (e.g. women, men, young children), these sub-population guidelines can
be applied to the analysis.                                                                                                                India Food Guide

Comparison to other metrics
CoNA and CoRD are market-level price indexes designed to monitor the food environment at each place and time. They build on efforts to identify the most
affordable healthy diet for target populations, such as Optifood (which is used to determine the extent to which nutrient requirements for specific target groups
can be met using local foods within existing dietary patterns) and the Cost of the Diet (CotD) approach developed by Save the Children and used in the World
Food Programme’s Fill the Nutrient Gap analysis (described in further detail on the next page). CoNA and CoRD also build on previous studies of food prices that
focus on cost per calorie or for specific food groups, adding factors affecting overall diet costs such as normative guidelines and macronutrient distribution
ranges. All of these cost metrics can be compared to household income and expenditure data, to calculate affordability as a percentage of average income or the
proportion of households that can afford a nutritious diet in each target population.
Summary of metrics of the cost of nutritious diets
                                                  Data required and nutritional
Indicator             Population                  standard to be met                           Results available                        Recommended uses
Cost of               General population; a       • Price per gram of each food                • Cost per day of meeting dietary        Monitoring the food environment at each
Recommended           target population may                                                      recommendations (such as national      marketplace, and regionally and nationally
                      be specified if food-       • Dietary recommendations (e.g.                food-based dietary guidelines)
Diet (CoRD)           based dietary                 national food-based dietary guidelines)                                             Useful to understand whether diets that
                                                                                               • Cost per day of each food group in     follow dietary guidelines are affordable to
(IANDA-               guidelines exist for that   • Quantity of each food category               the recommended diet                   most people, and which food groups are
                      population                    recommended (e.g. 400 grams of fruits
CANDASA                                                                                                                                 the most expensive
                                                    and vegetables per day)                    • Cost per serving of each food group
metric)                                                                                          in the recommended diet                Identifies the lowest-cost foods in each
                                                                                                                                        food group at any given time and place
Cost of               Any target population       • Price per gram of each food                • Cost per day of achieving nutrient     Monitoring the food environment at each
Nutrient              of interest for which                                                      adequacy                               marketplace, and regionally and nationally
                                                  • Nutrient composition of each food, in
                      nutrient requirements
Adequacy              are available (e.g. adult
                                                    terms of energy, protein, fat, nine        • Quantity and cost per day of each      Useful to understand whether diets that
(CoNA)                                              vitamins and seven minerals (Fe, Zn,         food and of each nutrient in the       provide adequate nutrients are affordable
                      women, pregnant
                                                    Ca, Mg, Cu, P, Se), and potentially also     lowest-cost adequate diet              to most people, and which nutrients are
                      women, young
(IANDA-                                             phytate as an antinutrient                                                          most expensive.
                      children)                                                                • Cost per unit of each limiting
CANDASA                                           • Nutrient requirements of the target          nutrient, to show the most costly      Identifies the lowest-cost foods to provide
metric)                                             population, such as estimated average        nutrients                              nutrients at any given time and place
                                                    requirements (EARs), upper limits (ULs)
                                                    and macronutrient ranges

Cost of the           Household of a certain      • Price per gram of each food                • Daily, monthly and/or annual cost of   Fill the Nutrient Gap is a process designed
Diet (CotD)           composition; or any         • Nutrient composition of each food for        achieving nutrient adequacy, aligned   to engage stakeholders in a single or
and Fill the          target population of          energy, protein, fat, nine vitamins and      with usual dietary patterns, by        periodic assessment of the cost of the
                      interest for which                                                         season (optional) for the model        diet, and relevant policy options
Nutrient Gap                                        four minerals (Fe, Zn, Ca, Mg), using
                      nutrient requirements                                                      household and individuals within the
(FNG)                                               embedded food composition table                                                     Useful to model the lowest cost of
                      are available (e.g. adult                                                  household
                                                    (within the CotD software) or custom                                                meeting nutrient needs within a
(Save the             women, pregnant
                                                    data                                       • Quantity and cost per day, week, or    reasonably realistic dietary pattern, and
Children and          women, young
                                                                                                 year of each food selected by the      then show what such a diet would
                      children)                   • EARs for energy, percentage energy
WFP metric)                                         from fat and recommended nutrient
                                                                                                 model                                  resemble for individuals and the
                                                                                                                                        household.
                                                    intakes (RNIs)                             • The amount and percentage of
                                                                                                 energy and nutrients provided by       Useful to identify impact of fortification or
                                                  • Portion sizes for all foods found on the
                                                                                                 each edible portion of food selected   lowering cost of local nutritious foods on
                                                    market using embedded portion size
                                                                                                 by the model, summarized by day,       cost of meeting nutrient requirements.
                                                    database or custom data
                                                                                                 week or year
Acknowledgements:                                                                                                                       A software package is available for the
                                                  • Optional: Typical food habits of the
inputs on this                                                                                 • The percentage of target intakes met   modeling, with embedded data on food
                                                    household or target individuals
section provided by                                                                              for each nutrient by day, week,        composition, nutrient requirements, and
Saskia de Pee,                                    • Typical, average, or ‘model’ household       season or year                         portion sizes. Training is required to use
Janosch Klemm,                                      size and composition of the target area
Giulia Baldi, and
                                                                                                                                        the software.
                                                                                               • Cost attributed to each food group
Amy Deptford                                                                                     per week
Sample Results: Cost of Nutrient Adequacy (CoNA)
Seasonal variation is significantly greater for nutrients (red line) Seasonal rises in the cost of nutrient adequacy are greatest
than for daily energy (blue line) in Tanzania in the southern regions in Tanzania
Source: Bai et al. 2019
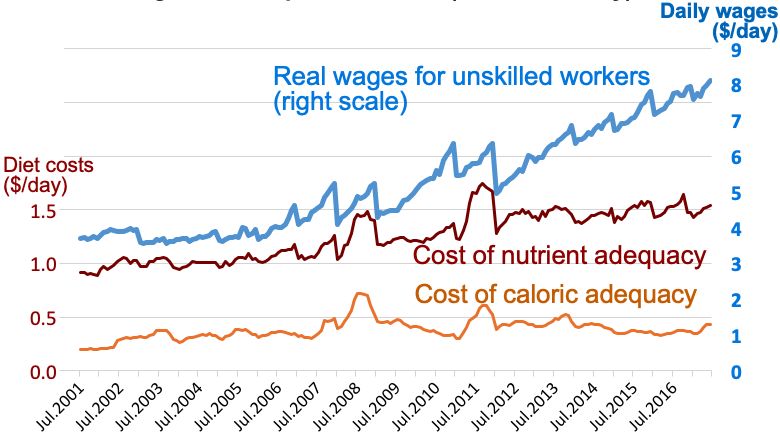
Cost of nutrient adequacy is significantly higher than the cost of caloric adequacy in
Source: Bai et al. 2019
Ethiopia, but both are becoming more affordable as wages rise
This CoNA analysis uses food price data over time and across regions in
Tanzania to show that the cost of nutrient adequacy is much more variable
across seasons than the cost of energy (upper left), and that seasonal rises in
price are greatest in the south (upper right). Further analysis revealed that the
price difference is mainly due to seasonality in fruits and vegetables.
Ongoing analysis in Ethiopia shows that while wages increased in Ethiopia from
2001-2016, the cost of nutrient adequacy remained significantly higher than
the cost of caloric adequacy.
Sources:
• Bai Y et al. (2019), and Bachewe F et al. (2019)
• Presented at IFPRI, Policy Seminar on May 29 2019.
Source: Bachewe et al. 2019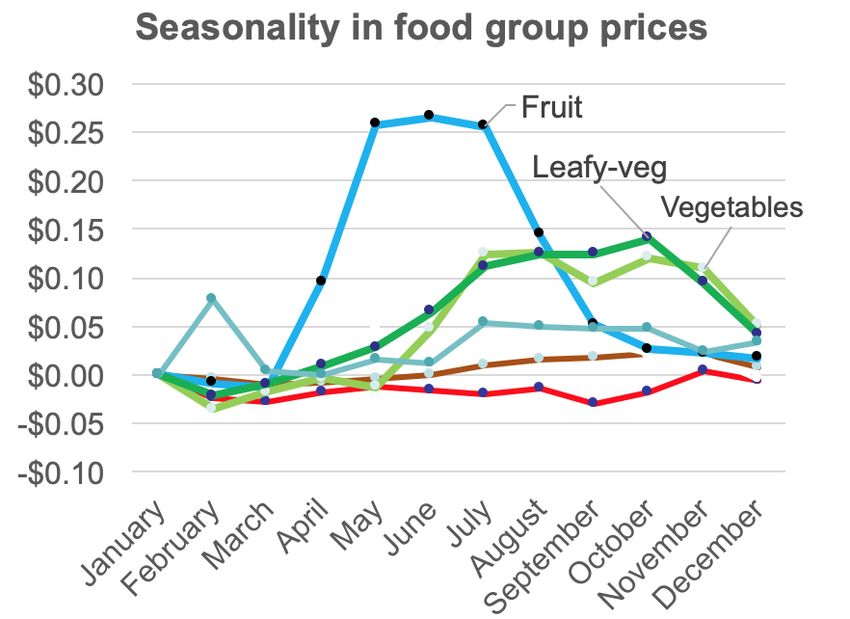
Sample Results: Cost of Recommended Diet (CoRD)
                Trends in the cost of the recommend diet
          as a percent of wages for rural unskilled labor in India              The CoRD analysis in India uses national food-based dietary
                                                                                guidelines that specify a range of servings for each recommended
                                                                                food group separately for women and men, and activity level.

                                                                                These results show that in India for the period covered,
                                                                                recommended diets are highly unaffordable, and using gender-
                                                                                specific recommendations, costs are a larger fraction of unskilled
                                                                                wages for women than for men: 70-80% of women’s wages, and 50-
                                                                                60% of men’s wages.

                                                                                The change over time in cost of recommended diets relative to
                                                                                wages has varied by state. Seasonality in prices is highest for fruits
                                                                                and vegetables.

                                                                                Source: Raghunathan K, Herforth A, & Headey D. 2019.
                                                                                Affordability of nutritious diets in India.
                                                                                Presented at IFPRI, Policy Seminar on May 29 2019.

                                                                                                                                               India Food Guide
   Change in recommended diet affordability across states in India, 2001-2011
Policy Engagement
Since 2016 IANDA/CANDASA has worked with Ghanaian authorities (GSS, MoFA) to help officials use the new price indexes within their routine
food price monitoring.

2016:     IANDA held the first meeting with Ghana                 2017:      MoFA piloted the new
Ministry of Food and Agriculture (MoFA) and Ghana                 expanded food list and decided to
Statistical Service (GSS). We worked with these                   update the food list used for food
national agencies to understand the process of how                price monitoring nationwide. We
food price info is gathered, and reviewed the food                held a workshop to discuss
lists they use for food price monitoring. Together we             interest in monitoring the metrics
determined that MoFA’s list could be updated to                   as national statistics. An analysis
include more nutritious foods that are commonly                   by WFP showed that the
consumed, such as nkontomire, a nutritious dark                   expanded food list gave more
green leafy vegetable (pictured below).                           realistic results in the CotD and
                                                                  Fill the Nutrient Gap analysis.
                                                                  John Nortey from MoFA attended
                                                                  three global meetings (FAO and
                                                                  CFS) to present MoFA’s efforts at
                                                                                                        John Nortey (MoFA) presented Ghana’s leadership in nutrition-sensitive
                                                                  nutrition-sensitive metrics.              metrics to the World Committee on Food Security (CFS) at FAO
                                                                                                                                 headquarters (2017)

                                                                2018: Held a meeting at ANH Academy Week, where GSS and MoFA stated intent to track
                                                                the Cost of Recommended Diets and a nutritious food price index as national statistics.

                               Photo: A Herforth, Ghana, 2016

2019: To help introduce new metrics, an informal “Nutritious Food Prices Analysis Support Group” will be hosted at the University of
Ghana’s Institute for Statistical, Social & Economic Research (ISSER), with the support of CANDASA. This is to allow government statistical
officers to meet regularly with local economists and other stakeholders, before and after release of new data, to discuss the significance
and interpretation of each indicator. Meetings will begin mid-2019.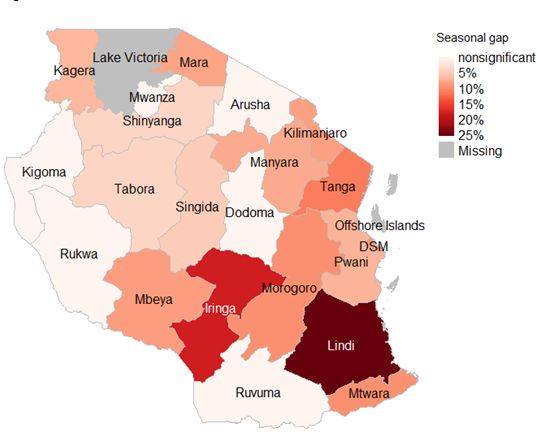
You can also read