Consciousness and Cognition
←
→
Page content transcription
If your browser does not render page correctly, please read the page content below
Consciousness and Cognition 70 (2019) 70–79

                                                           Contents lists available at ScienceDirect

                                                    Consciousness and Cognition
                                             journal homepage: www.elsevier.com/locate/concog

Inducing synesthesia in non-synesthetes: Short-term visual
                                                                                                                                             T
deprivation facilitates auditory-evoked visual percepts
                                                ⁎
Anupama Nair, David Brang
Department of Psychology, University of Michigan, United States

A R T IC LE I N F O                                       ABS TRA CT

Keywords:                                                 Sounds can modulate activity in visual cortex, facilitating the detection of visual targets.
Multisensory                                              However, these sound-driven modulations are not thought to evoke conscious visual percepts in
Synesthesia                                               the general population. In individuals with synesthesia, however, multisensory interactions do
Auditory-visual                                           lead to qualitatively different experiences such as sounds evoking flashes of light. Why, if mul-
Hallucinations
                                                          tisensory interactions are present in all individuals, do only synesthetes experience abnormal
Phosphenes
Imagery
                                                          qualia? Competing models differ in the time required for synesthetic experiences to emerge. The
                                                          cross-activation model suggests synesthesia arises over months or years from the development of
                                                          abnormal neural connections. Here we demonstrate that after ∼5 min of visual deprivation,
                                                          sounds can evoke synesthesia-like percepts (vivid colors and Klüver form-constants) in ∼50% of
                                                          non-synesthetes. These results challenge aspects of the cross-activation model and suggest that
                                                          synesthesia exists as a latent feature in all individuals, manifesting when the balance of activity
                                                          across the senses has been altered.

1. Introduction

    The natural environment contains correlated information from auditory and visual streams (e.g., a speaker’s voice and lip ar-
ticulations are temporally and spatially aligned during speech) (Jack & Thurlow, 1973). The brain capitalizes on this redundancy to
enable faster and more precise sensory processing using a variety of mechanisms. These include direct (monosynaptic) connections
between auditory and visual areas (Falchier et al., 2009; Rockland & Ojima, 2003), in addition to indirect connections through
thalamic, temporal, and parietal areas (for reviews see Ghazanfar & Schroeder, 2006; Stein & Stanford, 2008). The presence of these
pathways affords one sensory system the ability to alter activity in another sensory system. For example, sounds modulate activity in
visual areas, even in the absence of visual stimuli (Campus, Sandini, Morrone, & Gori, 2017; Feng, Störmer, Martinez, McDonald, &
Hillyard, 2014, 2017; Matusz, Retsa, & Murray, 2016; McDonald, Störmer, Martinez, Feng, & Hillyard, 2013; Romei, Murray, Cappe,
& Thut, 2009; Störmer, Feng, Martinez, McDonald, & Hillyard, 2016). Indeed, sound-induced modulations of visual activity can
increase visual cortical excitability, resulting in better detection and discrimination of visual stimuli (Driver & Spence, 2004; Feng,
Störmer, Martinez, McDonald, & Hillyard, 2014; Lu et al., 2009; McDonald et al., 2013; McDonald, Teder-SaÈlejaÈrvi, & Hillyard,
2000; Spence & Driver, 1997) and requiring less magnetic energy to evoke visual phosphenes using transcranial magnetic stimulation
(TMS) (Romei, Gross, & Thut, 2012; Romei et al., 2009; Romei, Murray, Merabet, & Thut, 2007; Spierer, Manuel, Bueti, & Murray,
2013). Although, absent any visual stimulus or external activation of visual cortex, it is generally believed that sounds are insufficient
to evoke conscious visual sensations.
    In individuals with sound-color synesthesia, however, sounds can evoke conscious visual experiences, starting early in life due to

  ⁎
      Corresponding author: Department of Psychology, University of Michigan, 530 Church Street, Ann Arbor, MI 48109, United States.
      E-mail address: djbrang@umich.edu (D. Brang).

https://doi.org/10.1016/j.concog.2019.02.006
Received 26 September 2018; Received in revised form 18 February 2019; Accepted 23 February 2019
1053-8100/ © 2019 Elsevier Inc. All rights reserved.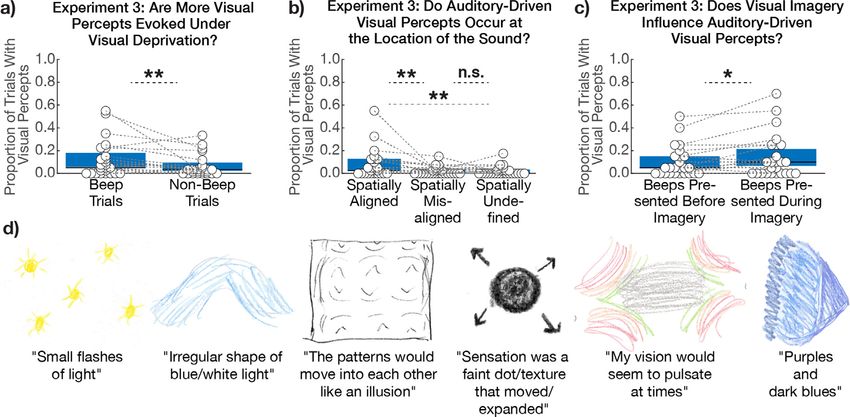
A. Nair and D. Brang                                                                               Consciousness and Cognition 70 (2019) 70–79

genetic propensities (developmental synesthesia) (Asher et al., 2009; Baron-Cohen, Burt, Smith-Laittan, Harrison, & Bolton, 1996;
Brang & Ramachandran, 2011; Tilot et al., 2018). Synesthesia is defined as stimulation of one sensory modality eliciting conscious
experiences in a second sensory modality (Baron-Cohen et al., 1996). Common forms of synesthesia include letters, numbers, or
sounds evoking the experience of colors or basic visual experiences, such as a 400 Hz tone evoking a blue amoeboid shape. Over the
past decade, researchers have sought to understand the relationship between synesthesia and non-synesthetic multisensory inter-
actions, leading to data indicating an overlap in mechanisms between the two (e.g., Bien, ten Oever, Goebel, & Sack, 2012; Brang,
Williams, & Ramachandran, 2012; Ludwig et al., 2011; Mulvenna & Walsh, 2006; Sagiv & Ward, 2006). However, evidence of a
relationship between synesthesia and multisensory interactions has not universally been observed (e.g., Neufeld, Sinke, Zedler,
Emrich, & Szycik, 2012; Sinke et al., 2014; Whittingham, McDonald, & Clifford, 2014).
    If all individuals possess the ability for one sensory system to modulate activity in another, why do only a minority of individuals
experience synesthesia? The cross-activation model reconciles this discrepancy by arguing that synesthesia arises from anatomical
pathways that are either weak or absent in non-synesthetes, providing a direct link through which one sensory modality can stimulate
another modality (Hubbard, Arman, Ramachandran, & Boynton, 2005; Hubbard, Brang, & Ramachandran, 2011; Ramachandran and
Hubbard, 2001a, 2001b, 2003). In support of this model, adult synesthetes show an excess of white matter connectivity (relative to
non-synesthetes) between areas responsible for their synesthetic experiences (e.g., number and color regions in the fusiform gyrus in
grapheme-color synesthesia) (Rouw & Scholte, 2007). This model indicates that synesthesia should require substantial time to de-
velop, arising from either reduced neural pruning in childhood (Maurer, 1993) or the growth of new connections through neural
plasticity (e.g., neural rewiring following blindness) (Armel & Ramachandran, 1999).
    Conversely, the disinhibited-feedback model proposes that everyone possesses the potential to experience synesthesia, mani-
festing only when the balance of activity across the senses has been altered (Grossenbacher & Lovelace, 2001). According to this view,
the anatomical structure of the brains of synesthetes and non-synesthetes is generally similar, but there are differences in how
effectively one sense can evoke activity in a second modality, potentially due to weaker inhibition of feedback projections that
connect the sensory systems (Grossenbacher & Lovelace, 2001). For example, instead of abnormal connections enabling sounds to
evoke conscious visual experiences in synesthetes (as in the cross-activation model), this model argues that these connections are
present in all individuals and that synesthetes have less inhibition restricting how strongly sounds modulate visual activity. This
model is supported by evidence from drug-induced synesthesia, wherein synesthetic-like experiences occur almost immediately after
drug-ingestion, in too short a time period for new neural pathways to be generated (Brang & Ramachandran, 2008; Brogaard, 2013;
Sinke et al., 2012). However, several limitations have led researchers to question whether drug-induced synesthesias are the same as
developmental forms (Luke & Terhune, 2013; Sinke et al., 2012; Terhune et al., 2016). Specifically, there are self-selection biases in
who chooses to take hallucinogenics, questions about the reliability of self-reports during drug-use, as well as the inability to rig-
orously verify and parameterize synesthesia induced by drugs due to ethical concerns. Additional evidence for the disinhibition
model comes from training studies wherein non-synesthetic participants are consciously trained to acquire synesthesia-like experi-
ences (Bor, Rothen, Schwartzman, Clayton, & Seth, 2014; Brang, Kanai, Ramachandran, & Coulson, 2011; Kusnir & Thut, 2012; Meier
& Rothen, 2009).
    The critical test in discriminating between these models is how long it takes for synesthesia to be induced: the cross-activation
model requires changes in anatomical connections that take months or years to develop, whereas the disinhibited-feedback model
requires changes in cortical inhibitory processes that can occur in a matter of minutes. As preliminary support for this latter view, we
have anecdotal reports from non-synesthetic individuals (including one of the authors, DB) that they experience transient synesthesia
while in sensory deprived environments, but not during daily life as developmental synesthetes do. Specifically, these non-synesthetic
individuals report frequently experiencing auditory-visual percepts elicited by unexpected sounds while in dark environments, ty-
pically occurring just before sleep; case studies from individuals with synesthesia and non-synesthetic patients with optic tumors have
similarly reported these percepts (Page, Bolger, & Sanders, 1982; Steen, 2017). If the experience of synesthesia under mild sensory
deprivation is verified experimentally, it would provide strong evidence that synesthesia can be quickly and transiently induced in
non-synesthetes without the use of chemical agents, hypnosis or training, consistent with the disinhibited-feedback model of sy-
nesthesia and arguments that synesthesia exists as a latent feature present in the general population.

2. Experiment 1

    We first examined whether it is possible to evoke auditory-visual synesthesia in non-synesthetes undergoing short-term sensory
deprivation and parameterized the features that maximize the strength of these experiences (Klüver, 1966). Participants were seated
upright in a dark environment with their eyes closed for approximately 30 min throughout the duration of the task. After the first
5 min of dark-adaptation, participants completed an auditorily-presented visual-imagery task (see Methods) while also being pre-
sented with unpredictable sounds from two spatial locations at random, infrequent intervals (once every ∼ 39 s). Participants were
instructed that during the task they might experience visual sensations, such as “flashes of light or complex images”, even though
their eyes are closed, and to respond via button press if they experienced such percepts. In contrast to sensory deprivation studies that
require the absence of auditory and visual stimulation (Ziskind & Augsburg, 1962; Ziskind, Jones, Filante, & Goldberg, 1960), here,
we expected visual experiences to be evoked by the tones.

                                                                   71
A. Nair and D. Brang                                                                                Consciousness and Cognition 70 (2019) 70–79

2.1. Methods

2.1.1. Participants
    Data were collected from 21 fluent English-speaking undergraduate students at the University of Michigan (M = 18.76 years,
SD = 2.2; 13 females; 20 right-handed). Data from eight additional participants were excluded for either failing to follow task
instructions (N = 3) (i.e., they indicated seeing visual percepts during the task but contradicted this claim during the debriefing
interview), missing data (N = 2), or for potentially being synesthetes as assessed during debriefing (N = 3). Power analysis based on
a piloting study (Wilcoxon signed-rank, effect size = 0.7, power = 0.80, alpha = 0.05) indicated a minimum sample size of 19
participants, and additional subjects were recruited to ensure that we would reach this target number after the exclusion of subjects.
No individual subject participated in more than one experiment. Participants in this and subsequent experiments were unaware of the
hypotheses of the study as confirmed through debriefing. Furthermore, they gave informed consent prior to the experiment and were
given course credit for their participation.

2.1.2. Design and procedure
    After undergoing five minutes of dark adaptation, participants completed a visual imagery task described by Thompson, Kosslyn,
Hoffman, and Van Der Kooij (2008). In this task, participants verified whether imagined letters (the uppercase letters A-Z, imagined
in Arial font) possessed specific cued features with simple yes or no responses: e.g., does the letter A have any curves (no), any
enclosed areas (yes, where a triangle is formed at the top of the letter), any diagonal lines (yes), and is it symmetrical along any axis
(yes)?

2.1.2.1. Initial training period. Prior to the start of the main experiment, participants completed a brief training session
lasting ∼ 10 min. To reduce practice effects for the letter stimuli, the training session used abstract characters (see Thompson
et al., 2008) to acclimate participants to the general procedure. Participants were presented with 14 of these characters on a printed
page and were instructed to mark on the page which of the four properties were present in the character. Incorrect responses were
highlighted to participants for discussion. In order to help solidify participants' ability to accurately identify these four stimulus
properties, participants were next presented with the visual image of individual abstract characters and properties via a computer and
instructed to verify whether a single property was present. All 14 abstract stimuli were randomly presented with any 1 of the 4
properties (for a total of 14 trials). Participants received feedback on their performance after each trial. Of note, the abstract stimuli
were only used during training to acclimate participants to the task, whereas the main experiment used the letters A-Z presented via
speakers. The imagery task served to ensure participants remained alert throughout the experiment and to limit the possibility that
visual percepts would be experienced due to sensory deprivation alone, as these are more likely during states of reduced awareness
(Ziskind & Augsburg, 1962; Ziskind et al., 1960). Letters were chosen as primary imagery stimuli in the main experiment to avoid
memories of the correct answer thereby limiting visual imagery during the main task and to maintain consistency in imagined stimuli
across participants.

2.1.2.2. Main Experiment. Following the initial training phase, participants were instructed that they would complete a visual
imagery task in a dark environment, in which they would verify whether auditorily presented letters did or did not have one of the
stimulus properties presented in the training phase. As in Thompson, Kosslyn, Hoffman, & Van der Kooij (Thompson et al., 2008),
participants were first shown a sheet containing uppercase, black letters A-Z in Arial Bold font, and were instructed that imagined
letters during the task should match this set.
    Stimuli were presented using PsychToolbox-3 in MATLAB. To create a visually deprived environment, all light sources were
blocked throughout the main experimental phase. Audio speakers were located 45 degrees to the left and right of participants'
midline (distance of 34 in. from participants). All stimuli were presented through the auditory modality. The task stimuli included
recordings of each of the four probes (“curve”, “close”, “diag”, “sym”) and 26 letters (A-Z).
    Prior to the start of the experiment, participants were instructed to maintain a steady posture and to keep their eyes closed
throughout the experiment. On each trial, participants were auditorily presented with a property followed by a letter (e.g., “diag F”)
and instructed to indicate, via a button press (Cedrus Response Box model RB-834), whether the property was present for that letter.
All four properties were presented with each of the 26 letters in random order, for a total of 104 trials. 5.5 s elapsed between each
response and the initiation of the subsequent trial. On 25% of trials, a beep (10 kHz sine wave, 10 ms in duration) was presented
250–750 ms (random uniform distribution) after the presentation of the property-letter pairs from either the left or right speaker
(50% of trials each); stimulus volume was not measured in Experiment 1. Participants were informed that beeps may occur randomly
throughout the study but could be ignored since they were not task-relevant. The experimenter remained present in the room for the
first four trials to ensure participants understood the task instructions; these trials were removed from all analyses. Following these
initial trials, participants experienced a 5-minute long dark-adaptation period before the continuation of the task, lasting approxi-
mately 30 min in total.
    Participants were instructed that being in a dark environment causes some individuals to experience visual sensations, such as
“flashes of light or complex images”, even though their eyes are closed; no additional descriptions or examples of visual sensations
were given. If at any point a subject experienced a visual sensation, they were instructed to press a designated key on the response
box; when no visual sensation was perceived, no additional response was required. Following the main experiment, participants
completed a debriefing form relating to visual percepts experienced during the experiment, as well as the Vividness of Visual Imagery
Questionnaire (VVIQ) (Marks, 1973) to assess their imagery levels. However, VVIQ responses were not analyzed, and the measure

                                                                   72
A. Nair and D. Brang Consciousness and Cognition 70 (2019) 70–79
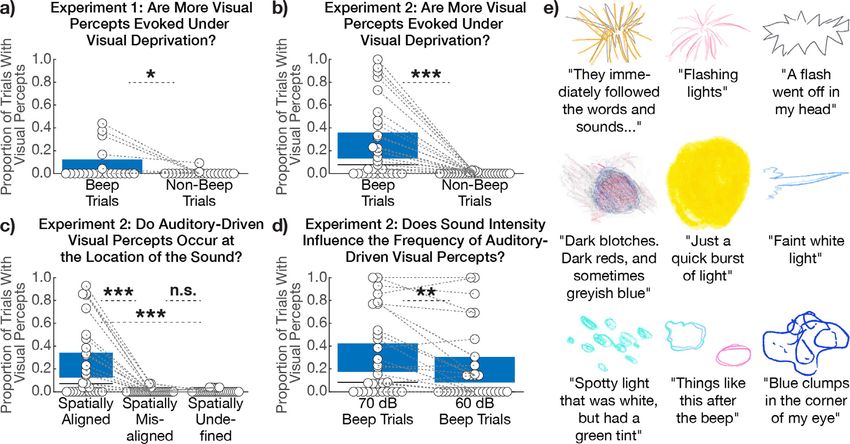
Fig. 1. Results from Experiments 1 and 2. (a–d) Proportion of trials with visual percepts across each of the conditions. (a and b) Participants
demonstrated significantly more visual percepts in response to beep trials compared to non-beep trials, (c) auditory-driven visual percepts were
significantly more likely to occur at the spatial location of the sound, and (d) auditory-driven visual percepts were significantly more likely to occur
following a loud sound than following a soft sound. (e) Representative depictions of the auditory-driven visual percepts that nine participants drew
during the debriefing, along with their corresponding descriptions. Depictions are consistent with Klüver form constants. 95% confidence intervals
indicated by blue boxes, individual subject responses by circles, dotted-lines reflect paired data points, and median responses by horizontal dark
bars. *p < .05, **p < .01, ***p < .001. (For interpretation of the references to color in this figure legend, the reader is referred to the web version
of this article.)
was omitted from Experiments 2 and 3.
2.1.3. Data analysis
Data were analyzed using SPSS 23. The main effect of interest was the frequency of reported visual sensations on trials with versus
without beeps. Responses denoting the experience of a visual sensation showed non-normality according to Shapiro-Wilk and
Kolmogorov-Smirnov tests, necessitating the use of the Wilcoxon signed-rank tests across all comparisons. We additionally conducted
parametric statistics on these data, which revealed the same pattern of results. To remove background noise from drawn images on
debriefing forms, the images displayed in Fig. 1E were vectorized.
2.2. Results
Imagery task accuracy was near ceiling (M = 0.918, SD = 0.046), confirming that participants remained alert. Throughout the
session, 24% of participants reported visual percepts via a button press, and the presence of auditory-driven visual percepts was
confirmed during debriefing (one subject reported auditory-driven visual percepts during the debriefing even though they failed to
respond during the task). To examine the role of sounds in evoking visual percepts, we examined the frequency of visual responses
during trials with beeps versus trials without beeps. Participants demonstrated a significantly higher frequency of visual percepts on
beep trials (Z = 1.992, p = .046, r = 0.307; Fig. 1A), consistent with our suggestion that startling tones presented in the context of
mild visual deprivation can lead to auditory-visual percepts.
We additionally examined whether the frequency of these experiences varied throughout the experiment to clarify additional
elements of this phenomenon. If the system needs time to adapt to the visual deprivation for these experiences to arise, we would
predict a higher frequency of synesthetic experiences in the latter half of the experiment. Alternatively, if these experiences arise not
through chronic visual deprivation, but instead through any transient reduction in visual competition (e.g., these multisensory
processes are always present but normally have little influence when the eyes are open), then we should see an even distribution of
synesthetic experiences throughout the experiment. Subjective reports from individuals who experience these percepts in natural
settings indicate that they may occur within minutes of eye closure, suggestive of this latter viewpoint. Consistent with these reports,
we found no differences in the frequency of these percepts between the first and second half of the experiment (Z = 0.085, p = .932,
r = 0.013).
73A. Nair and D. Brang Consciousness and Cognition 70 (2019) 70–79
3. Experiment 2
As research on auditory-visual interactions indicates that multisensory receptive fields are spatially co-registered (Romei et al.,
2009; Störmer et al., 2016), Experiment 2 examined whether lateralized sounds evoke spatially coincident visual percepts (e.g., a
right lateralized sound evoking a hallucination in the right visual field). We matched the general design to Experiment 1, with two
differences. First, on trials in which participants experienced a hallucination, they indicated the spatial position of the experience via
a button press. Second, we included both loud (70 dB) and 50% quieter (60 dB) sounds to evaluate the role of stimulus intensity on
hallucination frequency.
3.1. Methods
3.1.1. Participants
Data were collected from 31 fluent English-speaking undergraduate students at the University of Michigan (M = 18.58 years,
SD = 0.72; 11 females; 28 right-handed), none of whom participated in Experiment 1. Data from eight additional participants were
excluded for failing to follow task instructions (N = 5) or for potentially being synesthetes (N = 3). Power analysis based on the
average effect sizes of a piloting study and Experiment 1 (Wilcoxon signed-rank, effect size = 0.57, power = 0.80, alpha = 0.05)
indicated a minimum sample size of 28 participants, and additional subjects were recruited to ensure that we would reach this target
number after the exclusion of subjects. Participants gave informed consent prior to the experiment and were given course credit for
their participation.
3.1.2. Design and procedure
The materials, stimuli, setup, and procedure in Experiment 2 were matched to those of Experiment 1, with two important dif-
ferences. First, beeps were presented at two intensity levels: 60 dB (“soft” beeps) and 70 dB (“loud” beeps) estimated from the
position of participants' ears. To equate the number of loud and soft beep trials with left and right speaker presentations, the number
of beep trials was increased to 28 out of 104 trials (7 trials in each condition), from 26 out of 104 trials in Experiment 1. The second
important difference from Experiment 1 was the instruction for participants to report the spatial position of any visual experience,
such that they would press a designated left key for a left lateralized sensation, a designated right key for a right lateralized sensation,
and both keys for any non-lateralized sensation.
3.1.3. Data analysis
Responses denoting the experience of a visual sensation showed non-normality according to Shapiro-Wilk and Kolmogorov-
Smirnov tests, necessitating the use of the Wilcoxon signed-rank tests across all comparisons. We additionally conducted parametric
statistics on these data, which revealed the same pattern of results. To remove background noise from drawn images on debriefing
forms, the images displayed in Fig. 1E were vectorized.
3.2. Results
As in Experiment 1, imagery task accuracy was near ceiling (M = 0.926, SD = 0.030), confirming that participants remained
alert. Throughout the session, 68% of participants reported visual percepts via button presses and the presence of auditory-driven
visual percepts was confirmed during debriefing. Examining the role of sounds in evoking visual percepts replicated our main finding
from Experiment 1: there were significantly more visual percepts reported on beep trials than on non-beep trials (Z = 3.945,
p < 0.001, r = 0.501; Fig. 1B). Furthermore, consistent with our prediction of auditory-visual spatial congruity effects, visual
percepts were reported at the location of the sound significantly more often than at the location in the opposite spatial field
(Z = 3.790, p < .001, r = 0.481) or at non-lateralized locations (Z = 3.823, p < .001, r = 0.486) (Fig. 1C). Consistent with a model
in which greater sound intensity elicits stronger modulation of visual responses, we found that sound volume significantly increased
the frequency of auditory-evoked visual percepts (Z = 2.960, p = .003, r = 0.376; Fig. 1D). Finally, as in Experiment 1, we found no
differences in the frequency of these percepts between the first and second half of the experiment (Z = 0.070, p = .944, r = 0.009).
4. Experiment 3
Experiment 2 demonstrated that the frequency of these synesthetic experiences is modulated by the intensity of the sounds, and
that the visual percepts tend to be localized to the spatial position of the sound. A remaining question was whether the use of a visual
imagery task was facilitating the induction of these auditory-driven visual percepts. Indeed, research indicates that visual imagery is
sufficient to activate visual cortex leading to increased visual cortical excitability (Sparing et al., 2002), potentially lowering the
threshold to evoke synesthetic experiences. Experiment 3 served to examine the role of visual imagery in the generation of these
auditory-driven visual percepts. The general design was matched to Experiment 2, with two main differences. (1) All sounds were
presented at 70 dB, as those sounds were the most effective at evoking visual sensations in Experiment 2. (2) Half of the sounds were
presented before the onset of the word cue (before the imagery task) and half after the offset of the word cue (during the imagery
task), as in the other experiments.
74A. Nair and D. Brang Consciousness and Cognition 70 (2019) 70–79
4.1. Methods
4.1.1. Participants
Data were collected from 25 fluent English-speaking undergraduate students at the University of Michigan (M = 18.68 years,
SD = 0.69; 12 females; 23 right-handed), none of who participated in Experiments 1 or 2. Data from five additional participants were
excluded for failing to follow task instructions (N = 3) or for potentially being synesthetes (N = 2). Power analysis based on the
average effect sizes of a piloting study and Experiments 1 and 2 (Wilcoxon signed-rank test, effect size = 0.63, power = 0.80,
alpha = 0.05) indicated a minimum sample size of 23 participants, and additional subjects were recruited to ensure that we would
reach this target number after the exclusion of subjects. Participants gave informed consent prior to the experiment and were given
course credit for their participation.
4.1.2. Design and procedure
The materials, stimuli, setup, and procedure in Experiment 3 were matched to those of Experiment 2, except where noted. First,
we included only the higher of the two intensity levels used in Experiment 2 (70 dB), as estimated from the position of participants'
ears. Second, we used headphones rather than free-field speakers. This allowed us to investigate whether the effects could be ob-
served across differing experimental setups. Third, beep trials were presented either 250–750 ms (random uniform distribution)
before or 250–750 ms (random uniform distribution) after the presentation of the property-letter pairs from either the left or the right
headphone (50% of trials each). Specifically, the task-irrelevant sounds presented before the onset of the word-cues would occur
before subjects started imagining the shape of the letters to complete the property verification task.
4.1.3. Data analysis
Responses denoting the experience of a visual sensation showed non-normality according to Shapiro-Wilk and Kolmogorov-
Smirnov tests, necessitating the use of the Wilcoxon signed-rank tests across all comparisons. We additionally conducted parametric
statistics on these data, which revealed the same pattern of results. To remove background noise from drawn images on debriefing
forms, the images displayed in Fig. 2D were vectorized.
4.2. Results
As in Experiments 1 and 2, imagery task accuracy was near ceiling (M = 0.926, SD = 0.029), confirming that participants re-
mained alert. Throughout the session, 72% of participants reported visual percepts via button presses and the presence of auditory-
driven visual percepts was confirmed during debriefing. Examining the role of sounds in evoking visual percepts replicated the
findings of Experiments 1 and 2, with significantly more visual percepts reported on beep trials than non-beep trials (Z = 2.591,
Fig. 2. Results from Experiment 3. (a–c) Proportion of trials with visual percepts across each of the conditions. (a) Participants demonstrated
significantly more visual percepts in response to beep trials compared to non-beep trials, (b) auditory-driven visual percepts were significantly more
likely to occur at the spatial location of the sound, and (c) auditory-driven visual percepts were significantly more likely to occur during visual
imagery than before the visual imagery task. (d) Representative depictions of auditory-driven visual percepts drawn by six participants during the
debriefing, along with their corresponding descriptions. As in Fig. 1, depictions are consistent with Klüver form constants. 95% confidence intervals
indicated by blue boxes, individual subject responses by circles, dotted-lines reflect paired data points, and median responses by horizontal dark
bars. *p < .05, **p < .01. (For interpretation of the references to color in this figure legend, the reader is referred to the web version of this article.)
75A. Nair and D. Brang Consciousness and Cognition 70 (2019) 70–79
p = 0.010, r = 0.367; Fig. 2A). Additionally, the location of synesthetic percepts occurred more often at the location of the sound
than either the opposite spatial field (Z = 3.063, p = .002, r = 0.433) or in non-lateralized locations (Z = 2.738, p = .006, r = 0.387)
(Fig. 2B). Finally, consistent with a model in which visual imagery enables stronger modulation of visual responses, we found that
sounds presented during the visual imagery phase of a trial (immediately after the offset of word cues) evoked a greater number of
auditory-evoked visual percepts than sounds presented before the imagery phase (Z = 2.099, p = .036, r = 0.300; Fig. 2C). As in
Experiments 1 and 2, we found no differences in the frequency of these synesthetic percepts between the first and second half of the
experiment (Z = 0.619, p = .536, r = 0.088).
Across all three experiments, participants completed a debriefing questionnaire to obtain subjective reports of visual experiences
that occurred during the 30-minute task-period. In line with the behavioral responses, 44/77 participants (57.1%) reported auditory-
driven visual percepts (Figs. 1E and 2D), with the frequency of experiences ranging from 1 to 28 synesthetic percepts.
5. Discussion
These findings reveal a fundamental relationship between visual deprivation and the ability to induce synesthetic percepts in non-
synesthetic individuals. Across three experiments, we reliably evoked auditory-visual percepts in 57.1% of non-synesthetic in-
dividuals using a simple paradigm that requires as little as five minutes of visual deprivation. Examining the features that modulated
these experiences, we identified higher prevalence in response to louder sounds (compared to softer sounds) and to sounds occurring
during high visual imagery periods. Furthermore, visual sensations were largely spatially co-registered with the location of the sound,
which is consistent with research on more common multisensory interactions (McDonald et al., 2013; Stein & Stanford, 2008; Störmer
et al., 2016).
Descriptions and drawings (Figs. 1E and 2D) were indicative of Klüver form-constants (Klüver, 1966), including colorful small
circles, amorphous blobs, scintillation, extrusion, and movement, consistent with prior studies on visual experiences induced using
drugs (Sinke et al., 2012) or TMS (Romei et al., 2009). Indeed, visual deprivation as demonstrated here may enhance visual-cortical
excitability in a manner similar to TMS (Romei et al., 2009), allowing auditory-driven visual percepts to breach conscious awareness.
A previous case-report in a developmental synesthete likened these experiences to hypnagogic hallucinations, which occur during the
transition from wakefulness to sleep (Steen, 2017). However, as demonstrated by our imagery paradigm, participants remained alert
throughout the session. We suggest instead that simply removing externally driven visual information is sufficient to allow sounds to
periodically evoke visual qualia, potentially through phase-resetting of intrinsic neural oscillations (Feng, Störmer, Martinez,
McDonald, & Hillyard, 2017; Romei et al., 2009; Störmer et al., 2016). Future research will need to examine these processes using
EEG to confirm this speculation.
The quick onset and transient nature of these experiences are incompatible with the standard cross-activation model. In this view,
synesthesia is proposed to develop over an extended period of time resulting from excessive anatomical connectivity between sensory
modalities, through either reduced pruning during development or the growth of new connections through neural plasticity (e.g.,
retinal blindness leading to auditory-visual synesthesia) (Armel & Ramachandran, 1999). In contrast, the present data are more
consistent with the disinhibited-feedback model, which is flexible in terms of how quickly synesthesia can onset and offset. Speci-
fically, this latter model proposes that synesthesia emerges when the balance of activity across the senses has been altered to allow
one sensory modality the ability to exert stronger modulatory effects onto another sensory modality. While the present data de-
monstrate that auditory-visual synesthesia (Armel & Ramachandran, 1999) can be induced without changes in anatomical con-
nectivity, it is possible that synesthesia may emerge from several different mechanisms that enable one sensory system to exert
stronger modulatory control over another sensory system. This combined view indicates that auditory-visual synesthesia emerges
following a sufficient increase in the gain of the auditory-to-visual signal, in response to an increased density of anatomical con-
nections or reduced functional inhibition of feedback pathways that connect the sensory systems. Indeed, this model would predict
that louder sounds should increase the frequency of auditory-visual percepts, which was confirmed in Experiment 2. Absent any
changes in the strength of the auditory signal that arrives in visual cortex, auditory-visual synesthesia would also be facilitated by
changes in visual cortex alone. Specifically, removing competing visual information through sensory deprivation (Mason & Brady,
2009) or increasing visual-cortical excitability (Terhune, Tai, Cowey, Popescu, & Kadosh, 2011) may increase the relative gain of
typically weak auditory-visual modulation to allow sounds to more easily evoke perceptual visual qualia. This sensory-gain model
suggests that while a variety of mechanisms can lead to synesthesia, what matters is the net effect of sounds on visual cortical activity.
The occurrence of the visual percepts at the spatial location of the sound is consistent with research on more general multisensory
interactions. Specifically, research indicates that sounds more strongly modulate activity in spatiotopically-aligned areas of visual
cortex than in non-spatially aligned areas (McDonald et al., 2013; Romei et al., 2009; Störmer et al., 2016). Indeed, this overlap in the
spatial receptive fields for auditory and visual signals even occurs at the level of individual neurons (Stein & Stanford, 2008).
Furthermore, more recent research suggests that visual maps of auditory space are enhanced during auditory-spatial but not auditory-
temporal tasks (Campus et al., 2017). Despite these robust effects, a small subset of auditory-driven visual percepts was described by
participants as being experienced as full-field visual flashes of light, which may have been due to trials with particularly strong
activation of the auditory-visual pathway.
Experiment 3 confirmed that visual imagery is a modulatory factor in the experience of auditory-visual percepts. Specifically, we
found that sounds presented during the visual imagery phase of a trial (immediately after the offset of word cues) evoked a greater
number of auditory-evoked visual percepts than sounds presented before the imagery phase. Several neuroimaging studies have
identified areas in early visual cortex that are common to the experience of visual perception and imagery (Ganis, Thompson, &
Kosslyn, 2004), thereby suggesting that visual imagery recruits the same areas that are involved in visual perception. Critically,
76A. Nair and D. Brang Consciousness and Cognition 70 (2019) 70–79
research has also demonstrated that visual imagery increases cortical excitability (Sparing et al., 2002), suggesting that visual
imagery and visual deprivation may use similar mechanisms to facilitate auditory-driven visual percepts.
Superficially, the experiences reported here share many commonalities with drug-induced synesthesias (Luke & Terhune, 2013;
Terhune et al., 2016), such that they are transient in nature, evoke visual sensations consistent with Klüver form constants, and
exhibit variability in the experiences over time (e.g., for a single individual, the same tone could evoke different colors on subsequent
trials). An important requirement in relating research on acquired synesthesias to the developmental form is that these experiences
reflect the same phenomenon that is induced though different means. While the present phenomenon meets the primary qualification
of synesthesia (one sensory modality evoking conscious experiences in an additional modality), future research is needed to un-
derstand how many of the secondary dimensions common to developmental synesthesia are present in sensory deprived synesthesia,
and indeed, which of these are critical to (as opposed to the result of having) the experience of synesthesia. For example, in de-
velopmental synesthesia, synesthetic associations are generally consistent (e.g., if a synesthete's A is red, it will always evoke the color
red even decades later; Eagleman, Kagan, Nelson, Sagaram, & Sarma, 2007; Witthoft & Winawer, 2006; Witthoft, Winawer, &
Eagleman, 2015), and consistency has been taken as a hallmark trait of developmental synesthesia. However, while synesthesia is
generally consistent in young adults, mounting evidence suggests that it takes several years during development for a reliable
mapping of synesthetic experiences to occur. Specifically, longitudinal tracking has shown that synesthetic associations tend to be
non-fixed at age 6, with only 71% of synesthetic associations becoming consistent by age 11 (Simner & Bain, 2013; Simner, Harrold,
Creed, Monro, & Foulkes, 2009). Furthermore, consistency actually declines later in life as synesthetic colors lose their saturation
(Simner, Ipser, Smees, & Alvarez, 2017) and undergo shifts in the color spectrum (Meier, Rothen, & Walter, 2014). In line with these
data, it is our view that inducer-concurrent consistency in all forms of synesthesia may occur as the result of having these experiences
for several years as opposed to being an intrinsic feature required for the experience of synesthesia. Indeed, while the experiences
reported here do not appear to be highly consistent within the short testing session, we predict that consistency of the auditory-visual
experiences would develop over time with repeated exposure. Indeed, non-synesthetes who were trained extensively on grapheme-
color pairs acquired the consistent subjective experience of synesthesia as well as neurophysiological markers of the condition
(Rothen, Schwartzman, Bor, & Seth, 2018).
Sensory deprivation synesthesia has typically been studied in patients who have chronic visual loss (due to damage to the eyes or
optic pathway) lasting months or years (Armel & Ramachandran, 1999). The present studies extend the class of sensory deprivation
synesthesia, demonstrating that these effects can occur within minutes of visual loss. Indeed, Jacobs, Karpik, Bozian, and Gøthgen
(1981) provided clinical observations of nine patients with acquired auditory-visual synesthesia resulting from lesions of the optic
nerve or chiasm, and reported that synesthesia was experienced between one and three days following visual loss in the majority of
the patients.
One potential concern about the present design is that participants' reports could have been biased by either expectations about
what they would see while in a dark room for extended periods of time or during the debriefing after we asked whether they had any
visual experiences. The systematicity of the observed data provides evidence against the bias explanation. Specifically, the frequency
of these experiences varies systematically along several dimensions: louder sounds and sounds occurring during (but not before)
periods of intense visual imagery evoke a greater frequency of synesthetic experiences, and visual sensations are co-localized with the
spatial position of the sound. Additionally, the variability and detail of the descriptions generated by participants match extremely
well with those of form-constants (Klüver, 1966), and were devoid of more complex hallucinations or descriptions of visualized
letters (the stimuli used in the imagery task). Subjects reported high confidence in the qualitative strength of these experiences, with
some participants believing they had seen real visual stimuli projected out into the world.
Several open questions remain about this phenomenon including the startling nature of sounds in generating these experiences,
the consistency of these experiences over time, individual differences in the experience of these sensations, and the frequency of these
percepts in individuals with developmental synesthesia. Indeed, during debriefing several participants reported that they experienced
synesthetic percepts in response to spoken words during the experiment (the auditory properties and letters) in addition to the tones,
showing the generalizability of the phenomenon. In general, these data indicate that synesthesia can be induced after only minutes of
visual deprivation, too short a period for the cross-activation model to account for, and more consistent with disinhibited-feedback
models. Collectively, these results demonstrate that mild visual deprivation facilitates auditory-visual percepts, indicating a higher
prevalence of synesthesia-like experiences in the general population and a novel method to study both the relationship between
synesthesia and normal multisensory processes and the experience of visual hallucinations in clinical populations.
Acknowledgements
This study was supported by NIH Grant R00 DC013828. We are grateful to Daniel Weissman for his comments on an earlier
version of this manuscript.
References
Armel, K. C., & Ramachandran, V. S. (1999). Acquired synesthesia in retinitis pigmentosa. Neurocase, 5(4), 293–296.
Asher, J. E., Lamb, J. A., Brocklebank, D., Cazier, J.-B., Maestrini, E., Addis, L., ... Monaco, A. P. (2009). A whole-genome scan and fine-mapping linkage study of
auditory-visual synesthesia reveals evidence of linkage to chromosomes 2q24, 5q33, 6p12, and 12p12. The American Journal of Human Genetics, 84(2), 279–285.
Baron-Cohen, S., Burt, L., Smith-Laittan, F., Harrison, J., & Bolton, P. (1996). Synaesthesia: Prevalence and familiality. Perception, 25(9), 1073–1079.
Bien, N., ten Oever, S., Goebel, R., & Sack, A. T. (2012). The sound of size: Crossmodal binding in pitch-size synesthesia: A combined TMS, EEG and psychophysics
study. NeuroImage, 59(1), 663–672.
77A. Nair and D. Brang Consciousness and Cognition 70 (2019) 70–79
Bor, D., Rothen, N., Schwartzman, D. J., Clayton, S., & Seth, A. K. (2014). Adults can be trained to acquire synesthetic experiences. Scientific Reports, 4, 7089.
Brang, D., Kanai, S., Ramachandran, V. S., & Coulson, S. (2011). Contextual priming in grapheme–color synesthetes and yoked controls: 400 msec in the life of a
synesthete. Journal of Cognitive Neuroscience, 23(7), 1681–1696.
Brang, D., & Ramachandran, V. S. (2008). Psychopharmacology of synesthesia; the role of serotonin S2a receptor activation. Medical Hypotheses, 70(4), 903–904.
Brang, D., & Ramachandran, V. S. (2011). Survival of the synesthesia gene: Why do people hear colors and taste words? PLoS Biology, 9(11) e1001205.
Brang, D., Williams, L. E., & Ramachandran, V. S. (2012). Grapheme-color synesthetes show enhanced crossmodal processing between auditory and visual modalities.
Cortex, 48(5), 630–637.
Brogaard, B. (2013). Serotonergic hyperactivity as a potential factor in developmental, acquired and drug-induced synesthesia. Frontiers in Human Neuroscience, 7, 657.
Campus, C., Sandini, G., Morrone, M. C., & Gori, M. (2017). Spatial localization of sound elicits early responses from occipital visual cortex in humans. Scientific
Reports, 7(1), 10415.
Driver, J., & Spence, C. (2004). Crossmodal spatial attention: Evidence from human performance. Crossmodal space and crossmodal attention, 179–220.
Eagleman, D. M., Kagan, A. D., Nelson, S. S., Sagaram, D., & Sarma, A. K. (2007). A standardized test battery for the study of synesthesia. Journal of Neuroscience
Methods, 159(1), 139–145.
Falchier, A., Schroeder, C. E., Hackett, T. A., Lakatos, P., Nascimento-Silva, S., Ulbert, I., ... Smiley, J. F. (2009). Projection from visual areas V2 and prostriata to
caudal auditory cortex in the monkey. Cerebral Cortex, 20(7), 1529–1538.
Feng, W., Störmer, V. S., Martinez, A., McDonald, J. J., & Hillyard, S. A. (2014). Sounds activate visual cortex and improve visual discrimination. Journal of
Neuroscience, 34(29), 9817–9824.
Feng, W., Störmer, V. S., Martinez, A., McDonald, J. J., & Hillyard, S. A. (2017). Involuntary orienting of attention to a sound desynchronizes the occipital alpha
rhythm and improves visual perception. Neuroimage, 150, 318–328.
Ganis, G., Thompson, W. L., & Kosslyn, S. M. (2004). Brain areas underlying visual mental imagery and visual perception: An fMRI study. Cognitive Brain Research,
20(2), 226–241.
Ghazanfar, A. A., & Schroeder, C. E. (2006). Is neocortex essentially multisensory? Trends in Cognitive Sciences, 10(6), 278–285.
Grossenbacher, P. G., & Lovelace, C. T. (2001). Mechanisms of synesthesia: Cognitive and physiological constraints. Trends in Cognitive Sciences, 5(1), 36–41.
Hubbard, E. M., Arman, A. C., Ramachandran, V. S., & Boynton, G. M. (2005). Individual differences among grapheme-color synesthetes: Brain-behavior correlations.
Neuron, 45(6), 975–985.
Hubbard, E. M., Brang, D., & Ramachandran, V. S. (2011). The cross-activation theory at 10. Journal of Neuropsychology, 5(2), 152–177.
Jack, C. E., & Thurlow, W. R. (1973). Effects of degree of visual association and angle of displacement on the “ventriloquism” effect. Perceptual and Motor Skills.
Jacobs, L., Karpik, A., Bozian, D., & Gøthgen, S. (1981). Auditory-visual synesthesia sound-induced photisms. Archives of Neurology, 38(4), 211–216.
Klüver, H. (1966). Mescal, and mechanisms of hallucinations. [Chicago]: University of Chicago Press.
Kusnir, F., & Thut, G. (2012). Formation of automatic letter–colour associations in non-synaesthetes through likelihood manipulation of letter–colour pairings.
Neuropsychologia, 50(14), 3641–3652.
Lu, Z.-L., Tse, H. C.-H., Dosher, B. A., Lesmes, L. A., Posner, C., & Chu, W. (2009). Intra-and cross-modal cuing of spatial attention: Time courses and mechanisms.
Vision Research, 49(10), 1081–1096.
Ludwig, J., Sanbonmatsu, L., Gennetian, L., Adam, E., Duncan, G. J., Katz, L. F., ... Whitaker, R. C. (2011). Neighborhoods, obesity, and diabetes—a randomized social
experiment. New England Journal of Medicine, 365(16), 1509–1519.
Luke, D. P., & Terhune, D. B. (2013). The induction of synaesthesia with chemical agents: a systematic review. Frontiers in Psychology, 4.
Marks, D. F. (1973). Visual imagery differences in the recall of pictures. British journal of Psychology, 64(1), 17–24.
Mason, O. J., & Brady, F. (2009). The psychotomimetic effects of short-term sensory deprivation. The Journal of Nervous and Mental Disease, 197(10), 783–785.
Matusz, P. J., Retsa, C., & Murray, M. M. (2016). The context-contingent nature of cross-modal activations of the visual cortex. Neuroimage, 125, 996–1004.
Maurer, D. (1993). Neonatal synesthesia: Implications for the processing of speech and faces Developmental neurocognition: Speech and face processing in the first
year of life (pp. 109–124): Springer.
McDonald, J. J., Störmer, V. S., Martinez, A., Feng, W., & Hillyard, S. A. (2013). Salient sounds activate human visual cortex automatically. Journal of Neuroscience,
33(21), 9194–9201.
McDonald, J. J., Teder-SaÈlejaÈrvi, W. A., & Hillyard, S. A. (2000). Involuntary orienting to sound improves visual perception. Nature, 407(6806), 906.
Meier, B., & Rothen, N. (2009). Training grapheme-colour associations produces a synaesthetic Stroop effect, but not a conditioned synaesthetic response.
Neuropsychologia, 47(4), 1208–1211.
Meier, B., Rothen, N., & Walter, S. (2014). Developmental aspects of synaesthesia across the adult lifespan. Frontiers in Human Neuroscience, 8, 129.
Mulvenna, C. M., & Walsh, V. (2006). Synaesthesia: Supernormal integration? Trends in Cognitive Sciences, 10(8), 350–352.
Neufeld, J., Sinke, C., Zedler, M., Emrich, H. M., & Szycik, G. R. (2012). Reduced audio–visual integration in synaesthetes indicated by the double-flash illusion. Brain
Research, 1473, 78–86.
Page, N., Bolger, J., & Sanders, M. (1982). Auditory evoked phosphenes in optic nerve disease. Journal of Neurology, Neurosurgery & Psychiatry, 45(1), 7–12.
Ramachandran, V. S., & Hubbard, E. M. (2001a). Psychophysical investigations into the neural basis of synaesthesia. Proceedings of the Royal Society of London B:
Biological Sciences, 268(1470), 979–983.
Ramachandran, V. S., & Hubbard, E. M. (2001b). Synaesthesia – A window into perception, thought and language. Journal of Consciousness Studies, 8(12), 3–34.
Ramachandran, V. S., & Hubbard, E. M. (2003). Hearing colors, tasting shapes. Scientific American-American Edition, 288(5), 52–59.
Rockland, K. S., & Ojima, H. (2003). Multisensory convergence in calcarine visual areas in macaque monkey. International Journal of Psychophysiology, 50(1–2), 19–26.
Romei, V., Gross, J., & Thut, G. (2012). Sounds reset rhythms of visual cortex and corresponding human visual perception. Current Biology, 22(9), 807–813.
Romei, V., Murray, M. M., Cappe, C., & Thut, G. (2009). Preperceptual and stimulus-selective enhancement of low-level human visual cortex excitability by sounds.
Current Biology, 19(21), 1799–1805.
Romei, V., Murray, M. M., Merabet, L. B., & Thut, G. (2007). Occipital transcranial magnetic stimulation has opposing effects on visual and auditory stimulus detection:
Implications for multisensory interactions. Journal of Neuroscience, 27(43), 11465–11472.
Rothen, N., Schwartzman, D. J., Bor, D., & Seth, A. K. (2018). Coordinated neural, behavioral, and phenomenological changes in perceptual plasticity through
overtraining of synesthetic associations. Neuropsychologia, 111, 151–162.
Rouw, R., & Scholte, H. S. (2007). Increased structural connectivity in grapheme-color synesthesia. Nature Neuroscience, 10(6), 792–797.
Sagiv, N., & Ward, J. (2006). Crossmodal interactions: Lessons from synesthesia. Progress in Brain Research, 155, 259–271.
Simner, J., & Bain, A. E. (2013). A longitudinal study of grapheme-color synesthesia in childhood: 6/7 years to 10/11 years. Frontiers in Human Neuroscience, 7.
Simner, J., Harrold, J., Creed, H., Monro, L., & Foulkes, L. (2009). Early detection of markers for synaesthesia in childhood populations. Brain, 132(1), 57–64.
Simner, J., Ipser, A., Smees, R., & Alvarez, J. (2017). Does synaesthesia age? Changes in the quality and consistency of synaesthetic associations. Neuropsychologia, 106,
407–416.
Sinke, C., Halpern, J. H., Zedler, M., Neufeld, J., Emrich, H. M., & Passie, T. (2012). Genuine and drug-induced synesthesia: A comparison. Consciousness and Cognition,
21(3), 1419–1434.
Sinke, C., Neufeld, J., Zedler, M., Emrich, H. M., Bleich, S., Münte, T. F., & Szycik, G. R. (2014). Reduced audiovisual integration in synesthesia–evidence from bimodal
speech perception. Journal of Neuropsychology, 8(1), 94–106.
Sparing, R., Mottaghy, F. M., Ganis, G., Thompson, W. L., Töpper, R., Kosslyn, S. M., & Pascual-Leone, A. (2002). Visual cortex excitability increases during visual
mental imagery—A TMS study in healthy human subjects. Brain Research, 938(1–2), 92–97.
Spence, C., & Driver, J. (1997). Audiovisual links in exogenous covert spatial orienting. Perception & Psychophysics, 59(1), 1–22.
Spierer, L., Manuel, A. L., Bueti, D., & Murray, M. M. (2013). Contributions of pitch and bandwidth to sound-induced enhancement of visual cortex excitability in
humans. Cortex, 49(10), 2728–2734.
Steen, C. (2017). Synesthetic Photisms and Hypnagogic Visions: a Comparison.
78A. Nair and D. Brang Consciousness and Cognition 70 (2019) 70–79
Stein, B. E., & Stanford, T. R. (2008). Multisensory integration: Current issues from the perspective of the single neuron. Nature Reviews Neuroscience, 9(4), 255–266.
Störmer, V. S., Feng, W., Martinez, A., McDonald, J. J., & Hillyard, S. A. (2016). Salient, irrelevant sounds reflexively induce alpha rhythm desynchronization in
parallel with slow potential shifts in visual cortex. Journal of Cognitive Neuroscience.
Terhune, D. B., Luke, D. P., Kaelen, M., Bolstridge, M., Feilding, A., Nutt, D., ... Ward, J. (2016). A placebo-controlled investigation of synaesthesia-like experiences
under LSD. Neuropsychologia, 88, 28–34.
Terhune, D. B., Tai, S., Cowey, A., Popescu, T., & Kadosh, R. C. (2011). Enhanced cortical excitability in grapheme-color synesthesia and its modulation. Current
Biology, 21(23), 2006–2009.
Thompson, W. L., Kosslyn, S. M., Hoffman, M. S., & Van Der Kooij, K. (2008). Inspecting visual mental images: Can people “see” implicit properties as easily in imagery
and perception? Memory & Cognition, 36(5), 1024–1032.
Tilot, A. K., Kucera, K. S., Vino, A., Asher, J. E., Baron-Cohen, S., & Fisher, S. E. (2018). Rare variants in axonogenesis genes connect three families with sound–color
synesthesia. Proceedings of the National Academy of Sciences, 115(12), 3168–3173.
Whittingham, K. M., McDonald, J. S., & Clifford, C. W. (2014). Synesthetes show normal sound-induced flash fission and fusion illusions. Vision Research, 105, 1–9.
Witthoft, N., & Winawer, J. (2006). Synesthetic colors determined by having colored refrigerator magnets in childhood. Cortex, 42(2), 175–183.
Witthoft, N., Winawer, J., & Eagleman, D. M. (2015). Prevalence of learned grapheme-color pairings in a large online sample of synesthetes. PLoS One, 10(3)
e0118996.
Ziskind, E., & Augsburg, T. (1962). Hallucinations in sensory deprivation—method or madness? Science, 137(3534), 992–993.
Ziskind, E., Jones, H., Filante, W., & Goldberg, J. (1960). Observations on mental symptoms in eye patched patients: Hypnagogic symptoms in sensory deprivation.
American Journal of Psychiatry, 116(10), 893–900.
79You can also read