Exploiting Foursquare and Cellular Data to Infer User Activity in Urban Environments
←
→
Page content transcription
If your browser does not render page correctly, please read the page content below
Exploiting Foursquare and Cellular Data to Infer
         User Activity in Urban Environments
                      Anastasios Noulas, Cecilia Mascolo                                Enrique Frias-Martinez
                             Computer Laboratory                                         Telefonica Research
                           University of Cambridge                                          Madrid, Spain
                        name.surname@cl.cam.ac.uk                                            efm@tid.es

   Abstract—Inferring the type of activities in neighborhoods of        GPS sensors to anchor photos, users or real places to a
urban centers may be helpful in a number of contexts including          digital map. Facebook, for instance, has already introduced
urban planning, content delivery and activity recommendations           a feature that allows users to geo-tag every type of post in the
for mobile web users or may even yield to a deeper understanding
of the geographical evolution of social life in the city . During       service [12], whereas the number of tweets with geographic
the past few years, the analysis of mobile phone usage patterns,        information is progressively increasing compared to micro-
or of social media with longitudinal attributes, have aided             blogging content that lacks any geographic reference. The
the automatic characterization of the dynamics of the urban             rapid entrance to the mobile web era has also been marked by
environment.                                                            the rise of online social networks that explicitly use location as
   In this work, we combine a dataset sourced from a telecom-
munication provider in Spain with a database of millions of geo-        an essential element of their services. Examples are Gowalla,
tagged venues from Foursquare and we formulate the problem of           recently acquired by Facebook [29], and Foursquare [3] which
urban activity inference in a supervised learning framework. In         currently numbers more than twenty million users [30] and
particular, we exploit user communication patterns observed at          which is the dominant force in the area of mobile social
the base station level in order to predict the activity of Foursquare   networks. Nevertheless, the datasets emerging from on-line
users who checkin-in at nearby venues. First, we mine a set
of machine learning features that allow us to encode the input          and mobile web services constitute only one of the many
telecommunication signal of a tower. Subsequently, we evaluate          digital information layers covering the geography of the city.
a diverse set of supervised learning algorithms using labels            Since, the introduction of mobile phones, almost twenty years
extracted from Foursquare place categories and we consider two          ago, there has also been a generation of massive datasets
application scenarios. Initially, we assess how hard it is to predict   describing human telecommunication activity in the city as
specific urban activity of an area, showing that Nightlife and
Entertainment spots are those easier to infer, whereas College          captured by BTS (base transceiver station) cells.
and Shopping areas are those featuring the lowest accuracy rates.          In this work we are combining a dataset of millions of
Then, considering a candidate set of activity types in a geographic     Foursquare venues with cellular data to infer types of urban
area, we aim to elect the most prominent one. We demonstrate            activity in the neighbourhoods of a city. More specifically,
how the difficulty of the problem increases with the number             we have collected a large set comprised of millions Call
of classes incorporated in the prediction task, yet the classifiers
achieve a considerably better performance compared to a random          Detail Records (CDR) recorded by the BTS towers of a large
guess even when the set of candidate classes increases.                 Telecommunication provider in Spain. By processing these
                                                                        records that correspond to the telecommunication patterns
                       I. I NTRODUCTION                                 of approximately twelve million users, we mine a set of
   The long-standing vision of smart cities, where intelligent          machine learning features in order to represent the local
infrastructure and technologies are employed to improve ser-            telecommunication signal of a BTS tower. Further, we analyze
vices for its citizens is being progressively materialized. A           the check-in patterns of Foursquare users at places that are
number of urban authorities around the world have launched              geographically close to BTS towers and exploit their semantic
projects that range from optimizing transport and communi-              annotations in order to characterize nearby areas in terms of
cations, to minimizing the impact of urban activity on the              well known urban activities such as Food, Nightlife, Work and
environment [2], [8]. Novel services are being designed by              Travel among others. We formulate a supervised learning task
telecommunication and IT companies[5], whereas academic                 that aims to build a learning function to associate the input
and industrial research units have been organizing conferences          telecommunication signal of a BTS tower to the Foursquare
and inter-disciplinary meetings [1], [7]. Already, this activity        categories of nearby places. This would potentially lead to the
has resulted in a diverse research output in the area [19], [20],       characterization of geographic areas where only CDR data is
[26].                                                                   available.
   The movement towards the city-operating system [6], has                 More specifically our work answers two questions:
been largely driven by the ever increasing usage of smart-                 • Is a given urban activity (Food, Work etc.) the most
phones and mobile web services. These computationally ef-                     prominent activity in a geographic neighbourhood or,
ficient mobile devices present an excellent platform for the                  instead, the area is dominated by some other activity?
development of novel applications, many of which exploit                      We design this problem as a binary classification task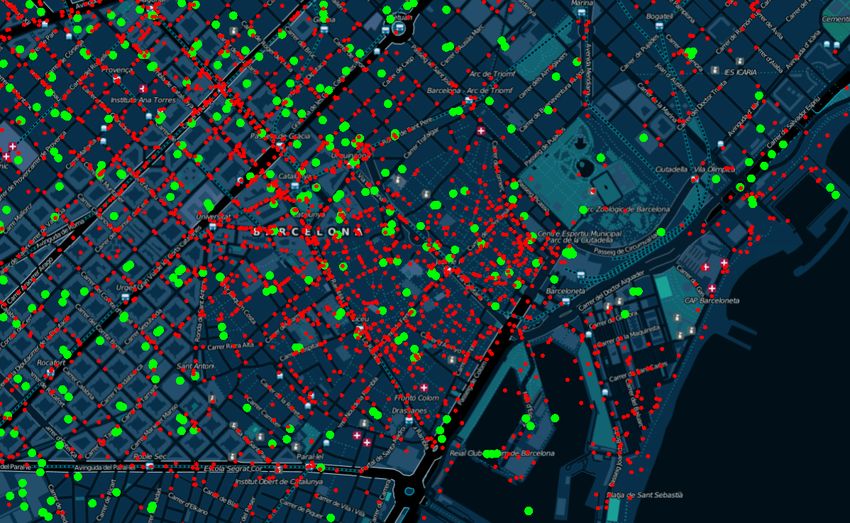
and we assess the difficulty of detecting distinct urban
      activities. We discover that it is easier to predict the
      Nightlife and Entertainment areas in a city, whereas
      Academic and Shopping spots are those in which the
      discriminative power of the classifiers presents the worse
      performance.
   • Assuming the existence of candidate set of urban
      activities that may take place at an area, which is
      the most popular one? We test the prediction accuracy
      of supervised learning algorithms by exposing them to a
      multi-class classification scenario, where a single urban
      activity has to be elected amongst a set of those. We
      show how the prediction problem becomes increasingly
      difficult as we increase the number of classes. Further,
                                                                      Fig. 1. Geographic distribution of BTS Towers (large green circles) and
      we note that as we move beyond four or five candidate           Foursquare venues (small red circles) in the center of Barcelona. The present
      classes the prediction accuracy of all classifiers drops        work aims to mine the telecommunication signal received by BTS towers and
      below 50(%), but the gains over a random guess persist          associated with the semantic annotations of nearby Foursquare places.
      at all instances of the multi-class classification problem.
   We expect the findings of the present work to provide
                                                                      Foursquare that we introduce and analyze in the next section,
insights that could benefit applications such as urban planning
                                                                      we can define the task of inferring the activity of an area as
through the automatic characterization of urban activities in
                                                                      a supervised classification problem where we seek to learn a
cities. Moreover, to our knowledge this is one of the first
                                                                      function f such as
attempts to bring together, in the context of a well defined
machine learning task, cellular data and a dataset collected                                    yi = f (xi )
from a mobile social network such as Foursquare. In the               whose input is the tower’s multi-dimensional communica-
next section we perform an analysis on the usage patterns             tion signal and output a class label that corresponds to
of these two datasets. Next, we define the urban activity             the inferred most prominent nearby activity. In other words,
prediction task and we present a list of features to encode the       we exploit quantitative telecommunication patterns observed
telecommunication signal processed by BTS towers. Finally,            through BTS towers to identify qualitative aspects of activity
we proceed with the evaluation of a diverse set of machine            in the area. In Figure 1, we depict the spatial distribution of
learning algorithms and we close with references to related           BTS towers and Foursquare venues observed in one of the
work and conclusions.                                                 two cities we focus on in the present work, Barcelona. As
      II. S UPERVISED U RBAN ACTIVITY I NFERENCE                      formulated above, each tower will be associated to nearby
                                                                      places. Due to the irregular geographic distribution of the place
   In this section we provide a formulation for the urban
                                                                      and tower entities, imbalances may exist. For example, if two
activity inference task. Given a geographic area in a city our
                                                                      BTS towers are very close to each other, then the Foursquare
goal is to infer the type of activity carried out by people nearby.
                                                                      place labels associated to them will be different, while the
We formulate this problem as a supervised learning prediction
                                                                      towers could cover effectively the same urban area in terms
task where the input vectors are designed according to the
                                                                      of the activity to be inferred. We will discuss in detail and
telecommunication signal at the BTS tower level, whereas we
                                                                      tackle this issue in Section IV, where we describe a technique
consider the popularity of nearby Foursquare places as a proxy
                                                                      that we name tower aggregation.
to characterize human activity.
                                                                         Finally, during evaluation we will discuss two variations
A. Problem Formulation                                                of the supervised learning problem depending on the type
   We now define the urban activity inference task given a set        of application question we are interested in answering. Next
of input towers T and places P in a city. Formally, for an            we provide an analysis driven discussion of the two mobile
area ai associated to tower i, we represent the communication         datasets employed in this work, whereas the features we have
patterns occurring within the range of the tower using a multi-       mined in order to build a tower’s input signal xi are being
dimensional input vector xi . Our goal then is to infer the           formulated in Section IV.
most prominent urban activity yi associated to the area. We
                                                                                      III. M OBILE DATASET A NALYSIS
assume that yi is the label of the Foursquare venue category
z that features the highest number of check-ins in geographic            In this section we analyze the two datasets we employ in the
area ai . For instance if three place categories are observed         present work. Initially an overview of our Call Detail Record
in the area, namely Work, Food and Shops, with check-ins              from Spain is presented, followed by the Foursquare venue
380, 200 and 120 respectively, then yi is set to be equal             dataset. Further, we discuss the most important facets of the
to Work. Considering the eight general types of places in             data in light of the urban activity chacterization problem.
100                                            100                                                        100
                                                                   −1
               10−1                                           10                                                         10−1
                                                              10−2                                                       10−2
               10−2
        CCDF

                                                       CCDF

                                                                                                                  CCDF
                                                              10−3                                                       10−3
               10−3
                                                              10−4                                                       10−4
               10−4                                           10−5                                                       10−5
                    −5                                             −6
               10                                             10                                                         10−6 0
                     100   101           102    103                 100   101        102       103          104             10    101    102      103     104   105
                             Distance [km]                                      Duration [sec]                                      Tower Call Frequencies

Fig. 2. Complementary Cumulative Distribution Functions of the Call Detail Record dataset: In (a) and (b) the distance and duration distributions of calls
are shown respectively whereas in (c) we plot the distribution of the number of sightings (total call frequency) for each tower.

A. Call Detail Records                                                                                  0.016
                                                                                                        0.014
   Call Detail Records (CDRs) are data records collected by
telecommunication providers when cell phone users use one                                               0.012

                                                                                          Probability
of their services, most commonly when they initiate or receive                                          0.010
a voice call. Each time a user participates in a telecommuni-                                           0.008
cation interaction, his or her position can be approximately                                            0.006
inferred by knowing the geographic coordinates of the nearby                                            0.004
BTS tower that has processed the call. Since every interaction                                          0.002
in these systems involves a pair of users, each record can                                              0.000
                                                                                                            Mon Tue Wed Thu Fri Sat                       Sun
be processed to retrieve the position of two users. There are
                                                                                                                     Time of the Week
two possibilities in this case: users could be interacting under
the same BTS tower (users are at same area) or their call
                                                                                     Fig. 3. Temporal evolution of call frequencies aggregated over the period of
may be handled by two different towers (users are at different                       a week. Strong periodicities together with variations between weekdays and
areas). We have processed a dataset of Call Detail Records                           weekends are observed.
spanning a month’s duration in September 2009 collected
by a large telecommunication provider in Spain, through
approximately 100 thousand BTS Towers deployed on the                                data, in Figure 3 we show the temporal evolution of call
country’s territory. Twenty million timestamped calls (together                      frequencies during the course of a week. The call frequency
with text messages) were recorded by twelve million users                            signal extracted from cellular usage patterns presents strong
with per second temporal granularity. Further, the duration of                       periodicities on a daily basis. Moreover, there are two peaks
each voice call was recorded.                                                        in the frequency of calls during lunchtime and dinner times.
   In Figure 2(a) we plot the Complementary Cumulative                               Telecommunication activity drops during the weekends, but
Distribution Function (CCDF) of call distances in the dataset.                       differently to the rest of the days, dinner time activity is a
The log-log plot shows that the distribution follows a power-                        peak, especially on Sundays. We think that those temporal
law functional form with the probability of encountering a                           heterogeneities may signal different types of urban activities
certain value to decrease as distance increases. Interestingly,                      carried out by mobile users as they shift their behavioral
more than 90% of calls occurs within a distance of 10km                              patterns over time. We aim to exploit this information in the
suggesting that a large amount of activity in those systems                          present work by mining features that characterize BTS towers
is concentrated within the urban boundary of a city. This is                         according to the times of the week they are mostly active.
particularly important for this work as we concentrate our
experiments on the two largest cities of Spain, Madrid and                           B. Foursquare Venue Dataset
Barcelona, where call records account for approximately 70%                             So far we have analyzed only one of the datasets we employ
of the country. In Figure 2(b) we present the CCDF of call                           in the present work. While we will be using Call Detail
durations. About 90% of durations are less than 100 seconds                          Records to encode the telecommunication signal of a BTS
and 1% of calls last more than 5 minutes. We will show in the                        tower, the information we use as a proxy of urban activity
next section how we exploit information both on call distances                       for a given geographic area is sourced from Foursquare. The
and durations to build machine learning features for supervised                      service was created in 2008 and since then has attracted more
learning classifiers. Next, in Figure 2(c) the CCDF of call                          than 20 million users [30] who check-in at venues around the
frequencies per BTS tower during a period of 24-hours is                             world informing their social network on their whereabouts.
shown. We can observe large heterogeneities in the volume                            Despite that the application was launched in the form of a
of activity at each tower, as the frequency values span large                        game where users could become mayors of a place if they
orders of magnitude. A small number of towers, potentially                           had the highest number of check-ins there, it has now evolved
those positioned at the centers of large cities, deal with more                      to a large social network and a mobile recommendation engine
than 10 thousand calls daily. Finally, with respect to the CDR                       focused around physical places.
During September 2010, we collected information for about 100
2.5 million Foursquare venues spread around the globe. For 10−1
each venue, or place, we are aware of its geographic coordi- 10−2
nates. Further, category information about each place has been 10−3
CCDF
crowd sourced by Foursquare users. Thus a venue has been as- 10−4
10−5
sociated with a semantic label that signifies its type. There are
10−6
two hierarchical level of places categories in Foursquare [4],
10−7
a more general one that describes the place in an abstract
10−8
way (for instance Food) and a more specific one (for instance 10−9 0
Paella Restaurant). In the context of the present work we will 10 101 102 103 104 105 106
use the more general category hierarchy for which we have Place Check-ins
eight possible variations: Arts and Entertainment, College And
Education, Food, Work, Nightlife, Parks and Outdoors, Shops Fig. 4. Complementary Cumulative Distribution Function of place check-ins
in Foursquare.
and Travel Spots. Moreover, each venue in the Foursquare
dataset contains information on the total number of check-
700000
ins that its users have carried out since the inception of the Places
service. Here, we will exploit information on the popularity of 600000
Foursquare venues and their categories in order to characterize 500000
geographic areas in Madrid and Barcelona, covered by BTS
Place Frequency
400000
towers. Our assumption is that Foursquare check-in activity
can be used to identify the type of urban activity occurring in 300000
a city’s neighbourhood. 200000
100000
0
Work Food Trav Park Arts Coll Nigh Shop
In Figure 4 we plot the Complementary Cumulative Dis- Foursquare Categories
tribution Function of the check-in number observed at each
Foursquare venue. We observe large variations in the popular- ×107
9
ity of venues with most of them concentrating a small number Check-ins
8
of check-ins and a small minority to concentrate a large
7
number of user visits in the order of thousands. The bias in
Check-in Frequency
6
popularity of Foursquare places is relevant to this work as this
5
is already an indication that the intensity of user activity may
4
differ significantly across space. To shed further light in this
3
direction, we analyze the way place and check-in popularity
2
varies when considering different Foursquare categories. First,
1
in Figure 5(a) we show the number of places per category
0
in Foursquare. Most places, approximately 630 thousand, are Work Food Trav Park Arts Coll Nigh Shop
Foursquare Categories
associated with Food, a category which includes restaurants
and coffee shops. Next, Work and Shops categories also feature
a large set of places, while the rest of venue types (Travel, Col-
Fig. 5. Frequency of places and check-ins for each category in the Foursquare
lege, Arts and Nightlife) have a significantly smaller number of dataset.
settlements. The striking observation however, comes when we
shift our view to Figure 5(b), where the number of check-ins
per category is shown. The most popular Foursquare category IV. M INING U SER T ELECOMMUNICATION ACTIVITY
is Travel with more than 80 million check-ins, at least two
times higher than any other category. The ratio between places In this section we describe and formulate the machine
and check-in number for this particular category signifies that learning features mined by analyzing the user telecommuni-
a large number of check-ins is focused on very popular Travel cation activity around BTS towers. All features for a given
spots, such as airports and train stations as also has been tower i are combined in a vector xi that represents the input
demonstrated previously [22]. As mentioned in Section II, telecommunication signal of the area ai covered by tower i.
for a particular area ai , the corresponding urban activity Supervised learning algorithms will then be applied on the
label yi is extracted by considering the check-in popularity signal vectors to infer the activity yi in the area. Finally, in
of a Foursquare venue category in the area (Figure 5(b)), this section we introduce a BTS tower aggregation technique
as opposed to the venue popularity which would enumerate that aims to combine the signal of neighboring towers in order
simply the number of venues for a category in ai . to improve the quality of the learning task.A. Learning Features visitors from other cities may be a good candidate activity
User Communication Entropy: We represent with cik class favored by this feature.
the number of calls by user k at tower i during the measure- Weekend Calls: It is intuitively expected that Nightlife
ment period. Then, by considering the total number of calls areas should be more prone to gather crowds during weekends,
at tower i, |Ci |, we define the user’s proportion of calls at whereas Work/Office spaces may be, in most cases, weekday
the tower as pik = |Ccik
. Our goal is here to capture how call attractors. Consequently, the call volume distribution over time
i|
records at a tower are distributed across users. Thus, we define for these areas will also be analogous. We then define a feature
Eik as the entropy of the distribution of pik values, taking into that captures specifically this behavioral property of cell phone
account all n users that are seen at a tower. users. We define the day of a call l at BTS tower i as day(cil )
n defined as
X
users
Eik =− pik log pik (1) |{cil ∈ Ci s.t. day (cil ) ∈ {Saturday, Sunday}}|
k=1 (4)
|Ci |
A high entropy value implies that communication activity at
and measure the fraction of CDR records of the BTS tower
the tower is distributed across many users who have very few
that are observed during weekends.
calls, whereas smaller values can be interpreted as signs of
more stable and periodic user behavior. For instance, Work Night Time Call Volume: Similarly, we are capturing
environments may involve a lot of users returning to those the signal of night time calls by measuring the corresponding
regularly, whereas Arts and Entertainment areas may attract ratio of night time versus the total number of calls. This is
many opportunistic visitors. formally achieved by setting the hour of a call cil as hour(cil )
Outgoing Tower Entropy: In a similar spirit, we define and defining the nightntime call volume as
the entropy of a BTS tower, by considering its interaction with |{cil ∈ Ci s.t. hour (cil ) > 6p.m. ∧ hour (cil ) < 4a.m.}|
other towers and measuring the frequency of outgoing calls |Ci |
to them. While this feature is potentially correlated to user (5)
communication entropy, it is more informative about where where by night time call we define any call that took place after
calls are placed to or received from. For instance, one could 6pm and before 4am. We note that, alternatively to the above
expect that Travel spots or Work areas may have more calls definitions, we could have an even more granular representa-
towards many different towers, whereas in Entertainment areas tion of the temporal communication signal, if for instance we
people are often calling each other to synchronize before they were using vectors noting the frequency of calls at each hour
meet and may constrain a lot of their calls to a subset of slot of the week. Considering time with this level of accuracy,
proximate towers. Formally, we measure the proportion of however, would dramatically increase the dimensionality of
c
calls pij = |Ciji | , where cij is the number of calls initiated the input signal. When we informally experimented with this
by tower i towards tower j and subsequently we define the scenario we observed a large drop in the prediction accuracy
corresponding entropy score for m outgoing towers as of our classifiers.
m
X Durations: The duration of calls may be another proxy to
towers
Eij =− pij log pij (2) infer human activity. People tend to have long calls when they
j=1 are talking to close friends and relatives or when discussing
Remote Communications: In order to explicitly incor- work related subjects. Aiming to separate short from long
porate geographic distance as a feature, for each tower we calls, assuming that this may reflect to different types of
measure the geographic distance to the contact tower where the activity, we set a threshold dur0 of three minutes and we
outgoing (resp. incoming) call was initiated. Hence, for each define the corresponding feature as
tower, we have a set of distance samples which we employ |{cil ∈ Ci s.t. dur (cil ) > dur0 }|
to characterize it geographically. As we have shown in the (6)
|Ci |
analysis section, the distribution of distances follows a power-
law trend so an average value would not correspond to a valid where dur(cil ) is the duration of the call.
characterization. Instead, we define a threshold value d0 and User Return Times: Above, we have defined the entropy
we measure the volume of calls above that threshold. Formally value of the frequency distribution of user calls. This feature
we define the distance of a call cil at tower i as dist(cil ) and represents the tendency of cell phone users to return to the
the corresponding feature as area within the scope of the BTS tower, but it does not provide
information about when users return there. Food and nightlife
|{cil ∈ Ci s.t. dist (cil ) > d0 }|
(3) areas may be opportunistically visited by users, but another
|Ci | aspect of human behaviour is habit. Thus, despite not being
Our goal has been to identify remote calls to other cities and bound to return to our favourite restaurant, we may still visit it
we have found 10 km to be a good threshold that would frequently, if we appreciate its service, for instance. Thus we
allow us to distinguish between calls within the urban borders define the volume of return times over nighttime and weekends
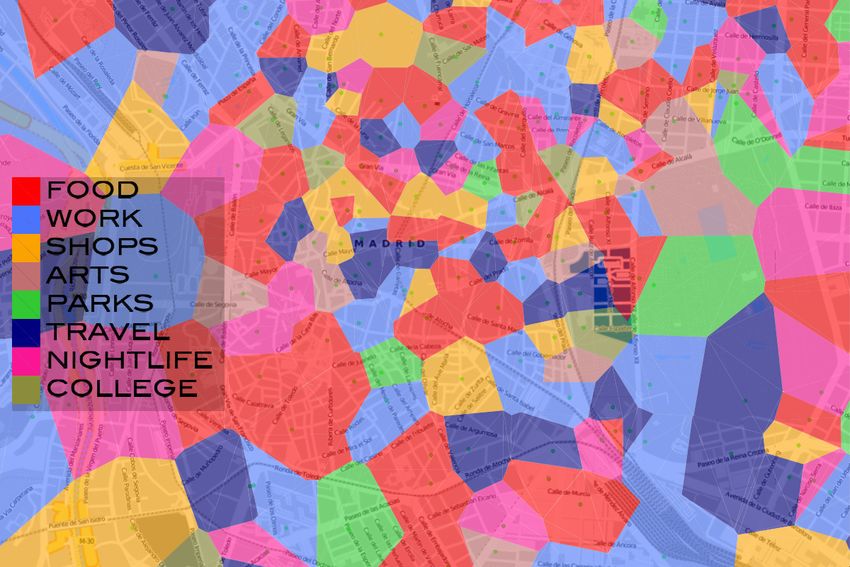
to those destined further away. Travel areas which attract respectively, by noting a return event of a user at tower i asFig. 6. Depicting the affect of aggregating BTS towers to Super-Towers that cover larger geographic areas. We have clustered the geographic coordinates of
BTS towers to yield spatial centroids covering larger patches of land. Each voronoi cell at the tessellations is colored with the most popular activity proxied
by exploiting the popularity of nearby Foursquare places. This figure is better inspected in full color mode.
r and the time of the event as time(r), as the towers that have been grouped together by the algorithm.
|{r ∈ Ri s.t. time(r) > 6p.m. ∧ hour(r) < 4a.m.}| In Figure 6 we show the effect of aggregating towers in the
(7) city of Madrid. On the left (Figure 6(a)), we observe the
|Ri |
Voronoi tessellation generated the original set of BTS towers
and in the city without considering any aggregation mechanism.
|{r ∈ Ri s.t. day(r) ∈ {Saturday, Sunday}}| On the right hand side (Figure 6(b)), we show the tessellation
(8) after the aggregation step has been applied. There are two
|Ri |
main observations. First and by definition, the areas emerging
where Ri is the total number of return events at tower i. after aggregation are larger. Second, the distribution of popular
B. Tower Aggregation activities at areas in the city changes (see different colors
mapping urban activities). Indeed, the way we segment the
In addition to the extraction of features required for the
geographic plane plays an important role on the character-
encoding of a tower’s telecommunication signal, we have
ization of areas, since the underlying distribution of places
performed the pre-processing step of aggregating geograph-
per BTS tower and geographic area alters. During evaluation
ically nearby towers into virtual super-towers. The aim of
(Section V), we will discuss the results for the urban activity
this step is two-fold. First and most importantly, in very
prediction task with tower aggregation, as noise becomes
dense urban environments there is a very large number of
an obstacle to the learning process when the aggregation
telecommunication towers which segregates the geographic
mechanism is not enabled with accuracy dropping to the levels
space into very small partitions. Sometimes two or three BTS
of a random guess.
towers may be almost stuck on each other to serve an area, as
it has also been hinted in Figure 1. The effect of this is that for V. E VALUATION
every tower there are very few Foursquare places associated to Below we demonstrate the results obtained after exposing
it, thus extracting labels from such a small sample has resulted a diverse set of supervised learning algorithms to the training
to noise. Second, through aggregation, we combine the signal and test datasets obtained after the generation of features and
of nearby towers and enhance the quality of the input signal labels shown previously. We consider two scenarios. First we
which is critical to the learning task. examine how easy it is to predict whether a specific Foursquare
In order to perform tower aggregation, we have ex- activity is prominent in a geographic area, whereas in the
ploited a density-based spatial clustering algorithm named second scenario we consider the potential existence of multiple
DBSCAN [9]. The algorithm accepts as input the BTS towers urban activities and we seek to predict the most popular one.
in the city encoded through their latitude and longitude coor-
dinates. After clustering the input points in the 2-dimensional A. Algorithms, Methodology and Metrics
space defined by geographic coordinates, it returns clusters of We have chosen to evaluate a host of classification algo-
geographically proximate towers. We define the centroid of rithms, each one being a representative of a different school of
each cluster to be a super-tower, that is, a tower whose input thoughts from the machine learning and artificial intelligence
signal xi is defined by aggregating the call detail records of communities. In particular, we examine a simple Logistic100
Regression model which assumes a linear relationship amongst
the training features and performs regression analysis for 90
Prediction Accuracy (%)
predicting the outcome of a categorical variable. In addition, 80
we employ a Support Vector Machine (SVM) classifier [10]. 70
SVMs have been successfully employed in a number of 60
machine learning tasks and they operate by maximizing the 50
margin between the nearest data points of two classes and 40
the hyperplane that separates them. From the field of neural 30
networks we select one of the well-known representatives, 20
the Multilayer Perceptron [25]. The perceptron is a network Shop Arts Nigh Food Work Park Coll Trav
Activity Label
of artificial neurones, which exploits a supervised learning
technique known as backpropagation, to adapt their weights
with other nodes in the network. Moreover, we consider Fig. 7. Average Prediction Accuracy for different Foursquare activities. The
the class of Decision Tree learning and use Logistic Model error bars correspond to standard deviations in the performance of the five
classifiers over each class.
Trees [18]. This supervised model combines logistic regression
with tree induction. Each leaf in these trees corresponds to a
100
linear model that is used for classification. Finally, we also
90
exploit a Bayesian Network based classifier [28], referred
Prediction Accuracy (%)
here as DMNBText, which exploits discriminative learning to 80
infer the parameters of a Bayesian Network that is used for 70
classification. We have invoked the algorithms above through 60
the weka machine learning framework [14] using default 50
parameters. For each classification task we have performed 40
a 10-fold cross validation on a balanced training set averaging 30
the accuracy results obtained in Madrid and Barcelona. In 20
each prediction task a random predictor would correspond to DMNBtext LMT Perceptron LibSVM Logistic
1 Classifier
flipping a coin with probability K , where K is the number of
classes.
Fig. 8. Average Prediction Accuracy of the five classifiers for the binary
B. Binary Urban Activity Inference classification task.
Formulation: As a first step we are interested in un-
derstanding whether we can predict a single most prominent
activity for a given area in the city. More specifically we ask Results: In Figure 7 we present the prediction perfor-
the following: mance achieved for each one of the Foursquare activities.
• Is Food (resp. for every activity) the most popular activity The best results have been achieved for Nightlife and Arts
in an area or some other activity? and Entertainment activities, both averaging 86%. They are
We formulate this question as a binary classification task followed by Shopping and Parks and Outdoor areas, where
and we generate a distinct supervised learning task for each almost 70% of the test instances is predicted correctly. The
of the eight activities we examine. In each prediction task, accuracy scores obtained for the rest of the activities are in
every area in the city where the activity in question is the the range between 60% to 65%, yet offering at least 20%
most popular is marked with the corresponding class name improvement over a random guess. Next, in Figure 8 we
(for instance Food), whereas all remaining areas are marked observe the performance of individual classifies averaged over
with the label Other. Then, a classifier’s goal is set to predict all the prediction activity tasks (i.e., considering all different
accurately in which areas, the activity we are interested in class labels). While it is not easy to identify a dominant
is the most popular, and in which cases is not, based on the algorithm, Logistic Model Trees (LMT) achieve peak perfor-
feature vector of the BTS tower input signal xi . mance followed closely by the DBNMText Bayesian Network
A potential example application of such an approach could approach. The Logistic Regression classifier trails behind with
be related to urban planning. For instance, if municipal author- an accuracy score just below 70%.
ities are willing to discover which areas are popular Nightlife An analytical overview of the 10-fold cross validation scores
hotspots they could exploit the existing telecommunication achieved by each classifier for every Foursquare activity is
infrastructure to identify those and then build related services. shown in Figure 9. It is interesting to observe that, for certain
Here, in terms of experimental evaluation, we would like to activities, supervised learning algorithms present high vari-
understand firstly whether certain activities are easier to predict ability. Arts and Entertainment areas, which include Museums
than others, and secondly, how do machine learning classifiers and Art Galleries have been predicted with perfect accuracy
perform when they are invoked to infer each of the individual by the Multi-layer Perceptron (100%), when Logistic Model
activities. Trees for the same task fall below 80%. On the other hand,Shop Arts Nigh Food
Logistic
LibSVM
Perceptron
LMT
DMNBtext
Work Park Coll Trav
Logistic
LibSVM
Perceptron
LMT
DMNBtext
20 40 60 80 100 20 40 60 80 100 20 40 60 80 100 20 40 60 80 100
Prediction Accuracy (%) Prediction Accuracy (%) Prediction Accuracy (%) Prediction Accuracy (%)
Fig. 9. Average Prediction Accuracy of the five classifiers across the different urban activity classes for the binary classification task considering a 10-fold
cross validation approach.
classifier scores for Work and Travel areas are quite stable C. Multi-Class Urban Activity Inference
at almost 62%. Notably, Logistic Model Trees do very well Formulation: In the previous section we have illustrated
on the College and Education category, reaching an 80% experimental results for the prediction task on whether a
accuracy when the rest of the algorithms are bound well below certain urban activity is the most popular in an area or not.
65%. Overall, it is interesting to observe that different urban An alternative and perhaps harder exploration would be to
activities may be more predictable by different classifiers, infer which activity is prominent in an area, by considering
although there is no clear winner across all cases. A potential a potential candidate set of those. We pose the following
explanation for this behavior could be deduced if one bears in question:
mind that different supervised learning models make different • Which is the most popular activity in a given area in a
assumptions about the relationships of the input features (for city?
instance linear versus non-linear models). It could be the
This question can be formulated in machine learning terms by
case then that for certain types of activities, different model
designing the corresponding multi-class classification version
assumptions may prove to be better than others. Moreover,
of the problem, where a classifier is trained to infer one
from an application point of view, it appears that the type of
class amongst a set of K potential classes {C1 , . . . , CK }. We
activity one is willing to infer may greatly affect the expected
consider different values for K ranging from 2 to 8 classes
accuracy. Whether some types of areas are easier to predict
and we are interested in comparing the performance of the
than others may depend on a number of factors, such as the
different classifiers for each K. For each prediction task we
fact that the information retrieved by the telecommunication
elect the top-K categories in terms of the number of areas in
signal as seen through Call Detail Records has inherent limita-
the city that a corresponding category is most popular in, and
tions with respect to the inference task, or, from a data mining
subsequently we train and test our classifiers to predict across
perspective, that the features we have introduced in the present
those. We note that the instance of the binary classification
work are biased towards a specific set of classes. Our approach
task examined here (for K = 2) is different from the ones
to exploit the quantitive signal of user communication activity
examined in the previous section: now we aim to assess the
to infer qualitative types of urban activities may at first glance
discriminative power of the supervised learning algorithms
appear ambitious, however, the prediction accuracy of the
amongst the two most popular classes, instead of picking a
classifiers we have experimented with demonstrates that the
single class out of eight and asking whether an area features
inference task is feasible to solve and could have interesting
this class or any other.
practical applications.
Results: In Figure 10 we demonstrate how the prediction
accuracy of the supervised learning algorithms evolves with
respect to the number of classes K incorporated in the80
80 Classifiers
Perceptron 70 Random
70 DMNBtext
Prediction Accuracy (%)
LMT 60
60 LibSVM
50
Logistic
Accuracy (%)
Random 40
50
30
40
20
30
10
20 0
2 3 4 5 6 7 8
10 Number Of Classes
2 3 4 5 6 7 8
Number of Classes
Fig. 11. Average accuracy of the five classification algorithms compared
Fig. 10. Performance of the five supervised learning classifiers in the multi- to randomly guessing the class label. It can be observed that despite the
class classification task. Here we depict the accuracy of the algorithms for significant drop in prediction accuracy, the input telecommunication signal
varying number of classes K, using a 10-fold cross validation approach. offers clear gains over a random choice.
classification task. It can be observed that accuracy is high using Erlangs. Another study is described in [27], where CDR
and above 65% when K = 2. In that case DMNBText is is used to characterize and cluster land uses based on cell
leading in performance with at least 5% margin with respect phone activity. A similar work is presented in [15], where the
to the rest of the classifiers. The dominance of DMNBText authors analyze four different geographical spots at different
remains also for K = 3 where Support Vector Machines times in Bangkok and identified correlations between land use
are performing well too, with the Multi-layer Perceptron and and CDR activity. Finally, CDR has been extensivelly used
Logistic Regression to drop heavily in performance, scoring to characterize mobility within urban areas, as in Isaacman et
below 50%. For number of classes K = 4 or more, all al. [16], which analyzed and compared daily movements of
classifiers can predict successfully only less than half of the people in New York City and Los Angeles.
instances. Regarding social media, services such as Twitter, Flickr or
For large K values, the Multi-layer Perceptron presents Foursquare, have been used to study and characterize urban
high resilience in accuracy terms, maintaining a score much environments exploiting geo-tagged information. Focusing on
higher to the rest of the algorithms that is only being matched Twitter, Wakamiya et al. [31] and Fujisaka et al. [13] have
by that of the Support Vector Machines when K = 6. used geo-tagged Twitter datasets and its semantic content to
For a maximum number of classes K = 8 which is the study and characterize crowd mobility. Similarly, Kinsella et
total number of Foursquare place categories, the perceptron al. [17] used geo-located tweets, together with their content,
improves performance almost by 50% when compared to to create geographic language models at varying levels of
the rest of the algorithms. To sum up, it is in principle granularity (from zip codes to countries). The authors use
expected that a classification task becomes harder as we these models to predict both the location of the tweet and the
increase the number of classes K. The number of outlier user based on linguistic content changes. Foursquare has been
instances increases (noise) together with the complexity of the used by Noulas et al. [21] to model crowd activity patterns in
problem of identifying effectively class boundaries. Despite London and New York City using spectral clustering. Finally,
that, the performance of the classifiers drops significantly for Flickr has been the focus of the work by Crandall et al. [11],
large Ks, as we demonstrate in Figure 11, the gain achieved which used a dataset of geotagged photos from Flickr to
from the algorithms and telecommunication signal features is perform world landmark localization using the mean-shift
significantly higher over a random guess in all cases. algorithm.
Although the literature presents a large variety of studies, to
VI. R ELATED W ORK the best of our knowledge, no previous work combines both
Due to the pervasiveness of cell phones and the popularity CDR and mobile social media to characterize urban environ-
of mobile social media a variety of works that focus on ments. From this perspective, the results we have presented
characterzing urban environments using Call Detail Records combine the capabilities of both datasets for studying and
(CDR) or mobile social networks have emerged. characterizing urban landscapes.
Focussing on CDR, a seminal work by Ratti et al. [23]
VII. C ONCLUSION
used aggregated cell-phone data to analyze urban planning
in Milan with an interest in location-based services and In this paper we have proposed two approaches for the char-
related applications. The work presented in [24] monitored acterization of urban environments. Our framework leverages
the urban dynamics in the city of Rome and obtained clusters the telecommunication signal of BTS towers as seen through
of geographical areas measuring cell phone towers activity Call Detail Records in conjunction with information about thecategories and popularity of Foursquare places. [17] S. Kinsella, V. Murdock, and N. Oare. I am eating a sandwich in glasgow
We have formalized this problem as a supervised learning modeling locations with tweets. In Proc. of the 3rd Workshop on Search
and Mining User-generated Contents, Glasgow, UK, 2011.
classification task where the goal is to infer a learning function [18] N. Landwehr, M. Hall, and E. Frank. Logistic model trees. Mach.
that associates the BTS tower signal to Foursquare seman- Learn., 59(1-2):161–205, May 2005.
tic labels distributed geographically in the nearby area. We [19] N. Lathia, S. Ahmed, and L. Capra. Measuring the impact of opening
the London shared bicycle scheme to casual users. 22, 2012.
have considered two alternative approaches of classification: [20] N. Lathia and L. Capra. Mining mobility data to minimise travellers’
a binary classification task where a classifier is called to spending on public transport. In Proceedings of the 17th ACM SIGKDD
discriminate whether a given urban activity is the most popular international conference on Knowledge discovery and data mining, KDD
’11, pages 1181–1189, New York, NY, USA, 2011. ACM.
at an area of the city, and a multi-class classification task where [21] A. Noulas, S. Scellato, C. Mascolo, and M. Pontil. Exploiting semantic
the most popular activity in a neighbourhood has to be elected annotations for clustering geographic areas and users in location-based
amongst a set of a many. In both cases we have evaluated the social networks. In 3rd Workshop Social Mobile Web (SMW 2011).
[22] A. Noulas, S. Scellato, C. Mascolo, and M. Pontil. An empirical study
performance of five different supervised learning classifiers of geographic user activity patterns in foursquare. ICWSM2011, 2011.
considering two Spanish cities, Madrid and Barcelona. [23] C. Ratti, R. M. Pulselli, S. Williams, and D. Frenchman. Mobile
In addition we have performed an analysis on the telecom- landscapes: using location data from cell phones for urban analysis.
Environment and Planning B: Planning and Design, 33(5):727–748,
munication usage patterns of millions of cell phone users and 2006.
offered insights about the distribution of Foursquare categories [24] J. Reades, F. Calabrese, A. Sevtsuk, and C. Ratti. Cellular census:
and their popularity in terms of check-in number. We have also Explorations in urban data collection. IEEE Pervasive Computing,
6(3):30–38, 2007.
built a set a machine learning features that may be exploited [25] F. Rosenblatt. Principles of neurodynamics: Perceptrons and the theory
to infer the qualitative characteristics of urban areas through of brain mechanisms. 1961.
cellular data. [26] C. Roth, S. M. Kang, M. Batty, and M. Barthlemy. Structure of urban
movements: Polycentric activity and entangled hierarchical flows. PLoS
In terms of future work, we are aiming to exploit cellular ONE, 6(1):8, 2011.
data to infer a mixture of activities in a neighbourhood rather [27] V. Soto and E. Frias-Martinez. Robust land use characterization of urban
than a single one. In addition, the prominence of user activities lanscapes using cell phone data. In 1st Workshop on Pervasive Urban
Applications, in conjunction with 9th Int. Conf. Pervasive Computing,
may change over time in a given area, thus exploring the 2011.
temporal dynamics of urban activity evolution is another [28] J. Su, H. Zhang, C. X. Ling, and S. Matwin. Discriminative parameter
interesting direction to be explored in the future. learning for bayesian networks. In Proceedings of the 25th international
conference on Machine learning, ICML ’08, pages 1016–1023, New
York, NY, USA, 2008. ACM.
R EFERENCES [29] Techcrunch. Facebook has acquired gowalla. http://techcrunch.com/
[1] CASA Smart Cities: bridging physical and digital. http://www.bartlett. 2011/12/02/report-facebook-has-acquired-gowalla/, December 2011.
ucl.ac.uk/casa/events/2012-04-20-Conference. [30] The Next Web. Foursquare hits 20 millions users and 2
[2] European Smart Cities. http://www.smart-cities.eu/. billion check-ins. http://thenextweb.com/socialmedia/2012/04/16/
[3] Foursquare application. http://www.foursquare.com/. foursquare-hits-20-million-users, April 2012.
[4] Foursquare Venue Categories. http://aboutfoursquare.com/ [31] S. Wakamiya, R. Lee, and K. Sumiya. Urban area characterization
foursquare-categories/. based on semantics of crowd activities in twitter. In C. Claramunt,
[5] IBM Smart Cities. http://www.ibm.com/smarterplanet/us/en/smarter S. Levashkin, and M. Bertolotto, editors, GeoSpatial Semantics, volume
cities/overview/index.html. 6631 of Lecture Notes in Computer Science, pages 108–123. Springer
[6] London to test ’smart city’ operating system. http://www.bbc.co.uk/ Berlin / Heidelberg, 2011.
news/technology-17940797.
[7] MIT Smart Cities. http://cities.media.mit.edu/.
[8] Smart Santander. http://www.smartsantander.eu/.
[9] A density-based algorithm for discovering clusters in large spatial
databases with noise, 1996.
[10] C.-C. Chang and C.-J. Lin. Libsvm: A library for support vector
machines. ACM Trans. Intell. Syst. Technol., 2(3):27:1–27:27, May 2011.
[11] D. J. Crandall, L. Backstrom, D. Huttenlocher, and J. Kleinberg.
Mapping the world’s photos. In Proceedings of the 18th international
conference on World wide web, WWW ’09, pages 761–770, 2009.
[12] Facebook. Building better stories with location and friends. http://
developers.facebook.com
/blog/post/2012/03/07/building-better-stories-
with-location-and-friends, March 2012.
[13] T. Fujisaka, R. Lee, and K. Sumiya. Exploring urban characteristics
using movement history of mass mobile microbloggers. In Proceedings
of the Eleventh Workshop on Mobile Computing Systems & Applications,
pages 13–18. ACM, 2010.
[14] M. Hall, E. Frank, G. Holmes, B. Pfahringer, P. Reutemann, and I. H.
Witten. The weka data mining software: an update. SIGKDD Explor.
Newsl., 11(1):10–18, Nov. 2009.
[15] T. Horanont and R. Shibasaki. Evolution of urban activities and land
use classification through mobile phone and gis analysis. In CUPUM,
2009.
[16] Isaacman, S. and Becker, R. and Cáceres, R. and Kobourov, S. and
Rowland, J. and Varshavsky, A. A tale of two cities . In Proceedings of
the Eleventh Workshop on Mobile Computing Systems & Applications,
pages 19–24, 2010.You can also read