Interactive Brokers Group Investor Presentation - First Quarter 2019
←
→
Page content transcription
If your browser does not render page correctly, please read the page content below
Interactive Brokers Group
Investor Presentation
First Quarter 2019
Disclaimer

    The following information contains certain forward-looking statements that reflect the Company’s
    current views with respect to certain current and future events and financial performance. These
    forward-looking statements are and will be, as the case may be, subject to many risks, uncertainties
    and factors relating to the Company’s operations and business environment which may cause the
    Company’s actual results to be materially different from any future results, expressed or implied, in
    these forward-looking statements. Any forward-looking statements are based upon information
    available to the Company on the date of this presentation. The Company does not undertake to publicly
    update or revise its forward-looking statements even if experience or future changes make it clear that
    any statements expressed or implied therein will not be realized. Additional information on risk factors
    that could potentially affect the Company’s financial results may be found in the Company’s filings with
    the Securities and Exchange Commission.

2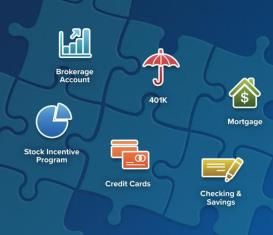
Who we are, Where we are going

We began as a market maker in 1977.
We used this technology and knowledge of markets to launch our brokerage business in 1993.

     Today We Are:
     ▪ One of the largest U.S. electronic brokers as measured by DARTs.

     ▪ Fastest organically-growing, publicly-traded U.S. electronic broker as measured by client
        accounts and client equity.

     ▪ Broad global reach – Access to over 120 markets in 31 countries.

     ▪ Seamless access to products worldwide – Trade stocks, options, futures, commodities, FX and
        fixed income in up to 23 currencies.

     ▪ Highly efficient, scalable business model – $1.4M net revenue / employee (4) (5).

     623,000                         $7.4B                          848,000                             64%                               21%
       Client                           Equity                          DARTs 1,2                  Brokerage Pretax                    YoY3 Account
     Accounts 3                        Capital 3                                                      Margin 1,4                         Growth

 (1) 1Q19   (2) DARTs are based on client orders   (3) 3/31/19   (4) Excludes MtM on US Treasuries, one-time   (5) Trailing twelve months to 3/31/19
                                                                     gains and currency diversification

 3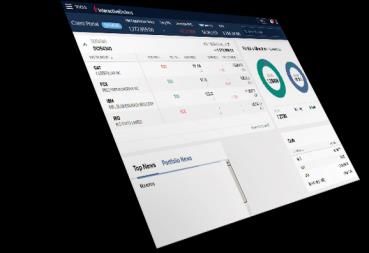
Strong Balance Sheet

                        We maintain a strong and growing balance sheet

                                  At March 31, 2014              At March 31, 2019

    Long-term debt                           $0                              $0

    Total equity                        $5.2 billion                   $7.4 billion
                                  +$2.5 billion in dividends    + $4.0 billion in dividends
                                         distributed                   distributed
    Excess regulatory capital            $3.3 billion                    $5.9 billion

    Public shares                     55 million    14%             75 million      18%

    Private ownership               347 million     86%            339 million      82%
    Total                           402 million    100%            414 million     100%

4
Corporate Strategy
Automation allows IB to be the lowest cost processor in our industry
▪ Majority of senior management are software engineers
▪ From account opening through the entire transaction lifecycle, our processes are automated
▪ As a result, we were able to execute, clear and settle 848,000 trades per day in 1Q19,
across multiple product classes and in multiple currencies, at over 120 market centers in 31
countries with 1,458 (1Q19) employees
▪ Automated, real-time risk management
5
Excludes MtM on Treasuries and CHF client losses in 2015.Diversified Enterprise
Brokerage
Brokerage Brokerage
Year To Date
Accounts Client Equity
Commissions by Client
623K $148B $173M
As of March 31, 2019
6Geographic Distribution
Client Accounts Client Equity LTM Commissions
406K 517K 623K $97B $129B $148B $600M $713M $730M
100%
90% 22% 25%
27% 27% 27% 28% 27%
Asia 33% 35%
80%
70% 13%
14% 14% 18%
18% 18%
Europe &
60% 26%
Africa 25%
25%
50%
40%
Americas 65%
30% 59% 59% 57% 54% 55%
47%
20% 42% 40%
10%
0%
Mar-17 Mar-18 Mar-19 Mar-17 Mar-18 Mar-19 Mar-17 Mar-18 Mar-19
7Client Segment Distribution
Client Accounts Client Equity LTM Commissions
406K 517K 623K $97B $129B $148B $600M $713M $730M
100%
Introducing 7% 8% 9%
brokers 17%
90% 22% 21% 23%
Proprietary 28% 32% 17% 17% 14%
trading groups 80%
3% 13%
Financial 11% 10%
advisors 70% 3% 16%
2% 17% 17%
19%
Hedge and 17%
60%
mutual funds 16% 25% 23%
1% 23% 9% 10%
9%
Individual 50% 1% 1%
traders &
investors 9% 10%
40% 9%
30%
55%
51% 49% 50% 49% 51%
20%
36% 35% 35%
10%
0%
Mar-17 Mar-18 Mar-19 Mar-17 Mar-18 Mar-19 Mar-17 Mar-18 Mar-19
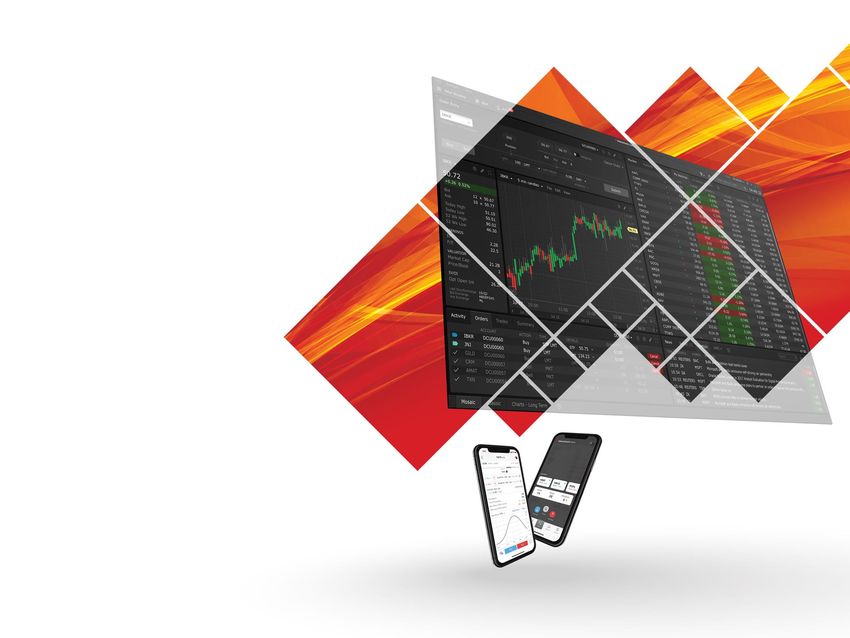
8Our Competitive Strengths
Low Cost & Breadth Superior Trading
Best Execution of Product Technology
▪ Low execution costs: Starting rates ▪ Clients can trade on over ▪ Sophisticated market-maker
decrease with higher volume tiers 120 market centers in designed technology
• U.S. Stocks $0.0005 to $0.0035 31 countries and up to 23
per share currencies ▪ Multiple desktop and mobile
• U.S. Options $0.15 to $0.70 trading platforms
per contract1 ▪ Seamless electronic market
access to stocks, options, ▪ Advanced trading tools
▪ U.S. margin interest tiers range futures, forex, commodities,
from 2.7% to 3.9%.2 bonds, funds and ETFs from a ▪ 60+ order types and algos
single IB Universal Account®
▪ IBKR’s Smart Order Router is ▪ API solutions
designed to achieve best price
execution by routing directly to
market centers. We do not sell
client order flow.3
▪ IHS Markit, a third-party provider of
transaction analysis, determined
that IBKR’s U.S. stock price
executions were $0.52 per 100
shares better than the industry’s.3
(1) For more information see ibkr.com/commissions
(2) As of May 6, 2019. See ibkr.com/interest
(3) See ibkr.com/bestexecutionEffect of IBKR’s Low Margin Rates
E-Brokers defined as IBKR, AMTD, SCHW, and ETFC
10Brokerage Expansion
Market leading growth in every key metric
11Competition Metrics
IBKR ETFC1 AMTD2 SCHW
3-year 3-year 3-year 3-year
1Q2019 Change 1Q2019 Change 1Q2019 Change 1Q2019 Change
1Q19 Brokerage Metrics (in thousands)
Number of accounts 3 623 81% 5,089 43% 11,763 74% 11,787 19%
4
Client equity (in billions) $148 111% $341 64% $1,297 82% $3,585 40%
Average commission per DART (actual ) $3.68 -5% $7.17 -34% $7.01 -40% $7.19 -37%
Average client equity per account $237 16% $67 14% $110 5% $304 17%
Total DARTs 848 13% 279 74% 860 69% 418 27%
DARTs per account (actual, annualized ) 311 -39% 14 -39% 18 -3% 9 7%
Number of employees 1,458 31% 4,105 14% 9,515 62% 20,000 28%
Trailing 12 Months' Financials ($ in millions)
Revenues per employee $1.4 $0.7 $0.6 $0.5
Compensation per employee (in thousands) $196 $161 $136 $164
Total pretax profit 5 $1,192 $1,476 $2,658 $4,824
Pretax profit margin 5 63% 51% 46% 46%
(1) E*Trade bought Trust Co. of America and 1 million Capital One accounts, 2018
(2) Ameritrade bought Scottrade, 2017
(3) E*Trade and Charles Schwab are brokerage accounts only
(4) Charles Schwab’s client equity includes all client assets
(5) Interactive Brokers pretax profit is adjusted for currency diversification, one-time gains and Treasury marks-to-market
12Cost Comparison
Rated as “Low Cost Broker” 18 years in a row by Barron’s1
US Margin Loan Rates Comparison2 Commission Rates Comparison3
$25K $300K $1.5M $3.5M Equity Trades Option Trades Futures Trades
exchange &
$6.95 base
E-Trade 10.50% 9.00% 7.50% 7.50% $6.95 regulatory fees plus
+ $0.75 per contract
$1.50
$4.95 base
Fidelity 9.32% 8.07% 5.50% 5.50% $4.95 NA
+ $0.65 per contract
exchange &
$0 base cost
Interactive Brokers 2 3.90% 3.56% 3.26% 3.02% $2.34 regulatory fees plus
+ $0.68 per contract
$0.25 - $0.85
exchange &
$4.95 base
Schwab 9.32% 8.07% NA NA $4.95 regulatory fees plus
+ $0.65 per contract
$1.50
exchange &
$6.95 base
TD Ameritrade 10.25% 8.75% 8.00% 8.00% $6.95 regulatory fees plus
+ $0.75 per contract
$2.25
_______________________________________________________________________________________________________
1Low Cost Broker 2002 through 2019 according to Barron’s “Annual Best Online Brokers - “Best Online Brokers of 2019.“ For
additional information, see ibkr.com/awards. Barron’s is a registered trademark of Dow Jones & Co. Inc.
2 IBKRcalculates the interest charged on margin loans using the applicable rates for each interest rate tier listed on its website.
For additional information, see ibkr.com/interest
3 Rates were obtained on May 6, 2019 from each firm’s website and are subject to change without notice. Services vary by firm.
The IBKR commission rates shown for equity and option trades are the average of the client commissions for trades executed in
April 2019 and are subject to minimums and maximums as shown on the IBKR website. For more information, see
ibkr.com/compare
13Integrated Investment Management from One Account
EARN BORROW SPEND INVEST
Earn Market Rate Borrow against your Spend using our Bill Invest in stocks,
Interest on idle cash account whenever Pay to pay any options, futures,
balances and earn needed at our expense, or use our commodities, forex
income on securities by extremely low, market- Debit Mastercard to and fixed income on
lending out fully paid based rates. make purchases over 120 global
shares. anywhere. exchanges at low
cost.2
Directly deposit your
paycheck and instantly
earn high interest.1
Use our Insured Bank
Deposit Sweep
Program to get up to
$2.75 million of SIPC
and FDIC insurance on 1) Credit interest as of 5/6/2019. USD credit interest is paid on balances
over USD 10,000 in securities accounts. For more information, see
the cash in your ibkr.com/interest.
2) According to Barron’s “Annual Best Online Brokers - “Best Online
accounts, and still earn Brokers of 2019.“ For complete information, see ibkr.com/info.
the same market rate
interest.Security and Confidence
Financial Strength
• Strong and growing balance sheet, with
$7.4 billion equity capital and no debt
• $1.2 billion in pre-tax profit in 2018
Security
• Real-time margining system risk-manages
all client accounts continuously
• Automated controls allow us to provide the
highest level of client asset protection
Client Data
• Secure Login System allows clients to
trade and manage their accounts in a
protected environment
• Two-factor authentication to confirm
identity at point of login
• Mobile App uses IB Key, our two-factor
security system that includes Fingerprint
and Face ID in place of a physical device
• Encrypted communications for sensitive
client data
15No Selling of Customer Order Flow
• For most brokers, PFOF has become a large component of revenues.
• IBKR does not disadvantage clients by selling their order flow.
Payment for Order Flow – by e-Broker*
* Interactive Brokers’ PFOF is not from selling orders to high frequency traders, but solely from exchanges offering
compensation for orders that provide or take liquidity and that give customers an improved price on their order.
Robinhood estimate from Alphacution Research.
16Recent Enhancements and New Products
Portfolio Checkup – PortfolioAnalyst now lets you combine data from
your IBKR account with held-away accounts for a complete portfolio view.
This includes our new Portfolio Checkup, a powerful analytics tool for
understanding the health of your complete portfolio. Assets held
anywhere, including at banks and managers, can be uploaded and the
entire client financial portfolio analyzed.
Mutual Fund/ETF Parser – the Parser categorizes the individual
component stocks within mutual funds and ETFs. Customers can get an
accurate, granular picture of their overall exposure to asset classes,
industry sectors, and companies.
SYEP in Canada – Interactive Brokers Canada clients participating in our
Stock Yield Enhancement Program can now earn extra income by lending
Canadian fully-paid shares as part of the program.
17Investors Marketplace
Introductions to More than Capital
Interactive Brokers clients can reach hundreds of thousands of individual
and institutional investors worldwide, and find service providers among
the over 1,500 listed that can help grow their businesses.
Business
Investing Research Technology Administration
Development
Advisors Research Software Vendors Administrators Advertising Firms
Education & Programming
Hedge Funds Auditing Firms Business Analysts
Coaches Consultants
Compliance
Money Managers News Feeds Careers
Firms
Trading Corporate Access
Brokers Legal Firms
Publications Providers
Tax Firms
18Recognized Industry Leader
IB’s multiple trading platforms, extensive suite of advanced trading tools, algos
and order types continue to earn awards, year after year.
2019 Investopedia Awards:
Best Overall
2019 Barron’s Awards1: Best for Low Costs
Interactive Brokers was Rated #1 – Best Online Broker Best for International Trading
Rated 4.5 for Best for Mobile Traders Best for Options Trading
Rated 5 for Best for International Traders
Rated 4.5 for Best for Frequent Traders
2019 ForExBrokers.com Awards:
Rated #1 for Professionals
2019 Stockbrokers.com Awards:
Rated #1 for Commissions and Fees
Rated #1 for Offering of Investments
Rated #1 for Active Trading
Rated #1 for Professional Trading 2019 NerdWallet Awards:
Best for Active Investors
2019 Investor’s Business Daily Awards:
Rated #1 for Low Commissions and Fees
Rated #1 for Mobile Trading Platform/Apps 2019 HFM Week US Hedge Fund Services Awards:
Rated #1 for Range of Products Best Mobile Application
Rated #1 for Website Security
2019 HFM Week European Hedge Fund Services Awards:
Best Prime Broker – Technology
19 1 Barron’s is a registered trademark of Dow Jones & Co. Inc.You can also read