Interpreting Twitter User Geolocation - Association for ...
←
→
Page content transcription
If your browser does not render page correctly, please read the page content below
Interpreting Twitter User Geolocation
Ting Zhong1 , Tianliang Wang1 , Fan Zhou1† , Goce Trajcevski2 , Kunpeng Zhang3 , Yi Yang4
              1
                University of Electronic Science and Technology of China, China
                             2
                               Iowa State University, Ames, IA, USA
                          3
                            University of Maryland, College Park, USA
            4
              The Hong Kong University of Science and Technology, Hong Kong
                        †
                          Corresponding author: fan.zhou@uestc.edu.cn

                      Abstract                               multi-aspect information, especially the user men-
                                                             tion/interaction network to boost the performance
    Identifying user geolocation in online social            of geolocation identification (Rahimi et al., 2015;
    networks is an essential task in many location-
                                                             Do et al., 2017; Rahimi et al., 2017, 2018; Hamouni
    based applications. Existing methods rely
    on the similarity of text and network struc-
                                                             et al., 2019). For example, (Rahimi et al., 2018;
    ture, however, they suffer from a lack of inter-         Wu et al., 2019) employ Graph Convolutional Net-
    pretability on the corresponding results, which          works (GCNs) (Kipf and Welling, 2017) or sim-
    is crucial for understanding model behavior.             plified GCN (Wu et al., 2019) to learn network
    In this work, we adopt influence functions to            structures for user geolocation. In addition, graph
    interpret the behavior of GNN-based models               representation-based methods (Tang et al., 2015;
    by identifying the importance of training users          Grover and Leskovec, 2016; Kipf and Welling,
    when predicting the locations of the testing
                                                             2017; Hamilton et al., 2017; Qiu et al., 2018) have
    users. This methodology helps with providing
    meaningful explanations on prediction results.           also been widely used for user geolocation (Do
    Furthermore, it also initiates an attempt to un-         et al., 2017; Miura et al., 2017; Rahimi et al., 2018;
    cover the so-called “black-box” GNN-based                Hamouni et al., 2019; Huang and Carley, 2019).
    models by investigating the effect of individ-              However, the existing methods lack model trans-
    ual nodes.                                               parency and fail to provide meaningful explana-
                                                             tions regarding the model behavior and prediction
1   Introduction
                                                             results, which prevents them from safety-critical
Identifying geographic locations of users in online          applications. For example, when locating an emer-
social networks (OSN) has become a key Internet              gency for a specific region, it would be more mean-
service for many downstream applications, includ-            ingful to explain why such prediction is made,
ing location-based targeted advertising, emergency           rather than simply presenting numerical ranking
location identification, political election campaign,        values.
local event/place recommendation, natural disas-                To address such limitations, we propose a gen-
ter response, and remediation, etc. (Zheng et al.,           eral framework to explain the behavior of user ge-
2018). As such, the problem of user geolocation              olocation models and the prediction results, by uti-
(UG) has received a great deal of research attention         lizing the influence function (Hampel et al., 2011;
in the past decade (Han et al., 2012; Do et al., 2017;       Koh and Liang, 2017) to quantify the impact of
Miura et al., 2017; Rahimi et al., 2018; Bakerman            in-network users on the predicted outcome. The
et al., 2018).                                               main assumption is that the prediction results from
   Earlier efforts (Amitay et al., 2004; Wing and            a trained geolocation model are typically affected
Baldridge, 2011; Han et al., 2012; Roller et al.,            by the knowledge learned from training data (i.e.,
2012; Ahmed et al., 2013; Han et al., 2014; Chong            all in-network users and their associated attributes).
and Lim, 2017) mainly focused on extracting in-              We demonstrate that the user geolocation (espe-
dicative information from user-posted contents.              cially) for the network-based methods, is largely
These approaches rely on informative words that              dominated by the geographical locations of the 1-
can link users to their specific locations via vari-         hop neighboring nodes. This finding, on the one
ous natural language processing techniques such              hand, enables demystification of the model behav-
as topic modeling and other statistical models.              ior and quantitative measuring of the influence of
More recently, researchers aimed at incorporating            individual users (both 1-hop and high-order prox-

                                                         853
        Proceedings of the 58th Annual Meeting of the Association for Computational Linguistics, pages 853–859
                          July 5 - 10, 2020. c 2020 Association for Computational Linguistics
imity nodes); and on the other hand, provides in- 2017; Wu et al., 2019) for user representation learn-
terpretation on the predicted locations for down- ing. In spite of the superior performance, GNNs
stream applications/decision makers – which, in (including those used for user geolocation) (Rahimi
turn, points out a direction to further improve the et al., 2018; Wu et al., 2019) model the process of
model. learning and prediction in a “black-box” manner
and, consequently, are limited in terms of inter-
2 Preliminaries pretability. Therefore, it is important to understand
how the model learns the data and why a particular
The User geolocation problem is defined as pre-
prediction is made. To demystify the geolocation
dicting the user’s “home” location (Zheng et al.,
models, we intend to uncover and explain the train-
2018). Since each location is described by a (lon-
ing process and prediction outcomes.
gitude, latitude) pair, the task can be converted
into a typical classification problem where the There has been a growing interest to explain the
labels/categories are region ids obtained through model behavior and the predicted outcomes in the
some space-partitioning methods, such as k-d trees, area of neural networks. In particular, an influ-
that divides the surface of the earth into closed and ence function (Cook and Weisberg, 1980; Hampel
non-overlapping regions. Each user is associated et al., 2011) is used to estimate the effect of in-
with one (and only one) region-label that she/he dividual training sample and interpret the results
belongs to. We use one-hot encoding to denote made by a specific model. While providing an ele-
each label y ∈ R1×c , where c is the number of gant post-training interpretation, computationally-
regions. The user geolocation task thus becomes prohibitive cost of repeatedly retraining the model
one of identifying the geographical locations, given is avoided, spurring wide uses in a range of appli-
the user tweet contents X and the mention network cations, including image classification (Koh and
G. Liang, 2017), group effect (Koh et al., 2019), rec-
Graph Neural Networks (GNNs) (Bruna et al., ommendation (Cheng et al., 2019), etc. However,
2014; Defferrard et al., 2016; Kipf and Welling, whether influence functions can be applied to GNN-
2017; Hamilton et al., 2017; Velickovic et al., 2018; based models remained unclear. We take a step to-
Ying et al., 2018; Xu et al., 2019; You et al., 2019) wards bridging this gap by tracing the geolocation
are powerful tools of representation learning for results from the GNN-based models back to the
graph data, which has received increasing attention important nodes in the mention network.
over the past several years (Zhou et al., 2018; Wu Specifically, let z1 , . . . , zm denote the m training
et al., 2020). The main idea is that, given a network samples (nodes in the mention network G), where
G = (V, E) with attributes xv ∈ X for every node each zi = (xi , yi ) is an attribute vector of i-th
v (v ∈ V), a general GNN is to learn a vector node and its label. Removing one sample z from
representation of node v by: the training set can change the model optimal pa-
rameters from θ∗ to θ−z ∗ , where θ ∗ and θ ∗ is the
−z
θ2 (k−1) θ1
x(k)
(k−1)
v = fM x v , fA x u u ∈ N (v) , set of optimal parameters with and without the sam-
ple z, respectively. And θ−z ∗ can be obtained by:
def
∗ = arg min
where θ1 and θ2 are trainable parameters, and N (v)
P
θ−z θ∈Θ zi 6=z `(zi , θ), where `(zi , θ)
indicates the neighboring nodes of node v. Specifi- is the loss of sample zi . To estimate the influence
cally, fAθ1 aggregates information from neighbors, of every removed training sample z and avoid re-
θ2
fM merges the node representations from step training the model, Koh et al. (Koh and Liang,
k − 1 with the computed neighborhood informa- 2017) use an influence function strategy to effi-
tion. Both fAθ1 and fM θ2
can be arbitrary differen- ciently approximate this behavior. The basic idea
tiable, permutation-invariant functions (e.g., neural is to compute the change of optimal parameters if z
networks) (Rahimi et al., 2018; Wu et al., 2019). was upweighted by some small , which gives the
new parameters:
3 Interpreting Geolocation Results
m
Previous works (Rahimi et al., 2015; Do et al., ∗ def 1 X
θ,z = arg min `(zi , θ) + `(z, θ), (1)
2017; Hamouni et al., 2019) typically leverage θ∈Θ m
i=1
graph embedding methods (Grover and Leskovec,
2016; Kipf and Welling, 2017; Hamilton et al., where the influence of upweighting z on the param-
854eters θ∗ is given by: code1 , where the tweet content is fed into a GNN
∗ as the node attribute. For MLP, we use node2vec to
def ∂θ,z
Iup,θ∗ (z) = = −H−1 ∗
θ∗ 5θ `(z, θ ), (2)
generate node representations. Note that we follow
∂ =0 the evaluation metrics used by previous works.
def
1 Pm 2 ∗ We used two real-world Twitter datasets for
Hθ∗ = m i=1 5θ `(zi , θ ) is the Hessian matrix, evaluation: GeoText (Eisenstein et al., 2010) and
and Eq. (2) shows that removing z is the same as
1 Twitter-US (Roller et al., 2012). Their descriptive
upweighting it by = − m . Thus, we can linearly
statistics are shown in Table 1.
approximate the parameter change of removing z
∗ − θ∗ ≈ − 1 I
as θ−z m up,θ (z) without retraining the
∗ Dataset # Train # Val # Test # Label
model. The influence of upweighting a training GeoText 5,685 1,895 1,895 129
node z on the loss for a testing node ztest can then Twitter-US 429,200 10,000 10,000 256
be calculated according to the chain rule:
Table 1: Descriptive statistics of datasets.
∗ )
∂`(ztest , θ,z
def
I up,loss (z, ztest ) =
∂ =0
∗
∂θ,z GeoText Twitter-US
= 5θ `(ztest , θ∗ )| Method
Mean Median Acc@161 Mean Median Acc@161
∂ =0
GCN 546 45 60.1 485 71 62.3
= − 5θ `(ztest , θ∗ )| H−1 ∗
θ∗ 5θ `(z, θ ). (3) SGC 531 40 61.1 479 70 62.5
MLP 555 46 60.2 545 86 59.6
To speed up the computation, we use implicit
Table 2: Performance comparison.
Hessian-vector products (HVPs) to approximate
def
wtest = H−1 ∗
θ∗ 5θ `(ztest , θ ), and Eq. (3) can be
rewritten as Iup,loss (z, ztest ) = −wtest 5θ `(z, θ∗ ). 4.2 Interpretable Results
Since the Hessian Hθ∗ is positive semi-definite by
Before explaining the results, we compare the per-
assumption, we have:
formance of SGC, MLP and GCN (Rahimi et al.,
1 | 2018)2 models as shown in Table 2. First of all,
wtest ≡ arg min β Hθ∗ β − 5θ `(ztest , θ∗ )| β ,
β 2 all three models can achieve similar performance
results. While SGC performs slightly better, its
where the exact solution β can be obtained with
superiority is not obvious compared to other GNN-
conjugate gradients requiring only the evaluation
based models and even the simple MLP model.
of Hθ∗ β instead of explicitly computing H−1 θ∗ . We This result implies that the improvement of UG
refer the reader to (Koh and Liang, 2017) for more
results is limited even with the most advanced
detailed explanations on this topic, where the appli-
GNN-based models, at least on the two widely
cation of influence functions in computer vision is
used benchmark datasets. Next, we turn to explain
investigated. Note that the above method does not
the results made by the SGC and MLP models. We
depend on a specific GNN implementation, i.e., it
omit other GCN-based models due to the limited
can be easily adapted to any GNN models.
space.
4 Experiments Influence of n-hop neighbors. For each test
We now discuss in detail our experimental findings. node, we average the influence value of the n-hop
(n = 1, 2, 3) training neighbors in the mention net-
4.1 Datasets and Models work. As Figure 1 illustrates, 1-hop nodes usually
We investigate the interpretability of two user ge- have more positive influence on the test sample,
olocation models: (1) SGC (Wu et al., 2019), which while in contrast, the influence of 2-hop and 3-hop
is a simplified GCN that removes the non-linearity neighbors is relatively smaller. This is an intuitive
in each layer of GCN and has achieved state-of-the- interpretation of the geolocation results, but it ver-
art performance for user geolocation. (2) A simple ifies the effect of network-view modeling in user
MLP model which combines the embedding of geolocation (Rahimi et al., 2015; Do et al., 2017;
user-posted content and the node embedding for 1
https://github.com/Tiiiger/SGC
UG prediction. Here, we use doc2vec for user con- 2
We used the implementation of GCN for geolocation
tent embedding. For SGC, we use the published provided by https://github.com/afshinrahimi/geographconv
8550.2
1-hop 60 Positive
2-hop Overall
Avg. Influence 3-hop Negative
0.1
Acc@161
40
0.0 20
0 600 1200 1800
Index of testing nodes
0
(a) SGC SGC MLP
(a) Overall vs. Positive vs. Negative.
2 1-hop
2-hop
3-hop
MLP
Avg. Influence
1
SGC
Avg. Influence
0.2
0
0 600 1200 1800 0.1
Index of testing nodes
(b) MLP
0.0
Figure 1: The influence of n-hop neighbors.
100 101 102 103
(b) Impact of distance.
Hamouni et al., 2019), i.e., the immediate neigh- Figure 2: (a) Overall performance vs. using only pos-
bors can largely contribute to the user geolocation. itive influence nodes vs. using only negative influence
By comparing the results between SGC and nodes of GeoText; (b) Average influence varies with
MLP, we have the following observations. First, distance (KM) between training and testing samples of
SGC is more sensitive to training samples, e.g., the GeoText.
influence value of SGC (y-axis) is far smaller than
MLP. This is caused by the difference of funda-
the inferior performance of MLP. To verify this
mental training paradigms between SGC and MLP,
assumption, we scrutinize the prediction results of
i.e., SGC is a GNN-based model which considers
these nodes. As shown in Figure 2(a), where the
the tweet content as attributes, but MLP embeds
accuracy of predicting these nodes in MLP is sig-
the tweet content and nodes independently. There-
nificantly lower than in SGC, which confirms our
fore, a small change (removing a node) in SGC
hypothesis and gives promising explanations on
may incur significant influence on testing results.
the classification error, i.e., the low classification
This result also implies that GNN-based models
accuracy might be caused by those nodes whose
are more vulnerable to adversarial attacks, which is
n-hop influence are negative (cf. Figure 1).
problematic for all existing GNN-based models as
observed in recent works (Zügner and Günnemann, Influence of geographic distance. We also
2019a,b). quantify the influence of geographic distance be-
Second, for some nodes (indexed by x-axis) the tween training samples and testing samples. As
average influence of their n-hop neighbors is nega- Figure 2(b) shows, the close training data (e.g.,
tive, i.e., those data points that value are below 0. less than 10KM) have higher impacts on locating
An interesting phenomena is that there are more users. However, the influence significantly drops
such nodes for MLP as compared to SGC. We hy- with distance greater than 10KM. In another word,
pothesize that these nodes are the main reason of geographically far nodes (beyond a threshold) may
8565 Conclusion
In this work, we presented a framework for ex-
plaining the GNN-based models by extending the
influence function to estimate the effect of samples
in graph data. The experiments conducted on a
specific task – user geolocation – provided intu-
itive explanations and enabled quantification of the
influence of individual training samples. Some in-
teresting observations include the effects of regions
and the sensitivity of GNN-based models, which
open potentials for further improvements that we
(a) SGC
plan to address in our future work.
Acknowledgement
This work was supported by the National Natural
Science of China under Grant No.61602097 and
No.61472064, and NSF grant CNS 1646107.
References
Amr Ahmed, Liangjie Hong, and Alexander J Smola.
2013. Hierarchical geographical modeling of user
locations from social media posts. In Proceedings of
the 22th International World Wide Web Conference,
(b) MLP pages 25–36.
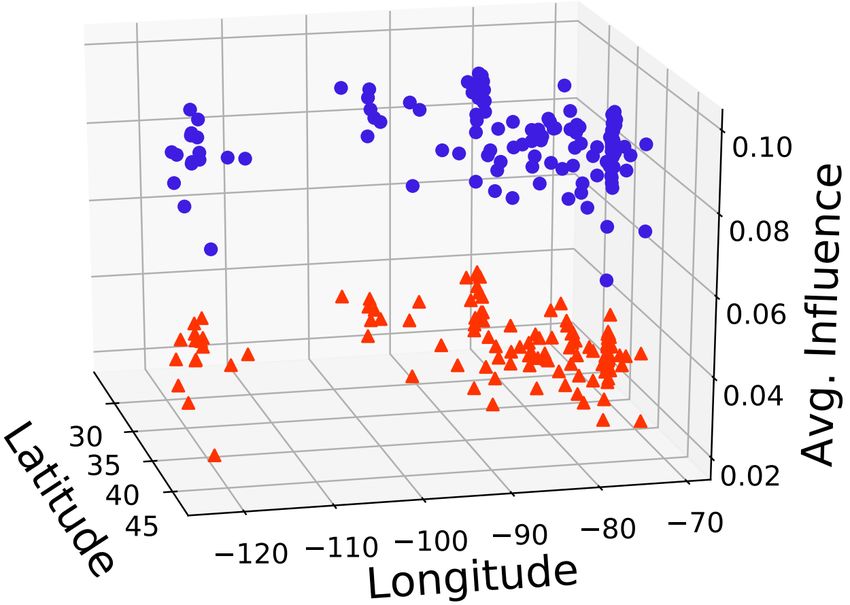
Figure 3: Visualization of the influence on all regions Einat Amitay, Nadav Har’El, Ron Sivan, and Aya
of GeoText. Upper cluster: the impact of in-region sam- Soffer. 2004. Web-a-where: geotagging web con-
ples; Bottom cluster: the impact of out-region samples. tent. In The International Conference on Research
and Development in Information Retrieval (SIGIR),
pages 273–280. ACM.
Jordan Bakerman, Karl Pazdernik, Alyson Wilson, Ge-
have less impact on geolocating a user. offrey Fairchild, and Rian Bahran. 2018. Twitter ge-
olocation: A hybrid approach. ACM Transactions
on Knowledge Discovery from Data, 12(3):34.
Influence of regions. It is of interest to investi- Joan Bruna, Wojciech Zaremba, Arthur Szlam, and
gate the effect of regions on the user geolocation. Yann LeCun. 2014. Spectral networks and locally
connected networks on graphs. In Proceedings of
The most important assumption in user geoloca- the International Conference on Learning Represen-
tion is that geographically similar users should be tations.
topologically proximal. To quantify this assump-
Weiyu Cheng, Yanyan Shen, Linpeng Huang, and
tion, for each region, we treat the training samples Yanmin Zhu. 2019. Incorporating interpretability
within this region as in-region nodes, and those out into latent factor models via fast influence analy-
of it as out-region nodes. By calculating the mean sis. In Proceedings of the 25th ACM SIGKDD Inter-
influence of in-region and out-region samples for national Conference on Knowledge Discovery and
Data Mining, pages 885–893.
each test user, we can measure the influence of
different regions. As Figure 3 shows, in-region Wen-Haw Chong and Ee-Peng Lim. 2017. Tweet ge-
samples (positive samples) have more significantly olocation: Leveraging location, user and peer sig-
nals. In Proceedings of the 2017 ACM on Confer-
positive influence than out-region samples (nega- ence on Information and Knowledge Management,
tive samples). This result not only consolidates pages 1279–1288. ACM.
the motivation of most multi-view user geolocation
R Dennis Cook and Sanford Weisberg. 1980. Char-
models, but also suggests an important direction acterizations of an empirical influence function for
for improving the geolocation performance, i.e., detecting influential cases in regression. Technomet-
paying more attention to the in-region samples. rics, 22(4):495–508.
857Michaël Defferrard, Xavier Bresson, and Pierre Van- Pang Wei W Koh, Kai-Siang Ang, Hubert Teo, and
dergheynst. 2016. Convolutional neural networks Percy S Liang. 2019. On the accuracy of influence
on graphs with fast localized spectral filtering. In functions for measuring group effects. In Advances
Advances in neural information processing systems, in Neural Information Processing Systems, pages
pages 3844–3852. 5255–5265.
Tien Huu Do, Duc Minh Nguyen, Evaggelia Tsili- Yasuhide Miura, Motoki Taniguchi, Tomoki Taniguchi,
gianni, Bruno Cornelis, and Nikos Deligiannis. and Tomoko Ohkuma. 2017. Unifying text, meta-
2017. Multiview deep learning for predicting twit- data, and user network representations with a neural
ter users’ location. Computing Research Repository, network for geolocation prediction. In Proceedings
arXiv:1712.08091. Version 1. of the 55th Annual Meeting of the Association for
Computational Linguistics, pages 1260–1272.
Jacob Eisenstein, Brendan O’Connor, Noah A Smith,
and Eric P Xing. 2010. A latent variable model for Jiezhong Qiu, Yuxiao Dong, Hao Ma, Jian Li, Kuansan
geographic lexical variation. In Proceedings of the Wang, and Jie Tang. 2018. Network embedding as
48th Annual Meeting of the Association for Compu- matrix factorization: Unifying deepwalk, line, pte,
tational Linguistics, pages 1277–1287. and node2vec. In Proceedings of the Eleventh ACM
Aditya Grover and Jure Leskovec. 2016. node2vec: International Conference on Web Search and Data
Scalable feature learning for networks. In Proceed- Mining, pages 459–467. ACM.
ings of the 22th ACM SIGKDD International Con-
Afshin Rahimi, Trevor Cohn, and Timothy Baldwin.
ference on Knowledge Discovery and Data Mining,
2015. Twitter user geolocation using a unified text
pages 855–864.
and network prediction model. In Proceedings of the
Will Hamilton, Zhitao Ying, and Jure Leskovec. 2017. 53th Annual Meeting of the Association for Compu-
Inductive representation learning on large graphs. In tational Linguistics, pages 630–636.
Advances in Neural Information Processing Systems,
pages 1024–1034. Afshin Rahimi, Trevor Cohn, and Timothy Baldwin.
2017. A neural model for user geolocation and lexi-
Parham Hamouni, Taraneh Khazaei, and Ehsan Amja- cal dialectology. In Proceedings of the Annual Meet-
dian. 2019. Tf-mf: Improving multiview representa- ing of the Association for Computational Linguistics,
tion for twitter user geolocation prediction. In Pro- pages 209–216.
ceedings of the 2019 IEEE/ACM International Con-
ference on Advances in Social Networks Analysis Afshin Rahimi, Trevor Cohn, and Timothy Baldwin.
and Mining. 2018. Semi-supervised user geolocation via graph
convolutional networks. In Proceedings of the 56th
Frank R Hampel, Elvezio M Ronchetti, Peter J Annual Meeting of the Association for Computa-
Rousseeuw, and Werner A Stahel. 2011. Robust tional Linguistics, pages 2009–2019.
statistics: the approach based on influence functions,
volume 196. John Wiley & Sons. Stephen Roller, Michael Speriosu, Sarat Rallapalli,
Benjamin Wing, and Jason Baldridge. 2012. Super-
Bo Han, Paul Cook, and Timothy Baldwin. 2012. Ge- vised text-based geolocation using language models
olocation prediction in social media data by find- on an adaptive grid. In Proceedings of the 50th An-
ing location indicative words. In Proceedings of nual Meeting of the Association for Computational
the 24th International Conference on Computational Linguistics, pages 1500–1510.
Linguistics, pages 1045–1062.
Jian Tang, Meng Qu, Mingzhe Wang, Ming Zhang, Jun
Bo Han, Paul Cook, and Timothy Baldwin. 2014. Text-
Yan, and Qiaozhu Mei. 2015. Line: Large-scale
based twitter user geolocation prediction. Journal of
information network embedding. In Proceedings
Artificial Intelligence Research, 49:451–500.
of the 24th international conference on world wide
Binxuan Huang and Kathleen M Carley. 2019. A hier- web, pages 1067–1077.
archical location prediction neural network for twit-
ter user geolocation. In Proceedings of the 2019 Petar Velickovic, Guillem Cucurull, Arantxa Casanova,
Conference on Empirical Methods in Natural Lan- Adriana Romero, Pietro Liò, and Yoshua Bengio.
guage Processing and the 9th International Joint 2018. Graph attention networks. In Proceedings of
Conference on Natural Language Processing. the International Conference on Learning Represen-
tations.
Thomas N Kipf and Max Welling. 2017. Semi-
supervised classification with graph convolutional Benjamin P Wing and Jason Baldridge. 2011. Sim-
networks. In Proceedings of the International Con- ple supervised document geolocation with geodesic
ference on Learning Representations. grids. In Proceedings of the 49th Annual Meet-
ing of the Association for Computational Linguistics,
Pang Wei Koh and Percy Liang. 2017. Understand- pages 955–964.
ing black-box predictions via influence functions. In
Proceedings of the 34th International Conference on Felix Wu, Amauri H. Souza Jr., Tianyi Zhang, Christo-
Machine Learning, pages 1885–1894. pher Fifty, Tao Yu, and Kilian Q. Weinberger. 2019.
858Simplifying graph convolutional networks. In Pro-
ceedings of the International Conference on Ma-
chine Learning, pages 6861–6871.
Zonghan Wu, Shirui Pan, Fengwen Chen, Guodong
Long, Chengqi Zhang, and S Yu Philip. 2020. A
comprehensive survey on graph neural networks.
IEEE Transactions on Neural Networks and Learn-
ing Systems.
Keyulu Xu, Weihua Hu, Jure Leskovec, and Stefanie
Jegelka. 2019. How powerful are graph neural net-
works? In Proceedings of the International Confer-
ence on Learning Representations.
Zhitao Ying, Jiaxuan You, Christopher Morris, Xiang
Ren, William L. Hamilton, and Jure Leskovec. 2018.
Hierarchical graph representation learning with dif-
ferentiable pooling. In Advances in Neural Informa-
tion Processing Systems, pages 4805–4815.
Jiaxuan You, Rex Ying, and Jure Leskovec. 2019.
Position-aware graph neural networks. In Proceed-
ings of the International Conference on Machine
Learning, pages 7134–7143.
Xin Zheng, Jialong Han, and Aixin Sun. 2018. A
survey of location prediction on twitter. IEEE
Transactions on Knowledge and Data Engineering,
30(9):1652–1671.
Jie Zhou, Ganqu Cui, Zhengyan Zhang, Cheng Yang,
Zhiyuan Liu, and Maosong Sun. 2018. Graph neu-
ral networks: A review of methods and applications.
Computing Research Repository, abs/1812.08434.
Version 4.
Daniel Zügner and Stephan Günnemann. 2019a. Ad-
versarial attacks on graph neural networks via meta
learning. In Proceedings of the International Con-
ference on Learning Representations.
Daniel Zügner and Stephan Günnemann. 2019b. Certi-
fiable robustness and robust training for graph con-
volutional networks. In Proceedings of the 25th
ACM SIGKDD International Conference on Knowl-
edge Discovery and Data Mining, pages 246–256.
859You can also read