Intra-Articular Injection of Hydrolyzed Collagen to Treat Symptoms of Knee Osteoarthritis. A Functional In Vitro Investigation and a Pilot ...
←
→
Page content transcription
If your browser does not render page correctly, please read the page content below
Article
Intra-Articular Injection of Hydrolyzed Collagen to
Treat Symptoms of Knee Osteoarthritis. A Functional
In Vitro Investigation and a Pilot Retrospective
Clinical Study
Paola De Luca 1,†, Alessandra Colombini 1,†, Giulia Carimati 2, Michelangelo Beggio 3,
Laura de Girolamo 1,* and Piero Volpi 2
 1 IRCCS Istituto Ortopedico Galeazzi, Via R. Galeazzi 4, 20161 Milano, Italy
 2 Istituto Clinico Humanitas, Via Alessandro Manzoni, 56, 20089 Rozzano Milano, Italy
 3 Policlinico San Marco, Via Francesco Zanotto, 40, 30173 Mestre, Italy

 * Correspondence: laura.degirolamo@grupposandonato.it; Tel.: +39 0266214069
 † These authors contributed equally to this work.

 Received: 30 May 2019; Accepted: 3 July 2019; Published: 4 July 2019

 Abstract: Among all joints affected, knee osteoarthritis has a prevalence of about 10% in men and
 13% in women over 60 years old. Knee osteoarthritis has high economic and social costs and may
 have a devastating impact on patient quality of life. Treatment of symptomatic knee Osteoarthritis
 may involve oral or topical administration of non-steroidal anti-inflammatory drugs or
 intra-articular injection of corticosteroids. Recently, a novel injectable collagen formulation
 (ChondroGrid) consisting of bovine hydrolyzed 70%. ChondroGrid may prompt chondrocytes to produce hyaline cartilage, prevent
 fibrous tissue formation, and be a safe and effective adjuvant to treat symptomatic knee
 osteoarthritis.

 Keywords: knee; osteoarthritis; hydrolyzed collagen; intra-articular injection; non-pharmacological
 therapy

J. Clin. Med. 2019, 8, 975; doi:10.3390/jcm8070975                                www.mdpi.com/journal/jcm
J. Clin. Med. 2019, 8, 975                                                                        2 of 13

1. Introduction
     Osteoarthritis (OA) is the most common musculoskeletal disorder [1] affecting both small and
large diarthrodial joints with the hand, hip, and knee being the most affected areas [2]. OA is a
disease predominantly affecting the aging population, and the number of those affected is expected
to increase in the coming decades [3]. Among all joints affected, knee OA has a prevalence of about
10% in men and 13% in women over 60 years old [4]. Knee OA has high economic and social costs
and may have a devastating impact on patient quality of life (QoL) [5,6]. Treatment of symptomatic
knee OA may involve oral or topical administration of non-steroidal anti-inflammatory drugs
(NSAIDs) or intra-articular injection of corticosteroids. Topical application of NSAIDs calls for
multiple daily application to show effectiveness, while oral NSAIDs administration and
intra-articular corticosteroid injection have a short-term effect and exhibit several side-effects [7–9].
This has led to investigations using non-pharmacological interventions alternatively to or in
combination with pharmacological treatments [2,10], including manual and physical therapies [11]
and viscosupplementation [12,13]. OA-affected joints exhibit a complex range of structural, tissue,
cellular, and biochemical changes. Inflammation mediators, such as IL-1α, IL-1β, TNF-β, and IL-6,
are expressed and they, in turn, activate cartilage-degrading enzymes, such as matrix
metalloproteinases (MMPs) and a disintegrin and a metalloproteinase with thrombospondin motifs
(ADAMTS) [1,14]. The activity of these enzymes leads to the progressive degradation of the
extracellular matrix (ECM), including collagen [15]. This observation has led to investigating if
exogenous administration of collagen may be beneficial to compensate for this OA-related event.
When animal or human synovial and cartilage cells were exposed to different collagen formulations,
having a different degree of hydrolyzation or polymerization, they increased the production of
hyaluronic acid, while decreasing the release of some inflammation mediators [16–18].
Intra-articular injections of a Gly-X-Y collagenic tripeptide in an animal model of osteoarthritis
significantly reduced the degradation of the articular cartilage and increased the number of
chondrocytes that tested positively to the synthesis of type II collagen [19]. Clinical investigations on
the safety and performance of hydrolyzed or polymerized collagen are still few, limited to two
randomized clinical trials on a few patients. The first, by Furuzawa-Carballeda et al. [20,21], showed
a statistically significant improvement on VAS, WOMAC, and Lequesne indexes after 12 bi-weekly
intra-articular injections of 2 ml (13.8 mg) pepsin-treated porcine polymerized, type I collagen versus
as many placebo injections. More recently, a double-blind randomized controlled clinical trial on 29
patients [22] showed no significant differences in VAS and Lequesne scores at 3 or 6 months after
treatment, in patients that were administered five intra-articular injections of 4 ml (concentration
unknown) 300 kDa type I hydrolyzed porcine collagen at 1-week intervals versus patients that were
given as many injections of 2.5 ml (25 mg) sodium hyaluronate. Recently, a novel injectable collagen
formulation (ChondroGrid (CG), Bioteck, Arcugnano, Italy) consisting of bovine hydrolyzed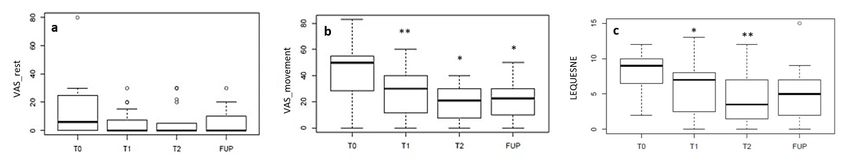
J. Clin. Med. 2019, 8, 975                                                                     3 of 13

2. Experimental Section

2.1. In Vitro Study

2.1.1. Isolation and Expansion of Human Articular Chondrocytes
     The study was approved by the Institutional Review Board (M-SPER-015, for use of waste
biological material), and specimens were collected under patient informed consent.
     Human articular chondrocytes were isolated by enzymatic digestion of articular cartilage
portions obtained during total hip arthroplasty from five donors (1 male and 4 women) with a mean
age of 50.6 ± 5.8, affected by Kellgren Lawrence grade IV osteoarthritis. The cartilage was harvested
with a scalpel from non-weight bearing superficial areas of femoral head, as previously reported
[23]; subsequently, the cartilage was cut in small pieces and digested with 0.15% (w/v) Type II
Collagenase (Worthington Biochemical Corporation, Lakewood, NJ, USA), for 22 hours at 37 °C
under stirring.
     The chondrocytes were seeded at a density of 5000 cells/cm2 in High Glucose (HG) Dulbecco’s
modified Eagle’s medium (DMEM) supplemented with 10% (v/v) FBS, 1% (v/v) 1M HEPES, 1% (v/v)
100 mM Sodium Pyruvate, 1% (v/v) 200 mM L-Glutamine, 1% 10.000 U/mL Penicillin, 10mg/ml
Streptomycin and 1% (v/v) 250 µg/mL Amphotericin B (namely complete medium) and incubated at
37 °C (all reagents from Thermofisher Scientific, Waltham, MA, USA).

2.1.2. IL-1β Treatment Protocol
    To simulate an inflammatory environment, after 48 hours in culture in complete medium, the
chondrocytes were treated for 48 hours with 1 ng/mL of IL-1β [14,24].

2.1.3. CG Treatment
     CG powder was dissolved in DMEM complete medium immediately before the treatment. The
cytotoxicity was evaluated assessing the effect of different doses of CG (0.5, 0.75, 1, and 1.5 mg/mL)
on the cells (5000/cm2) for three and six days, changing the medium at day 3 and repeating the CG
treatment. For gene expression analysis and cytokine evaluation (ELISA), the cells were treated for
48 hours with 1 mg/mL of CG in the presence or absence of 1 ng/mL of IL-1β. For histological
evaluation, the pellets were cultured with or without chondrogenic medium, in the presence or
absence of 1 mg/mL of CG.

2.1.4. Chondrogenic Differentiation in Pellet Culture
     After three passages in culture, 4x10⁵ chondrocytes were centrifuged (2 minutes at 232 g) and
maintained for 28 days in four different conditions: (1) complete medium (NT); (2) serum-free
complete medium supplemented with 1.25 mg/mL human serum albumin, 1 % ITS+1 (1 mg/mL
insulin from bovine pancreas, 0.55 mg/mL human transferrin, 0.5 µg/ mL sodium selenite, 50 mg/mL
bovine serum albumin, and 470 µg/mL linoleic acid), 0.1 µM dexamethasone, 0.1 mM L-ascorbic
acid-2-phosphate, and 10 ng/mL (all from Sigma-Aldrich s.r.l., St. Louis, MO, USA), TGFβ1
(Peprotech, Rocky Hill, NJ, USA), namely chondrogenic medium (C); (3) complete medium
supplemented with CG (NT+CG); 4) chondrogenic medium supplemented with CG (C+CG).

2.1.5. Viability Assay (Alamar Blue)
     Alamar Blue reagent (Invitrogen, Carlsbad, CA, USA) was used to evaluate the cytotoxicity of
different CG concentrations. The cells were seeded in 96-well plates (15000/cm2). After 24 hours, the
medium was removed from each well and replaced with fresh FBS-free medium, containing 10% v/v
Alamar Blue. Plates were incubated for 4 hours at 37 °C, and then the medium emission was
measured at 580 nm (excitation 540 nm) using a Victor X3 Plate Reader (Perkin Elmer, Waltham,
MA, USA).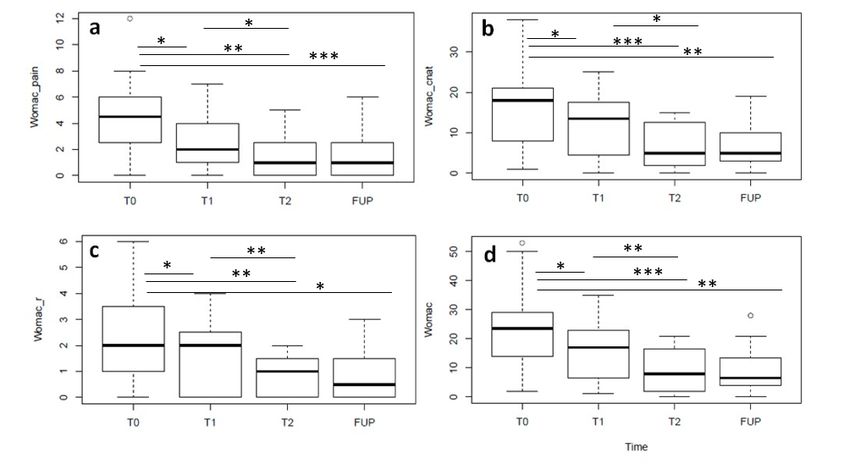
J. Clin. Med. 2019, 8, 975                                                                        4 of 13

2.1.6. Proliferation Assay (CyQuant)
     Cell proliferation was assessed using the CyQUANT® cell proliferation assay kit (Invitrogen,
Carlsbad, CA, USA) on the same cells used for viability assay. After the Alamar blue assay, the wells
were washed twice with PBS and then frozen at −80 °C. The cells were then thawed, and the
CyQUANT® GR dye/cell-lysis buffer was added to each sample well. After incubation for 2 to
5 minutes at room temperature (RT), protected from light, the sample fluorescence was measured
(excitation 480 nm, emission 520 nm).
     A standard calibration curve was done for both Alamar blue and the CyQUANT® assays using
a range of chondrocytes from 2500 to 35000 cells.

2.1.7. Gene Expression Analysis
     Total RNA was isolated from cell lysates using the PureLink® RNA Mini Kit (Thermo Fisher
Scientific, Waltham, MA, USA) and quantified spectrophotometrically by Nanodrop (Thermo Fisher
Scientific, Waltham, MA, USA).
     For each sample, 800 ng of cDNA was synthesized employing the iScript cDNA Synthesis Kit
(Bio-Rad Laboratories, Hercules, CA, USA). Gene expression was evaluated by real-time PCR
(StepOne Plus, Thermo Fisher Scientific, Waltham, MA, USA) and performed using TaqMan® Gene
Expression Assays (Thermo Fisher Scientific, Waltham, MA, USA).
     The expression of matrix metalloproteases MMP1, Hs00899658_m1, MMP3, Hs00968305_m1
and of their inhibitors TIMP1, Hs00171558_m1 and TIMP3, Hs00165949_m1 (Thermo Fisher
Scientific Waltham, MA, USA) was analyzed before and after IL-1β treatment.
     The normalization was performed using the validated housekeeping gene TBP,
Hs00427620_m1 (Thermo Fisher Scientific) [25]. Data were expressed according to the ΔCt method.

2.1.8. Determination of TGFβ1, IGF-1, and VEGF
      Levels of soluble TGFβ1, IGF-1, and VEGF were detected after 48 hours of treatment in culture
medium of cells untreated, treated with 1 ng/mL of IL-1β, and treated with 1 ng/mL of IL-1β + 1 mg/mL
of CG, by commercially available ELISA, according to the manufacturer’s protocols (PeproTech, Rocky
Hill, NJ, USA).

2.1.9. Histological Analysis
     Pellets were fixed with 10% neutral buffered formalin (Sigma-Aldrich, Gallarate, Milano, Italy),
embedded in paraffin, sectioned at 4 µm, and stained with hematoxylin and eosin to evaluate the
cell morphology. For semi-quantitative evaluation of Collagen I and Collagen II, the pellet sections were
incubated in Rabbit Monoclonal Anti-Collagen Type I, 1:4000 (ab138492, Abcam, Cambridge, CB4 0FL,
UK) and Rabbit Polyclonal Anti-Collagen II, 1:100 (ab34712, Abcam) primary antibodies diluted in
PBS-BT buffer (PBS buffer supplemented with 5% w/v bovine serum albumin). Sections were then
washed with PBS buffer and incubated for one hour with anti-rabbit IgG, (H+L) raised in goat,
biotinylated 1:200 (VC-BA-1000-MM15, Vector Laboratories, Burlingame, CA, USA). The Bern Score
visual grading system [26] was used for the assessment of the in vitro cartilaginous differentiation,
and immunostained sections were scored for the presence of type I and II collagen using a
semi-quantitative scoring system as follows: 0 = absence, 1 = mild, 2 = moderate, 3 = marked [27].

2.2. Retrospective Clinical Study
     Clinical records were selected among those of patients suffering from knee OA and referred to
the Knee Surgery and Sports Traumatology Unit, Humanitas Research Hospital, Milan, Italy and to
the Policlinico San Marco Hospital, Mestre, Italy. Patients included in this retrospective study
(a) were between 18 and 75 years old; (b) were suffering from Kellgren Lawrence [28] grade 1 to 4
knee OA, and (c) underwent treatment with CG according to its indications for use. Exclusion
criteria were (a) any disease that interfered with the assessment of knee symptom and function
indexes, such as fibromyalgia, Reiter’s syndrome, rheumatoid arthritis, and any other local or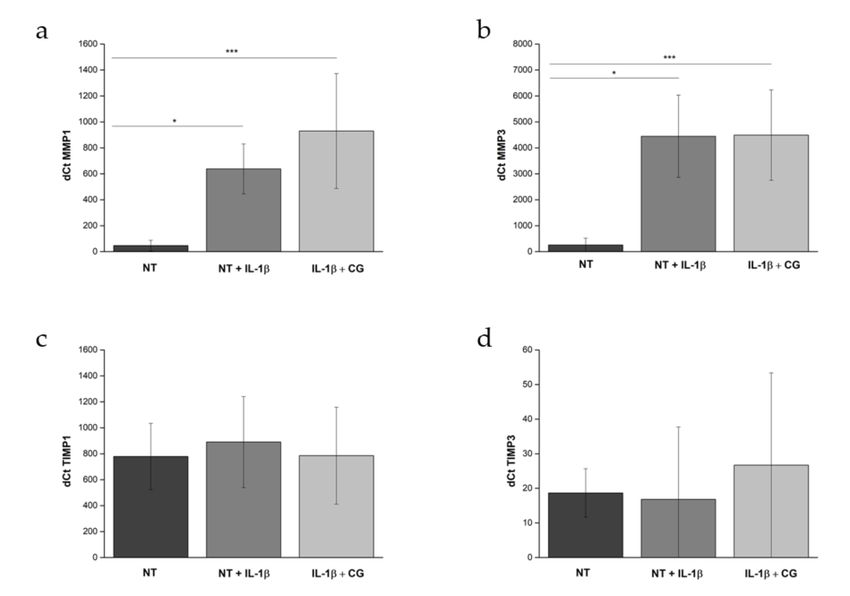
J. Clin. Med. 2019, 8, 975                                                                        5 of 13

systemic immune-mediated disease; (b) BMI ≥ 30; (c) clinical signs of knee infection and/or skin
disorders/issues affecting the target knee; (d) intra-articular injections of corticosteroids,
hyaluronate, or other formulations during the 3 months before the CG treatment and during the
follow-up; (e) surgery at the target knee during the 6 months prior to the CG treatment and during
the follow-up; (f) cancer, HIV, HCV; (g) drug or alcohol abuse. Clinical records analyzed in the study
reported complete anamnestic and demographic patient’s data; knee AP weight-bearing X-rays
collected before treatment; OA severity grade measured by the KL score; Lequesne indexes [29],
WOMAC scores [30], and subjective VAS scores, measured at rest and moving. All these data were
collected just before the first injection (baseline/T0), and then at the second (T1) and the third (T2)
CG injections, as well as 6 months after the third CG injection (FUP).
     All patients provided their informed consent to treatment with CG. No ethical committee
approval was sought for this study given its retrospective nature and the use of CG according to its
manufacturer’s indications for use.

2.3. Treatment
     The patients received three 2 mL (4mg) CG injections, the first two 15 days apart, and the third
one 30 days after the second. The CG injection was carried out according to a superolateral approach
to the patella. After injecting CG, the needle was removed, and a sterile gauze was applied over the
injection site.

2.4. Statistical Analysis
      Data collected in the in vitro part of this study were first checked for normality using
Kolmogorov–Smirnov and Shapiro–Wilk tests; as their distribution was found to be normal,
comparisons between the study endpoints measured under different cell culture conditions were
carried out using one-way ANOVA tests followed by pairwise comparisons using the Bonferroni
post-hoc test.
      Concerning the in vivo part of this investigation, statistical analysis was carried out as follows.
Patients’ demographic and characteristics at baseline were described by means of descriptive
statistics. To investigate if treatment with CG caused any change among scores collected at the
observation time points, distribution of VAS, Lequesne, and WOMAC total, pain, stiffness, and
physical function scores were first checked for normality using the Shapiro–Wilk test and, as the
distribution was found to be not normal for all of them, scores for each parameter at all different
time points were compared using a non-parametric ANOVA Friedman test, followed by pairwise
comparisons using the Wilcoxon signed rank test.
      The results of parametric tests are provided as mean ± standard deviation; the results of
non-parametric tests are provided as medians and the corresponding interquartile ranges (IQRs). All
statistical tests were regarded as significant if p < 0.05. All statistical calculations were performed
using standard statistical software programs (R System, Ver. 3.3.2 with RMS libraries, R Core Team,
2017 or GraphPad Prism v5.00; GraphPad software, La Jolla, CA, USA).

3. Results

3.1. In Vitro Assessment
     After articular cartilage processing, human chondrocytes obtained [23,31,32] were evaluated for
viability and proliferation after 3 and 6 days of exposure to different CG concentrations (Figure 1). A
significant difference with control (no CG) was observed only when the higher concentration
(1.5 mg/mL) was used for 6 days (p < 0.01 for viability and p < 0.05 for proliferation). No significant
difference was observed between values at 3 and 6 days at any CG concentration. As CG 1.5 mg/mL
was observed to affect viability and proliferation, all the following experiments were carried out
using CG 1 mg/mL.
J. Clin. Med. 2019, 8, 975 6 of 13
Figure 1. Human chondrocyte viability (left) and proliferation (right) at different CG concentrations.
CG 1.5 mg/mL induces a significant decrease in viability (** p ≤ 0.001) and proliferation (* p ≤ 0.05),
with respect to control (no CG) only after 6 days of treatment. No significant differences were
observed, at any concentration, between data collected at 3 and 6 days of exposure.
CG affected neither the expression of matrix-degrading enzymes (MMP1 and MMP3) nor that
of their inhibitors (TIMP1 and TIMP3) (Figure 2).
Figure 2. Expression of MMP1, MMP3, TIMP1, and TIMP3. An inflammatory response was induced
in chondrocytes by exposure to IL-1β. Consequent exposure to CG 1.0 mg/ml (IL-1β + CG) did not
induce a significant change in the expression of MMP1 (a), MMP3 (b), TIMP1 (c), TIMP3 (d). NT:
control (Not Treated). * p ≤ 0.05, *** p ≤ 0.001.
Moreover, CG did not induce any change in the release of the angiogenic VEGF (676.6 ± 185.7
NT, 1143 ± 233.2 NT + IL-1β and 1147 ± 383.5 IL-1β + CG), or the trophic TGFβ1 and IGF-I (under the
detection limits in all samples).
Irrespective of the culture medium, chondrocytes presented significantly smaller cell density
and greater matrix deposition in the presence of CG (Figure 3); the cells kept in the chondrogenicJ. Clin. Med. 2019, 8, 975 7 of 13
medium and cultured with CG also showed a significantly higher morphology score than controls,
having a more rounded shape (Table 1).
Figure 3. Human chondrocytes cultured under different conditions: NT, not treated; NT+CG, CG
1 mg/mL added; C, chondrogenic medium added; C+CG, chondrogenic medium, and CG
1 mg/mL added. Hematoxylin and eosin staining; bars of small pictures = 100 µm; bars of large
pictures =200 µm.
Table 1. Bern Scores of human chondrocytes.
A B
A+B
Treatment Cell density/matrix amount Cell morphology
(score 0–6)
(score 0–3) (score 0–3)
NT a 0.85 ± 0.76 0.4 ± 0.38 1.25 ± 1
NT+CG b 0.6 ± 0.57 0.75 ± 0.83 1.35 ± 1.28
Cc 2.5 ± 0.31***§§§ 2.10 ± 0.42 4.6 ± 0.63***§§§
C+CG d 2.05 ± 0.41*§§ 2.20 ± 0.45* 4.25 ± 0.77***§§§
aNT, not treated; b NT+CG, CG 1 mg/mL added; c C, chondrogenic medium; d C+CG, chondrogenic
medium and CG 1 mg/mL; *, vs. NT; §, vs. NT+CG; * or §, p < 0.05; ** or §§, p < 0.01; *** or §§§, p < 0.001.
When cells were cultured in a chondrogenic medium, they produced both type-I and type-II
collagen, whereas when CG was added, high deposition of type-II collagen and inhibition of type-I
collagen deposition were observed (Figure 4, Table 2).J. Clin. Med. 2019, 8, 975 8 of 13
Figure 4. Immunohistochemical analysis of human chondrocytes exposed to a chondrogenic
medium (C) or to a chondrogenic medium and CG 1 mg/mL (C + CG). Avidin-biotin detection
method. Bar = 100 µm. When chondrocytes were exposed to the chodrogenic medium only, type-I and
type-II collagen expression were not significantly different; when they were also exposed to CG
1.0 mg/mL, expression of type-I collagen was inhibited, and that of type-II collagen enhanced. * p ≤ 0.05.
Table 2. Data from immunohistochemical analysis of COL-1 and COL-2 production.
Treatment Collagen I Collagen II
Ca 2.45 ± 0.54 2.45 ± 0.11
C + CG b 1.31 ± 0.47* 2.94 ± 0.12*
a C, chondrogenic medium; b C+CG, chondrogenic medium and CG 1 mg/mL; * p ≤ 0.05.
3.2. Retrospective Clinical Study
The data about 20 non-consecutive patients (14 men and 6 women) with a mean age of 58.1 ± 11.1
(range 35 to 72) were analyzed (Table 3). None of the patients experienced any complications or side
effects following CG injections.
Table 3. Patient characteristics at baseline.
Parameter Mean ± SD or Y/N (%/%)
Age (years) 58.1 ± 11.1
Weight (kg) 76.5 ± 14.1
Height (cm) 173.7 ± 9
BMI (Kg/m2) 25.2 ± 3.3
KL score 1,2,3,4 (%) 4 (20); 11 (55); 3 (15); 3 (10)
M/F (%) 14/6 (70/30)
Diabetes Y/N (%) 2/18 (10/90)
Cardiovascular disorders Y/N (%) 7/13 (35/65)
Metabolic disorders Y/N (%) 4/16 (20/80)
Concomitant treatment Y/N (%) 11/9 (55/45)
Median VAS values at rest did not change significantly with respect to baseline after the CG
injections (p = 0.1). Median VAS values when moving decreased significantly after the first
injection (T1 vs. baseline, p = 0.01) but did not decrease further after the second injection (T2 vs.
T1, p = 0.07), and were stable at the 6-month follow-up (FUP vs. T2, p = 0.74) (Figure 5). TheJ. Clin. Med. 2019, 8, 975 9 of 13
median Lequesne index decreased significantly after the first injection (T1 vs. baseline, p = 0.01),
did not decrease further after the second injection (T2 vs. T1, p = 0.06), and was stable at the
6-month follow-up (FUP vs. T2, p = 0.58) (Figure 5).
Figure 5. VAS at rest (a), when moving (b) and Lequesne (c) scores. Median VAS at rest did not
change significantly after the CG injections. Median VAS when moving decreased significantly after
the first injection (T1 vs. baseline, p = 0.01) but did not decrease further after the second one (T2); the
median Lequesne decreased significantly after the first injection (T1 vs. baseline, p = 0.03), did not
decrease further after the second injection and was stable at the 6-month follow-up.
All four WOMAC sub scores median values were significantly lower at T1 than those at baseline
(T1 vs baseline: pain, p = 0.03; stiffness, p = 0.04; physical function, p = 0.04; total score, p = 0.03), and
median values at T2 were significantly lower than those at T1 (T2 vs. T1: pain, p = 0.03; stiffness, p = 0.04;
physical function, p = 0.001; total score, p < 0.001). For all WOMAC sub scores, median values at the
6-month follow-up were not significantly different from those at T2 (FUP vs. T2: pain, p = 0.94; stiffness,
p = 0.99; physical function, p = 0.76; total score, p = 0.86) (Figure 6). All the data are summarized in Table 4.
Figure 6. WOMAC pain (a), stiffness (b), physical function (c) sub scores and total WOMAC score (d).
For all scores, median values at T1 are significantly lower than those at baseline (T1 vs baseline: pain,
p = 0.03; stiffness, p = 0.04; physical function, p = 0.04; total score, p = 0.03), and median values at T2 are
significantly lower than those at T1 (T2 vs T1: pain, p = 0.03; stiffness, p = 0.04; physical function, p = 0.001;
total score, p < 0.001). For all scores, median values at the 6-month follow-up were not significantly
different than that at T2 and were stable at the 6-month follow-up.J. Clin. Med. 2019, 8, 975 10 of 13
Table 4. Median values at all time points for the parameters under consideration: VAS at rest and
when moving, Lequesne index, WOMAC sub scores concerning pain, stiffness and physical function
and total WOMAC score.
FUP
Baseline T1 T2
(about 6 FUP vs. Baseline
(before first (15 days after (30 days after
months after (%)
injection) first injection) first injection)
first injection)
Time (days) N/A 14.5.1 ± 2 22.9 ± 11.2 172.1 ± 22.7 N/A
VAS at rest 6 (22.5) 0 (6.25) 0 (5) 0 (10) −100%
VAS when moving 50 (23.25) 30 (27.75) 21 (21.25) 22.5 (20) −55%
Lequesne Index 9 (3.25) 7 (5.25) 3.5 (5.25) 5 (5) −44%
WOMAC (pain) 4.5 (3.25) 2 (3) 1 (2.25) 1 (2.25) −77.8%
WOMAC (stiffness) 2 (2.25) 2 (2.25) 1 (2.25) 0.5 (1.25) −75%
WOMAC (physical
18 (13) 13.5 (12.5) 5 (10.25) 5 (7) −72.2%
function)
WOMAC (Total) 23.5 (14.5) 17 (15.75) 8 (13.75) 6.5 (9.25) −72.3%
Time is provided as mean ± SD; all other values are provided as median (IQR).
4. Discussion
This study has investigated the in vitro and in vivo effects of intra-articular knee injection of
ChondroGrid (CG), consisting of bovine collagen hydrolyzed into 10 mL) [33,34], can never be reached in the
clinical setting. These results are in contrast with previous observations by Furuzawa et al. [17] who
exposed cartilage tissue from five patients with OA for 7 days to 1% (0.6 µg/mL, MW unknown)
porcine polymerized-collagen and observed a 3- to 6-fold increase in cell proliferation, but are
consistent with those by Nakatani et al. [35] who exposed ATDC5 cells, a murine chondrocyte cell
line, to porcine hydrolyzed collagen (1 mg/mL) with an average molecular weight of 5 kDa and did
not observe any effect on proliferation. These discrepancies might be ascribed to differences between
tissue and cell in vitro cultures and to the concentration as well as the molecular weight of the
different formulations; a recent investigation has shown that, in fact, collagen fragments of different
lengths may have different effects on cartilage metabolism [36]. In vitro results also demonstrated
that CG had no effect on the expression of two of the most common metalloproteinases associated
with knee OA, MMP1, and MMP3, nor on their corresponding inhibitors, TIMP1 and TIMP3.
Concerning TIMP1, these results are consistent with the observations by Furuzawa et al. [17], who
did not observe any TIMP1 up- or downregulation. This study, therefore, shows that, in the
conditions here tested (CH 1 mg/mL; human chondrocytes activated using IL-1β), CG has no
metabolic effect on two of the most relevant OA ECM degradation pathways. CG, as expected, also
did not affect the production of some well-known trophic (TGFβ1, IGF-I) and proangiogenic (VEGF)
factors, indicating this formulation cannot act at a biochemical level to modulate the network of
signals involved in the establishment, maintenance, and control of the OA. Interestingly, when
chondrocytes were co-cultured with a chondrogenic medium and CG, they better maintained their
morphology and phenotype and produced more of the type-II collagen typical of hyaline cartilage,
and less type-I collagen, usually found in fibrous cartilage; these results suggest that CG may
prompt chondrocytes to produce physiologic articular cartilage, and counterbalance the normal
reparative response that would lead, instead, to fibrous tissue formation.J. Clin. Med. 2019, 8, 975 11 of 13
CG was well-tolerated and did not induce significant side-effects. The data showed that the
treatment significantly reduced VAS, Lequesne, and WOMAC scores, as also previously reported
[17,21,22]. The reduction at 6 months in Lequesne and WOMAC scores were greater than those
observed by Furuzawa [17,21] and was achieved using a therapeutic protocol consisting of fewer
injections (three instead of five). The decrease in the Lequesne index observed in the present study
was also greater than that observed by Martin Martin [22]. Yet, it should be considered that
Furuzawa included patients having any degree of knee OA, and Martin Martin included only KL 2
and 3 patients; accordingly, comparison between the results of the present study should be
interpreted with caution, and future prospective studies should investigate how these treatments
work on homogenous patient subgroups. No comparison can be carried out between the present
studies and those cited concerning the VAS scores, as the other authors did not measure VAS during
patient movement.
5. Conclusions
Results of the present study show that CG may prompt chondrocytes to produce hyaline
cartilage and counterbalance the normal reparative response that would lead, instead, to fibrous
tissue formation. They also indicate CG may be a safe and effective adjuvant in the treatment of
symptomatic knee OA by intra-articular injection. The overall results are extremely promising and
highlight the need for further controlled prospective studies to investigate the full extent of the
beneficial effects of CG treatment and whether intra-articular CG injection may be more beneficial
than other non-pharmacological treatments already available in the clinical practice.
Author Contributions: Investigation, P.D.L., A.C.; formal analysis, P.D.L., A.C.; writing—original draft
preparation, P.D.L., A.C.; writing—review and editing, P.D.L., L.D.G.; conceptualization, A.C.; resources, G.C.,
P.V., M.B.
Funding: The in vitro research was supported by the “Prima s.r.l.".
Conflicts of Interest: The authors declare no conflict of interest.
References
1. Loeser, R.F.; Collins, J.A.; Diekman, B.O. Ageing and the pathogenesis of osteoarthritis. Nat. Rev.
Rheumatol. 2016, 12, 412–420.
2. Martel-Pelletier, J.; Barr, A.J.; Cicuttini, F.M.; Conaghan, P.G.; Cooper, C.; Goldring, M.B.; Goldring, S.R.;
Jones, G.; Teichtahl, A.J.; Pelletier, J.P. Osteoarthritis. Nat. Rev. Dis. Primers. 2016, 2, 16072,
doi:10.1038/nrdp.2016.72.
3. Kim, H.; Kang, D.; Cho, Y.; Kim, J.H. Epigenetic regulation of chondrocyte catabolism and anabolism in
osteoarthritis. Mol. Cells 2015, 38, 677–684, doi:10.14348/molcells.2015.0200.
4. Zhang, Y.; Jordan, J.M. Epidemiology of osteoarthritis. Clin. Geriatr. Med. 2010, 26, 355–369.
5. Xie, F.; Kovic, B.; Jin, X.; He, X.; Wang, M.; Silvestre, C. Economic and Humanistic Burden of
Osteoarthritis: A Systematic Review of Large Sample Studies. Pharmacoeconomics 2016, 34, 1087–1100.
6. Cross, M.; Smith, E.; Hoy, D.; Nolte, S.; Ackerman, I.; Fransen, M.; Bridgett, L.; Williams, S.; Guillemin, F.;
Hill, C.L.; et al. The global burden of hip and knee osteoarthritis: Estimates from the global burden of
disease 2010 study. Ann. Rheum. Dis. 2014, 73, 1323–1330.
7. Richette, P.; Latourte, A.; Frazier, A. Safety and efficacy of paracetamol and NSAIDs in osteoarthritis:
Which drug to recommend? Expert Opin. Drug Saf. 2015, 14, 1259–1268.
8. Freire, V.; Bureau, N.J. Injectable Corticosteroids: Take Precautions and Use Caution. Semin. Musculoskelet
Radiol. 2016, 20, 401–408.
9. Da Costa, B.R.; Reichenbach, S.; Keller, N.; Nartey, L.; Wandel, S.; Jüni, P.; Trelle, S. Effectiveness of
non-steroidal anti-inflammatory drugs for the treatment of pain in knee and hip osteoarthritis: A network
meta-analysis. Lancet 2017, 390, E21–E33.
10. Taylor, N. Nonsurgical Management of Osteoarthritis Knee Pain in the Older Adult. Clin. Geriatr. Med.
2017, 33, 41–51, doi:10.1016/j.cger.2016.08.004.J. Clin. Med. 2019, 8, 975 12 of 13
11. Xu, Q.; Chen, B.; Wang, Y.; Wang, X.; Han, D.; Ding, D.; Zheng, Y.; Cao, Y.; Zhan, H.; Zhou, Y. The
Effectiveness of Manual Therapy for Relieving Pain, Stiffness, and Dysfunction in Knee Osteoarthritis: A
Systematic Review and Meta-Analysis. Pain Physician 2017, 20, 229–243.
12. Bellamy, N.; Campbell, J.; Robinson, V.; Gee, T.; Bourne, R.; Wells, G. Viscosupplementation for the
treatment of osteoarthritis of the knee. Cochrane Database Syst. Rev. 2006, 19, CD005321.
13. Trojian, T.H.; Concoff, A.L.; Joy, S.M.; Hatzenbuehler, J.R.; Saulsberry, W.J.; Coleman, C.I. AMSSM
Scientific Statement Concerning Viscosupplementation Injections for Knee Osteoarthritis: Importance for
Individual Patient Outcomes. Clin. J. Sport Med. 2016, 26, 1–11.
14. Kapoor, M.; Martel-Pelletier, J.; Lajeunesse, D.; Pelletier, J.P.; Fahmi, H. Role of proinflammatory cytokines
in the pathophysiology of osteoarthritis. Nat. Rev. Rheumatol. 2011, 7, 33–42.
15. Mobasheri, A.; Bay-Jensen, A.C.; van Spil, W.E.; Larkin, J.; Levesque, M.C. Osteoarthritis Year in Review
2016: Biomarkers (biochemical markers). Osteoarthr. Cartil. 2017, 25, 199–208.
16. Ohara, H.; Iida, H.; Ito, K.; Takeuchi, Y.; Nomura, Y. Effects of Pro-Hyp, a collagen hydrolysate-derived
peptide, on hyaluronic acid synthesis using in vitro cultured synovium cells and oral ingestion of collagen
hydrolysates in a guinea pig model of osteoarthritis. Biosci. Biotechnol. Biochem. 2010, 74, 2096–2099.
17. Furuzawa-Carballeda, J.; Muñoz-Chablé, O.A.; Barrios-Payán, J.; Hernández-Pando, R. Effect of
polymerized-type I collagen in knee osteoarthritis. I. In vitro study. Eur. J. Clin. Investig. 2009, 39, 591–597.
18. Comblain, F.; Dubuc, J.E.; Lambert, C.; Sanchez, C.; Lesponne, I.; Serisier, S.; Henrotin, Y. Identification of
Targets of a New Nutritional Mixture for Osteoarthritis Management Composed by Curcuminoids
Extract, Hydrolyzed Collagen and Green Tea Extract. PLoS ONE 2016, 11, e0156902.
19. Naraoka, T.; Ishibashi, Y.; Tsuda, E.; Yamamoto, Y.; Kusumi, T.; Toh, S. Periodic knee injections of collagen
tripeptide delay cartilage degeneration in rabbit experimental osteoarthritis. Arthritis Res. Ther. 2013, 15,
R32.
20. Furuzawa-Carballeda, J.; Muñoz-Chablé, O.A.; Macías-Hernández, S.I.; Agualimpia-Janning, A. Effect of
polymerized-type I collagen in knee osteoarthritis. II. In vivo study. Eur. J. Clin. Investig. 2009, 39, 598–606.
21. Furuzawa-Carballeda, J.; Lima, G.; Llorente, L.; Nuñez-Álvarez, C.; Ruiz-Ordaz, B.H.; Echevarría-Zuno, S.;
Hernández-Cuevas, V. Polymerized-type I collagen downregulates inflammation and improves clinical
outcomes in patients with symptomatic knee osteoarthritis following arthroscopic lavage: A randomized,
double-blind, and placebo-controlled clinical trial. Sci. World J. 2012, 2012, 342854.
22. Martin Martin, L.S.; Massafra, U.; Bizzi, E.; Migliore, A. A double blind randomized active-controlled
clinical trial on the intra-articular use of Md-Knee versus sodium hyaluronate in patients with knee
osteoarthritis (Joint). BMC Musculoskelet Disord. 2016 22, 17, 94.
23. De Luca, P.; Kouroupis, D.; Viganò, M.; Perucca-Orfei, C.; Kaplan, L.; Zagra, L.; de Girolamo, L.; Correa,
D.; Colombini, A. Human Diseased Articular Cartilage Contains a Mesenchymal Stem Cell-Like
Population of Chondroprogenitors with Strong Immunomodulatory Responses. J. Clin. Med. 2019, 8, 423.
24. Daheshia, M.; Yao, J.Q. The interleukin 1beta pathway in the pathogenesis of osteoarthritis. J. Rheumatol.
2008, 35, 2306–2312.
25. Lopa, S.; Ceriani, C.; Cecchinato, R.; Zagra, L.; Moretti, M.; Colombini, A. Stability of housekeeping genes
in human intervertebral disc, endplate and articular cartilage cells in multiple conditions for reliable
transcriptional analysis. Eur. Cell. Mater. 2016, 31, 395–406.
26. Grogan, S.P.; Barbero, A.; Winkelmann, V.; Rieser, F.; Fitzsimmons, J.S.; O’Driscoll, S.; Martin, I.;
Mainil-Varlet, P. Visual histological grading system for the evaluation of in vitro-generated neocartilage.
Tissue Eng. 2006, 12, 2141–2149.
27. Colombini, A.; Lanteri, P.; Lombardi, G.; Grasso, D.; Recordati, C.; Lovi, A.; Banfi, G.; Bassani, R.;
Brayda-Bruno, M. Metabolic effects of vitamin D active metabolites in monolayer and micromass cultures
of nucleus pulposus and annulus fibrosus cells isolated from human intervertebral disc. Int. J. Biochem.
Cell. Biol. 2012, 44, 1019–1030.
28. Kellgren, J.; Lawrence, J. Atlas of Standard Radiographs: The Epidemiology of Chronic Rheumatism; Blackwell
Scientific Publications: Oxford, UK, 1963; Volume 2.
29. Lequesne, M.G.; Mery, C.; Samson, M.; Gerard, P. Indexes of severity for osteoarthritis of the hip and knee.
Validation--value in comparison with other assessment tests. Scand. J. Rheumatol. Suppl. 1987, 65, 85–89.
30. Bellamy, N. WOMAC Osteoarthritis Index User Guide IX; Brisbane Queensland, Australia: 2008.J. Clin. Med. 2019, 8, 975 13 of 13
31. Lopa, S.; Colombini, A.; Sansone, V.; Preis, F.W.; Moretti, M. Influence on chondrogenesis of human
osteoarthritic chondrocytes in co-culture with donor-matched mesenchymal stem cells from infrapatellar
fat pad and subcutaneous adipose tissue. Int. J. Immunopathol. Pharmacol. 2013, 26 (Suppl. 1), 23–31.
32. Lovati, A.B.; Colombini, A.; Recordati, C.; Ceriani, C.; Zagra, L.; Berzero, G.; Moretti, M. Chondrogenic
capability of osteoarthritic chondrocytes from the trapeziometacarpal and hip joints. Cell Tissue Bank. 2016,
17, 171–177.
33. Heilmann, H.H.; Lindenhayn, K.; Walther, H.U. Synovial volume of healthy and arthrotic human knee
joints. Z. Orthop. Ihre Grenzgeb. 1996, 134, 144–148.
34. Kraus, V.B.; Stabler, T.V.; Kong, S.Y.; Varju, G.; McDaniel, G. Measurement of synovial fluid volume using
urea. Osteoarthr. Cartil. 2007, 15, 1217–1220.
35. Nakatani, S.; Mano, H.; Sampei, C.; Shimizu, J.; Wada, M. Chondroprotective effect of the bioactive
peptide prolyl-hydroxyproline in mouse articular cartilage in vitro and in vivo. Osteoarthr. Cartil. 2009, 17,
1620–1627.
36. Boonmaleerat, K.; Wanachewin, O.; Phitak, T.; Pothacharoen, P.; Kongtawelert, P. Fish Collagen
Hydrolysates Modulate Cartilage Metabolism. Cell Biochem. Biophys. 2017, 76, 279–392.
© 2019 by the authors. Licensee MDPI, Basel, Switzerland. This article is an open
access article distributed under the terms and conditions of the Creative Commons
Attribution (CC BY) license (http://creativecommons.org/licenses/by/4.0/).You can also read