Introducing Chorus - Chorus NZ

Page created by Norma Dennis
 
CONTINUE READING
Introducing Chorus - Chorus NZ
Introducing Chorus

17 November 2020      UBS AUSTRALASIA VIRTUAL CONFERENCE
Introducing Chorus - Chorus NZ
An Overview Of Chorus
New Zealand’s largest fixed line communications infrastructure business
   ▪ Established in December 2011 following demerger from Telecom NZ
   ▪ ~870 employees, supported by service company contractors and subcontractors
   ▪ Listed on NZX and ASX: CNU
   ▪ ~$3.7 billion market capitalisation (as at 31/10/20)

A nationwide copper and growing fibre network
    ▪ Wholesale network operator with ~100 retailer customers
    ▪ ~1.4m connections, including ~1.2m broadband
    ▪ 90% of way through 11-year fibre to premises rollout
    ▪ 62% fibre uptake, well ahead of initial rollout target of 20% by 2020
    ▪ Streaming video services and working from home driving significant data
        consumption

       Agency              Rating   Outlook
       S&P                 BBB      Stable
       Moody’s             Baa2     Stable

   2    17 November 2020                 UBS AUSTRALASIA VIRTUAL CONFERENCE
Introducing Chorus - Chorus NZ
Our Network Infrastructure
    Fibre to pass ~1.36m end customers by end 2022

                           Offices and apartments                                                         IoT: pole and
                                                                                                          cabinet assets
                                                                        Fibre backhaul: to                provide coverage and
                                                                        mobile towers,                    power infrastructure   Bridging the digital divide:
                                              Fibre to smart locations: small cells                                              providing free broadband
Exchange co-location:                         CCTV, traffic lights                                                               connections to 12,000 student
wireless co-location and                                                                                                         households
network edge computing                                                                   FTTP: enabling unlimited
                                                                                         data, enhanced Wi-Fi and
                                                                                         TV broadcast capability

             ~600                                                                   ~12,000 cabinets                     ~300,000 poles
             exchanges

           ~54,000km fibre; ~130,000km copper cable                         ~40,000km duct network

       3     17 November 2020                            UBS AUSTRALASIA VIRTUAL CONFERENCE
Introducing Chorus - Chorus NZ
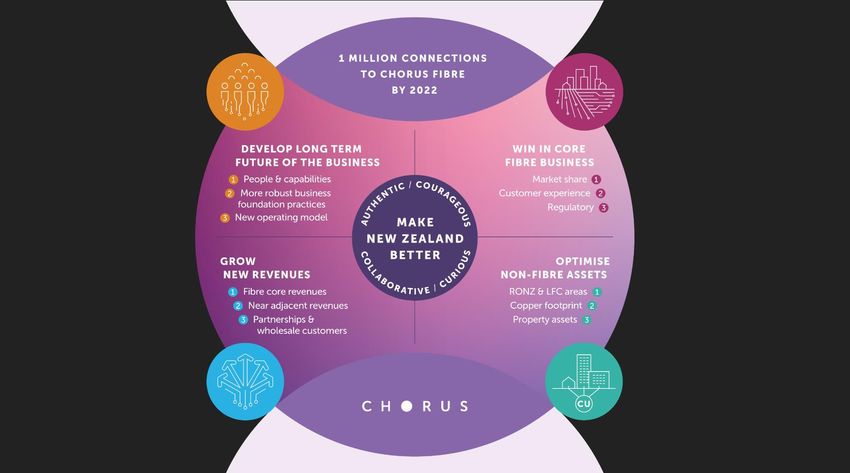
The Ultra-fast Broadband Initiative
> Ultra-fast broadband (UFB): a Government objective
  ▪ Original objective (UFB1): fibre to premises covering 75%
          of population by 2020
      ▪   Subsequent agreements (UFB2 and UFB2+) extended
          coverage goal to 87% of population by the end of 2022
      ▪   Chorus was awarded ~75% of the fibre rollout. The
          remaining 25% includes government partnerships with
          three other fibre companies: Enable, Northpower, Ultrafast
          Fibre

      UFB rollout rapidly nearing completion

                         UFB2 rollout (premises)
  70000
  60000
  50000
  40000
  30000
                                                                                        ULTRAFAST FIBRE
  20000
  10000
          0
                  FY21               FY22             FY23

  4       17 November 2020                         UBS AUSTRALASIA VIRTUAL CONFERENCE
Introducing Chorus - Chorus NZ
UFB uptake reaches 62%
                                                                                                                                                     Uptake

                                                                                                       Fibre now 76% of Chorus broadband
                                                                                                       connections in planned UFB zone
> UFB uptake increased from 60% to 62% within
     completed footprint in Q1                                                           No. of
     ▪ uptake in UFB1 areas grew from 63% to 65%                                         connections

     ▪ uptake in UFB2 areas grew from 37% to 38%                                           1,000,000
     (note: uptake includes some UFB2 areas that have been partially built, but not          900,000
     yet submitted for Crown sign-off)
                                                                                             800,000
     ▪ 757,000 connections (Q4: 725,000) now within completed
       footprint, including business premium connections                                     700,000
     ▪ 1,226,000 customers able to connect (Q4: 1,209,000)                                   600,000
     ▪ 947,000 premises passed* (Q4: 931,000) out of                                         500,000
        1,054,000 target = UFB rollout 90% complete                                          400,000
                                                                                             300,000
> 47,000 fibre installations completed in Q1 (Q4: 31k)                                       200,000
  ▪ customer satisfaction increased from 8.1 to 8.2                                          100,000
                                                                                                       0
                                                                                                           Sep-19   Dec-19   Mar-20      Jun-20   Sep-20
 *under the UFB contract, a multi-dwelling unit or single office block is one premises
                                                                                                                ADSL    VDSL     Fibre

 5    17 November 2020                                  UBS AUSTRALASIA VIRTUAL CONFERENCE
Introducing Chorus - Chorus NZ
Making New Zealand better
          We take a long term view of our network infrastructure investments and our people take pride in delivering an asset
          for New Zealand’s ongoing social and economic betterment. Chorus is included in the Dow Jones Sustainability
          Australia Index.

>       Environment
        ▪ Target of 80% reduction in scope 1 and 2 emissions, from our FY12 base year, by
           2030. Achieved 37% reduction against target in FY20.
        ▪ B- rating from CDP for FY19 reporting.
        ▪ Extensive waste minimisation: 195 tonnes of waste ducting and 37 tonnes metal
           network components recycled in FY20.
>       Social
        ▪ FTTH estimated (2012) to contribute $32 billion in economic benefits to NZ over 20
           years. Social benefits estimated (2017) at $2 billion annually.
        ▪ Winner of Broadband World Forum’s Broadband delivering social impact award 2018
           for rural broadband rollout.
        ▪ Employee engagement 8.5 out of 10 in June 2020 (7.6 in FY19).
>       Governance
        ▪ Director gender ratio of 43% women, 57% men at 31 October 2020.
        ▪ Target of 40:40:20 (male:female:any/either) gender ratio achieved for Chorus’
           people leader community in FY20. Largest gender pay gap by career level is 4.1%.
           Objective to achieve 0% gender career level pay gap.
        ▪ Minimum Shareholding Policy for directors and executives introduced in 2019.
        ▪ Total Recordable Injury Frequency Rate decreased from 2.67 to 2.43 in FY20 with an
           overall reduction in injuries requiring medical treatment.

    6     17 November 2020                        UBS AUSTRALASIA VIRTUAL CONFERENCE
Introducing Chorus - Chorus NZ
Broadband: the 4th utility

  17 November 2020   UBS AUSTRALASIA VIRTUAL CONFERENCE
Introducing Chorus - Chorus NZ
A new world of data demand
                                                                     COVID-19 Lockdowns
                             3

                            2.5                                    Rugby World Cup
      Peak Traffic (Tbps)

                             2
                                               Fortnite Season 5
                                                                                                                         Fibre
                            1.5                                                                                          Network

                                                                                                                         Copper
                             1                                                                                           Network

                            0.5

                             0
                             Mar-16   Sep-16   Mar-17   Sep-17     Mar-18   Sep-18   Mar-19   Sep-19   Mar-20   Sep-20

8   17 November 2020                                    UBS AUSTRALASIA VIRTUAL CONFERENCE
Introducing Chorus - Chorus NZ
Forecasting 1,000 Gigabytes per month by 2023…
Monthly average data usage per connection on      Chorus Forecast: Average Monthly Broadband Usage
our network
                                                                                  Copper    Fibre
                                                   1,400
                                                             Actual    Forecast
                                                                >
                                                   1,200

                                                   1,000

                                                    800

                                                    600

                                                    400

                                                    200

                                                      0
                                                           JUNE 2020   JUNE 2021     JUNE 2022      JUNE 2023   JUNE 2024

  9   17 November 2020              UBS AUSTRALASIA VIRTUAL CONFERENCE
Introducing Chorus - Chorus NZ
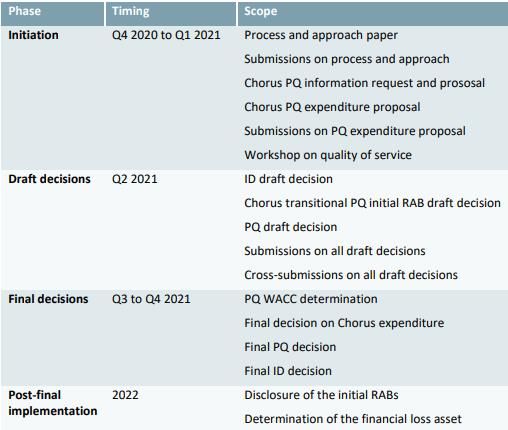
The shift to remote working
      Reliable broadband becomes a necessity

      Which of the following workplace technologies do you                        > Commerce Commission report (May 2020) noted
      consider as ‘must have’ when working from home or                                reliability of fixed line services through lockdown vs fixed
      remotely in general?                                                             wireless (average download speeds decreased by around
                                                                                       25% and 96% of latency tests were above 30ms)

                              Other    2
                             Tablet        7
                                VOIP       8
            Wi-Fi expander/extender            13
                  Dedicated camera             16
              Virtual network access                31
                            Headset                      40
                        Wi-Fi router                          48
                 Video conferencing                            53
                        Smartphone                             54
                 Computer monitors                                 56
High-speed connectivity to internet                                     74
               Laptop or desktop PC                                          85
                                                                                  Source: Measuring Broadband New Zealand, Winter Report, August 2020

       10    17 November 2020                             UBS AUSTRALASIA VIRTUAL CONFERENCE
An Open Access Wholesale Network

 11   17 November 2020   UBS AUSTRALASIA VIRTUAL CONFERENCE
Open access enables increased retail diversity

      Power and pay TV operators are new entrants

          Broadband market share by retailer             Fibre market share by retailer
          (Q2 2020 vs Q1 2013)                           (Q2 2020)

                    13

               5            10                                   17
                        1
                                       38
                   12                                                          35
           7
Q2 2020                 Q1 2013                              7
                                  48             %
                                                             8
           13       29
                                                                 15
                                                                          18

                             24

                                       Source: IDC market data

    12    17 November 2020                     UBS AUSTRALASIA VIRTUAL CONFERENCE
Connection and market trends

           Broadband uptake by retailer (all technology)                                                                                                                                                                                                                                                                                                      NZ broadband market – by technology
2,000,000                                                                                                                                                                                                                                                                                                               2,000,000

1,800,000                                                                                                                                                                                                                                                                                                               1,800,000

1,600,000                                                                                                                                                                                                                                                                                                               1,600,000

1,400,000                                                                                                                                                                                                                                                                                                               1,400,000

1,200,000                                                                                                                                                                                                                                                                                                               1,200,000

1,000,000                                                                                                                                                                                                                                                                                                               1,000,000

 800,000                                                                                                                                                                                                                                                                                                                 800,000

 600,000                                                                                                                                                                                                                                                                                                                 600,000

 400,000                                                                                                                                                                                                                                                                                                                 400,000

 200,000                                                                                                                                                                                                                                                                                                                 200,000

       -                                                                                                                                                                                                                                                                                                                       -
                      Q2 2013

                                                                                                                                                                  Q4 2016
            Q1 2013

                                Q3 2013
                                          Q4 2013
                                                    Q1 2014
                                                              Q2 2014
                                                                        Q3 2014
                                                                                  Q4 2014
                                                                                            Q1 2015
                                                                                                      Q2 2015
                                                                                                                Q3 2015
                                                                                                                          Q4 2015
                                                                                                                                    Q1 2016
                                                                                                                                              Q2 2016
                                                                                                                                                        Q3 2016

                                                                                                                                                                            Q1 2017
                                                                                                                                                                                      Q2 2017
                                                                                                                                                                                                Q3 2017
                                                                                                                                                                                                          Q4 2017
                                                                                                                                                                                                                    Q1 2018
                                                                                                                                                                                                                              Q2 2018
                                                                                                                                                                                                                                        Q3 2018
                                                                                                                                                                                                                                                  Q4 2018
                                                                                                                                                                                                                                                            Q1 2019
                                                                                                                                                                                                                                                                      Q2 2019
                                                                                                                                                                                                                                                                                Q3 2019
                                                                                                                                                                                                                                                                                          Q4 2019
                                                                                                                                                                                                                                                                                                    Q1 2020
                                                                                                                                                                                                                                                                                                              Q2 2020

                                                                                                                                                                                                                                                                                                                                                        Q3 2013

                                                                                                                                                                                                                                                                                                                                                                                                                                                                                          Q4 2016
                                                                                                                                                                                                                                                                                                                                    Q1 2013
                                                                                                                                                                                                                                                                                                                                              Q2 2013

                                                                                                                                                                                                                                                                                                                                                                  Q4 2013
                                                                                                                                                                                                                                                                                                                                                                            Q1 2014
                                                                                                                                                                                                                                                                                                                                                                                      Q2 2014
                                                                                                                                                                                                                                                                                                                                                                                                Q3 2014
                                                                                                                                                                                                                                                                                                                                                                                                          Q4 2014
                                                                                                                                                                                                                                                                                                                                                                                                                    Q1 2015
                                                                                                                                                                                                                                                                                                                                                                                                                              Q2 2015
                                                                                                                                                                                                                                                                                                                                                                                                                                        Q3 2015
                                                                                                                                                                                                                                                                                                                                                                                                                                                  Q4 2015
                                                                                                                                                                                                                                                                                                                                                                                                                                                            Q1 2016
                                                                                                                                                                                                                                                                                                                                                                                                                                                                      Q2 2016
                                                                                                                                                                                                                                                                                                                                                                                                                                                                                Q3 2016

                                                                                                                                                                                                                                                                                                                                                                                                                                                                                                    Q1 2017
                                                                                                                                                                                                                                                                                                                                                                                                                                                                                                              Q2 2017
                                                                                                                                                                                                                                                                                                                                                                                                                                                                                                                        Q3 2017
                                                                                                                                                                                                                                                                                                                                                                                                                                                                                                                                  Q4 2017
                                                                                                                                                                                                                                                                                                                                                                                                                                                                                                                                            Q1 2018
                                                                                                                                                                                                                                                                                                                                                                                                                                                                                                                                                      Q2 2018
                                                                                                                                                                                                                                                                                                                                                                                                                                                                                                                                                                Q3 2018
                                                                                                                                                                                                                                                                                                                                                                                                                                                                                                                                                                          Q4 2018
                                                                                                                                                                                                                                                                                                                                                                                                                                                                                                                                                                                    Q1 2019
                                                                                                                                                                                                                                                                                                                                                                                                                                                                                                                                                                                              Q2 2019
                                                                                                                                                                                                                                                                                                                                                                                                                                                                                                                                                                                                        Q3 2019
                                                                                                                                                                                                                                                                                                                                                                                                                                                                                                                                                                                                                  Q4 2019
                                                                                                                                                                                                                                                                                                                                                                                                                                                                                                                                                                                                                            Q1 2020
                                                                                                                                                                                                                                                                                                                                                                                                                                                                                                                                                                                                                                      Q2 2020
                                                                                                                                                                                                                                                                                                                           Chorus xDSL                                                                                  Chorus mass market fibre                                                                                        Chorus premium fibre
           Spark                      Vodafone                                         Orcon                               Vocus                              2degrees                                        Trustpower                                               ROM
                                                                                                                                                                                                                                                                                                                           Local fibre companies (UFB)                                                                  Other fibre networks                                                                                            Other xDSL
                                                                                                                                                                                                                                                                                                                           Vodafone cable                                                                               Fixed (mobile) wireless                                                                                         Legacy fixed wireless, satellite
                                                                                                                              Source: IDC                                                                                                                                                                                                                                                                                                                              Source: IDC

      13          17 November 2020                                                                                                                                                                              UBS AUSTRALASIA VIRTUAL CONFERENCE
Active wholesaler campaigns driving ARPU growth
Total mass market fibre uptake by plan type

                1Gbps

               200Mbps                                        33,000 mass market fibre connections added in
                                                              Q1 2020
                                                                 ▪ 1Gbps connections grew from 115k to 128k
                                                                   (i.e. 40% of 33k increase in total fibre
                                                                   connections in Q1 2020)
                100Mbps                                          ▪ 1Gbps demand represents ~20% of new fibre
                                                                   connection orders in recent weeks
                                                                 ▪ Small business connections grew from 3k to 4k
                                                                 ▪ UFB prices capped to 2022 with annual CPI
                                                                   adjustment
                                                                 ▪ New Hyperfibre products 2 & 4 Gbps services
                                                                   launched early 2020

                 50Mbps

  14   17 November 2020               UBS AUSTRALASIA VIRTUAL CONFERENCE
Fibre capability keeps advancing
                                                                            Wi-Fi 6 Speedtest

   Wi-Fi
                         Wi-Fi 5               Wi-Fi 6
Technology

                                                                        HyperFibre 8000 Speedtest

   Fibre
Technology               GPON                Hyperfibre

 15   17 November 2020             UBS AUSTRALASIA VIRTUAL CONFERENCE
Fibre comprises 56% of Chorus connections
                           30 Sept      31 Dec    31 March     30 June     30 Sept
                             2019        2019         2020       2020        2020
                                                                                      1,400,000    Baseband copper

Unbundled copper            21,000      18,000      17,000      15,000      14,000                 Unbundled copper
(no broadband)                                                                        1,200,000

Baseband copper            201,000     192,000     185,000     179,000     169,000
(no broadband)                                                                                     Copper ADSL
                                                                                      1,000,000
Copper ADSL                304,000     283,000     261,000     245,000     218,000
(includes naked)
                                                                                       800,000      VDSL
VDSL                       257,000     242,000     228,000     221,000     202,000
(includes naked)
                                                                                       600,000
Fibre broadband            645,000     681,000     713,000     740,000     773,000
(GPON)

Data services                4,000       4,000       4,000       4,000       3,000     400,000
(copper)                                                                                            Fibre (GPON)

Fibre premium               12,000      12,000      11,000      11,000      11,000     200,000
(P2P)

Total connections         1,444,000   1,432,000   1,419,000   1,415,000   1,390,000
                                                                                              0     Business premium
                                                                                            30-Sep-19       31-Dec-19   31-Mar-20   30-Jun-20   30-Sep-20
        > 1,193,000 broadband connections comprises:
          ▪ 773,000 fibre (GPON) connections                              Note: 11,000 free education connections are excluded from this data
          ▪ 420,000 VDSL/ADSL (copper) connections

           16      17 November 2020                     UBS AUSTRALASIA VIRTUAL CONFERENCE
Connection changes by Zone (indicative)

>        Chorus UFB zone: reduction in broadband reflecting RSP                           Change in connections (‘000s) by zone**
         copper broadband billing clean-up and catch-up of copper
         migration delayed by Q4 lockdown period, as well as renewed                             -15           -5                         5   15
         inertia selling campaigns by fixed wireless providers
                                                                                                                                                   LFC
                                                                                     Q2   FY20           -2       -7
>        LFC zone: disconnections returned to pre-lockdown (Q4 FY20)                                                                               Zone
                                                                                     Q3   FY20          -2       -8
         levels                                                                      Q4   FY20                 -2 -4
         N/C                                                                         Q1   FY21         -2       -9
>        Non-UFB zone: fibre connections now 22k; some increased
         rural wireless competition through mobile network expansion                 Q2   FY20                             -2                      Non-
                                                                                     Q3   FY20                              -11                    UFB
                              Chorus UFB          Non-UFB              Local Fibre   Q4   FY20                              -1                     Zone
                              zone*               zone                 Company       Q1   FY21                          -1 -2
                                                                       UFB zone
Total connections at              1,087,000             192,000             97,000   Q2   FY20                     -8                 7
                                                                                     Q3   FY20
                                                                                                                                                   Chorus
30 September**                                                                                                          -5        3
                                                                                     Q4   FY20                          -5            8            UFB Zone
Broadband connections                 978,000            153,000            62,000
                                                                                     Q1   FY21                -8             -2
Copper (no broadband)                 109,000             39,000            35,000
connections
                                                                                                        Broadband connections
 * Includes planned Chorus UFB1, 2 and 2+ coverage
 **Excludes 14k fibre premium and data services (copper) connections
                                                                                                        Copper (no broadband) connections

    17     17 November 2020                                   UBS AUSTRALASIA VIRTUAL CONFERENCE
Our strategic
focus in FY21

 18   17 November 2020   UBS AUSTRALASIA VIRTUAL CONFERENCE
1. Winning in our core fibre business
                                  We’re lifting our connections intensity in FY21
                                               25,000
                                               greenfield
                                               properties
                                               under        ▪ growth strongest in Auckland, good demand outside UFB zone
                                  ~80,000
                                    UFB2       contract
                                  addresses
                                  to pass in    ▪ uptake continues to track at ~30% within 6 months of network build;
                    ~80,000          FY21          stronger in some UFB2 areas (e.g. Whatawhata 80%)
                     UFB1 + 2
                     addresses
                    passed and         ▪ ~50% of fibre orders are now from intact addresses as our migration/incentive
                    ONT already           programmes generate new uptake and consumers move premises
     ~420,000         installed
      UFB1 + 2
      addresses
        already
     passed, with
                          ▪ COVID-19 driving awareness of fibre reliability and capacity
        no ONT            ▪ new marketing and incentive campaigns launching
       installed          ▪ uplift in managed migration volumes

19     17 November 2020                        UBS AUSTRALASIA VIRTUAL CONFERENCE
Managed migration activity lifts fibre connections
      More than 15k installations completed in Q1

                                                                           Managed migration programme
     ▪ Q1 installation volumes increased significantly on prior   16,000
        quarters (Q4 FY20 affected by COVID-19) as migration
                                                                                 Installations      Connections
        activity ramps up                                         14,000

                                                                  12,000
     ▪ migration activity drove 7k connections in Q1 and          10,000
        continues to result in ~50% uptake within 6 months of
        installation                                               8,000

                                                                   6,000
     ▪ COVID-19 restrictions on door-to-door activity in
                                                                   4,000
        Auckland affected Q1 connection initiatives
                                                                   2,000
     ▪ Fibre, it’s how we internet now advertising campaign           0
        creating strong awareness among late adopters and                     Q3 FY20            Q4 FY20          Q1 FY21
        helping drive migration activity

20   17 November 2020                    UBS AUSTRALASIA VIRTUAL CONFERENCE
2. Grow new revenues

       Smart locations (e.g. CCTV, traffic lights)
       ▪ streamlined our processes to help realise market growth
         opportunity
       ▪ new 50Mbps symmetrical plan to support connectivity of urban
         infrastructure (e.g. poles, traffic lights) $55 per month

       Wi-Fi ONT service
       ▪   co-developed service with retailers
       ▪   launching with $1.30 monthly fee; providing upfront credits to
           support retailers switching systems
       ▪   will enhance customer experience with shorter connection time
           for homes with fibre already installed
       ▪   potential to broaden fibre market by lowering router costs to
           connect customers on short term contracts

21   17 November 2020                     UBS AUSTRALASIA VIRTUAL CONFERENCE
3. Optimise non-fibre assets
                               Detailed review underway of existing network infrastructure

> Focus on reducing ongoing network costs
  ▪ 20 network sites exited in FY20 (e.g. New Plymouth site – LFC
      zone; Whangarei Heads rural site)

   ▪ reshaping proactive maintenance programme in UFB zone to
      reflect shift to fibre

   ▪ reviewing copper broadband network assets in UFB zone
      o ~20 copper broadband cabinets with no customers
      o ~30 cabinets with
4. Develop long term future of the business
                          Reviewing our operating model, including flexible working

                                                             Employee preference for % of working
                                                                   week at home vs office
                                                       25
                                           % of
                                           responses
                                                       20

                                                       15

                                                       10

                                                        5

                                                        0
                                                            100% at 80% at   60% at   50% at   40% at   20% at 100% at
                                                             home    home     home     home     home     home   office

23   17 November 2020             UBS AUSTRALASIA VIRTUAL CONFERENCE
Regulatory framework

  17 November 2020   UBS AUSTRALASIA VIRTUAL CONFERENCE
Legislation passed in November 2018
87% of population where fibre will be available by end of 2022                                             →   Remaining 13% of population                       →

Fibre access network – in Chorus UFB                     Copper – where fibre is available:                    Copper – where fibre is not available:
areas
                                                         ▪ Copper network to be deregulated and                ▪ Copper remains regulated and TSO applies
▪ Revenue cap determined by Commission based on            Telecommunications Service Obligation (TSO)
  regulated asset base (RAB) and regulatory rate of                                                            ▪ Copper pricing capped at 2019 levels with CPI
                                                           removed
  return (WACC)
                                                                                                                 adjustments
▪ Accumulated unrecovered returns on investment          ▪ Chorus can withdraw copper service subject to
  between 2011 and 2022 capitalised into initial RAB                                                           ▪ Commission required to review pricing framework
                                                           minimum consumer protection requirements being
  and recoverable in future prices
                                                                                                                 no later than 31 December 2025
                                                           developed by the Commission and due in December
▪ Contracted price caps on fibre products to continue
                                                           2020
  until 2022, with annual inflation adjustment. Price
  caps then only apply to specified ‘anchor services’;
  fibre voice service, entry level fibre broadband
  service and direct fibre access services

▪ Unbundled fibre (commercial price) available in
  UFB1 areas from 2020 and UFB2 areas from 2026

▪ Three years after new regime commences, the
  Commission can review the revenue cap model and
  anchor products, subject to specified conditions and
  statutory criteria

   25    17 November 2020                                  UBS AUSTRALASIA VIRTUAL CONFERENCE
Overview of current RAB implementation

On 13 October and 3 November 2020, the Commerce
Commission released its final Input Methodology
determinations, following extensive submissions from
Chorus and investors.

The determinations establish the rules that will apply to
how the Maximum Allowable Revenue (MAR) will be
derived.

Chorus will continue to work with the Commission through
the next stage of the process where the MAR for the 3
year period from 1 January 2022 will be set.

These decisions, referred to as ‘price-quality’ decisions are
expected in the 2nd half of 2021.

 26   17 November 2020                     UBS AUSTRALASIA VIRTUAL CONFERENCE
Input methodologies: key parameters
                            Pre January 2022 period (financial loss           First regulatory period
                            asset)
Risk free rate              5-year rate, 1 month average, calculated as at    3-year rate, 3 months average,
                            middle of year, or mid each part year for 2012    calculated as at 1 June 2021
                            and 2021
TAMRP                       7% until Oct 2020 then 7.5%                       7.5%

Debt risk premium           BBB, 7-year term, 1 month average                 BBB, 5-year term, 5-year trailing
                                                                              average
Leverage                    29%                                               29%

Debt issuance cost          0.14%                                             0.33%

Asset beta                  0.5                                               0.5

WACC uplift                 none – 50th percentile                            none – 50th percentile

Asymmetric stranding risk   no allowance                                      10 basis points

Crown financing             Financing rate reflecting Chorus’ actual senior   Financing rate reflecting Chorus’
                            debt/subordinated debt/equity mix                 actual senior debt/subordinated
                                                                              debt/equity mix

27   17 November 2020                 UBS AUSTRALASIA VIRTUAL CONFERENCE
Cost allocation parameters
      Pre-December 2011 assets       ▪    included to the extent assets are employed to provide fibre fixed line access
                                          services under the UFB initiative.
                                     ▪    valued as per Chorus financial accounts.

      UFB costs from 1 December      ▪    shared costs are allocated using accounting-based allocation approach.
      2011 to 2022 (financial loss   ▪    list of default allocators, with the Commission having the final decision:
      asset)                              number of customers, end-users, or premises (intact, connected or passed);
                                          number of ports;
                                     ▪    revenue; central office space; peak traffic; average traffic; used length of
                                          linear assets; power usage; and number of events.
                                     ▪    cost allocation calculations to be updated annually.
                                     ▪    cap limiting the allocation of re-used assets to that which cannot be avoided
                                          in providing UFB.
                                     ▪    cost allocations to be applied consistently across costs and between years.

      Fibre costs post 2022          ▪    cost allocators to remain consistent with initial RAB unless there is a
                                          justifiable reason to change.

28   17 November 2020                    UBS AUSTRALASIA VIRTUAL CONFERENCE
Regulated Asset Base implementation
▪        Commerce Commission will determine the starting value of the RAB, regulatory WACC, cost allocations, expenditure
         allowances and maximum allowable revenue

                                                   Illustrative Only

                                                                           Building block
                                                                             cost stack

    29    17 November 2020                   UBS AUSTRALASIA VIRTUAL CONFERENCE
FINANCIAL HIGHLIGHTS

Financial overview and
capital management

   17 November 2020      UBS AUSTRALASIA VIRTUAL CONFERENCE
FY21 guidance summary
      EBITDA: $640m to $660m                              Gross capex: $630m to $670m
▪    subject to no material changes in expected        > Fibre $530m-$560m
     regulatory and competitive outlook                      ▪   $275m-$295m fibre connections & layer 2
                                                                 (based on mass market 145,000 – 165,000 fibre
▪    includes ~$10m allowance for ongoing COVID-19               connections, 9,000 backbone builds and including
     impact and broader economic uncertainty                     service desk costs)
                                                             ▪   $125m-$145m spend for UFB2 communal
                                                             ▪   includes ~$30m for West Coast fibre rollout in
                                                                 FY21 (3-year project ~$50m, largely government
                                                                 funded)
                                                             ▪   UFB1 CPPC $1,025 - $1,175*
        Dividend: 25cps, subject to no                       ▪   UFB2 CPPC $1,200 - $1,350*
        material adverse changes in                              *excluding layer 2 and including standard installations and
        circumstances or outlook                                 some non-standard single dwellings and service desk costs

                                                       > Copper $35m-$55m
                                                       > Common $50m-$65m

31     17 November 2020                   UBS AUSTRALASIA VIRTUAL CONFERENCE
We’ve passed our capex peak
Capex & Leverage

                                                                         3.92
                                                                                4.14             4.11
                                                                                                              ▪ Capex peaked in FY18 & FY19, leverage
                                                          3.43
                                                                                                                 peaked in FY20
                        3.1    3.1
    2.9
                 2.7
                                             2.98
                                                                                                              ▪ UFB1 completed in November 2019
                                                                                                              ▪ UFB2 scheduled to complete in CY22
                                                                                 663              650
                                             689          810            804
                               593
    681           679   597                                                                                   ▪ Leverage will reduce in line with lower
                                                                                                                 capex/growing free cash flow in future
                                                                                                                 years

                                                                                                              ▪ FY21 gross capex guidance:
    FY13         FY14   FY15   FY16          FY17         FY18           FY19   FY20            FY21*
                                                                                * FY21 values calculated at
                                                                                                                  ▪ $630-670m
                                     Capex      Senior ND/EBITDA
                                                Net senior debt/EBITDA          mid guidance levels

* Mid guidance
                                                                                                              ▪ FY21 EBITDA guidance:
Key Financial ratios:
                                                                                                                  ▪ $640-660m
▪     Bank covenant - Net Senior Debt/EBITDA 4.75x
▪     Credit rating downdriver - Net Senior Debt/EBITDA on a sustained basis
        ▪ > 4.25x (S&P)
        ▪ > 4.20x (Moody’s)

 32        17 November 2020                                UBS AUSTRALASIA VIRTUAL CONFERENCE
Transition to free cash flow based dividend policy
     > from FY22 we will transition to a dividend policy based on a
       pay-out range of free cash flow                                        UFB capex demands reducing
       ▪ free cash flow will be defined as net cash flows from
           operating activities minus sustaining capex                                Communal spend
                                                                                      Connection & layer 2 spend
     > dividend levels through the transition period will reflect the   300
       following considerations:
                                                                        250
        • maintenance of a BBB credit rating
        • UFB related capital expenditure remains elevated              200
                                                                                          Illustrative only
            initially, reducing as the UFB rollout winds down (ends
            Dec 2022)                                                   150
        • fibre connection spend tapers off gradually, subject to       100
                                                                                                               UFB2 rollout
            ongoing demand and timing of copper migration in                                                   ends Dec 2022
            selected areas                                              50
        • copper capex is declining as connections reduce
                                                                         0
                                                                        $m     FY20     FY21*           FY22            FY23

                                                                                        *based on midpoint of FY21 guidance

33    17 November 2020                     UBS AUSTRALASIA VIRTUAL CONFERENCE
Fibre capex: sustaining                            $m
                                                                         Layer 2                                              31

     Defining sustaining capex                                           Fibre products & systems
                                                                         Other fibre connections
                                                                                                                              14
                                                                                                                              20
        $186m of FY20 capex was sustaining                               Customer retention costs*                             7

     > Sustaining capex is defined as total capex excluding:             Subtotal                                            72
       ▪ UFB communal & future footprint expansion                       Copper capex: sustaining                           $m
       ▪ Fibre connections & greenfield growth
                                                                         Network sustain                                      31
       ▪ Customer retention spend (incentives related)
     > Exclusions within FY20 Capex of $663m were:                       Copper connections                                    1
       ▪ UFB communal                 $170m                              Copper layer 2                                        7
       ▪ Fibre connections            $251m                              Customer retention costs*                            15
       ▪ Greenfield growth            $42m
                                                                         Subtotal                                            54
       ▪ Customer retention           $14m
       ▪ Sub total                    $477m                              Common capex: sustaining                           $m
       ▪ FY20 Sustaining Capex $186m                                     Information technology                               43
     > Fibre sustaining capex is expected to increase over time as the   Building & engineering services                      17
        asset ages
                                                                         Subtotal                                            60
                                                                         *Relates to provisioning, systems and service desk costs

34    17 November 2020                    UBS AUSTRALASIA VIRTUAL CONFERENCE
FY22 capital allocation framework driven by shareholder value

  Net cash flow from operating activities                         > Transition from FY22 to dividend distribution based on pay-
                                                                    out range of free cash flow to reflect:
                                                                      • a focus on providing shareholders with dividend
 Sustaining capital                                                       predictability, stability and sustainable growth
                                      Dividend                        • comparable Australasian infrastructure and utility-like
   expenditure
                                     distribution                         businesses that pay out the majority of FCF
                                                                      • robust management of sustaining capital expenditure
                                                                      • transition period based on completion of UFB2 communal by
                        Surplus                                           December 2022 and ongoing tapering of connection capex
                        capital                                   > Surplus capital after dividend to be allocated based on
                                                                    maximising shareholder value, and guided by:
                                                                    ▪ debt levels consistent with existing credit rating, noting potential
                                                                      re-gearing from any relaxation of rating thresholds
                                                                    ▪ discretionary capex will only be pursued where:
                                                                      • greater shareholder value is created compared to share buy
   Share buy            Additional        Discretionary
                                                                          backs and/or additional dividends; and
     backs              dividends         capex *
                                                                      • regulatory incentives are appropriate (e.g. regulatory WACC
                                                                          vs Chorus WACC)
* Examples include fibre footprint expansion, greenfield connections & customer retention spend

   35   17 November 2020                          UBS AUSTRALASIA VIRTUAL CONFERENCE
Financial snapshot
      Revenue ($m)
   1,200
                       1,040
   1,000
                                                      990                    970                959         ▪ Revenue has reduced due to:
                                                                                                               ▪ copper line loss in areas where Chorus is not
     800                                                                                                            building the fibre network
     600                                                                                                        ▪   fixed wireless competition
     400
                                                                                                            ▪ Revenue loss partially offset by:
     200                                                                                                       ▪ strong fibre uptake
       -                                                                                                       ▪ customers moving to higher priced plans
                        FY17                          FY18*                  FY19               FY20                (e.g. 1Gbps, enhanced business plans)
   EBITDA ($m)                                                                              FY21 guidance
   680                                                                                     $640m - $660m
                  652
   660                                    653                                       648
                                                                      636
   640

   620

   600

   580
                                                                                                            ▪ Expect continued Fibre ARPU growth
   560                                                                                                      ▪ Ongoing focus on cost reduction
   540

   520

   500
                   FY17                   FY18*                       FY19          FY20        FY21
* New accounting standards IFRS 9, 15 and 16 were adopted from FY18

    36       17 November 2020                                                       UBS AUSTRALASIA VIRTUAL CONFERENCE
Income statement

                                                FY20      FY19
                                                 $m        $m

                                                                   >   ~$3m COVID-19 impact from industry hardship
 Operating revenue                               959       970         fund ($2m) and migrations/connections
 Operating expenses                             (311)     (334)    >   ~$9m COVID-19 impact across labour, other
                                                                       network (sercos $5m) and provisioning lines
 Earnings before interest, tax,                  648      636
 depreciation and amortisation (EBITDA)
 Depreciation and amortisation                  (402)     (393)    >   Increasing with fibre asset; Crown funding offset
                                                                       increased from $25m to $27m
 Earnings before interest and income tax         246       243
 Net finance expense                            (173)     (165)    >   EUR300m bond issued in Dec 2019; average
                                                                       interest rate on debt was 5.16%
 Net earnings before income tax                  73        78
 Income tax expense                              (21)     (25)
 Net earnings for the year                       52        53

37   17 November 2020             UBS AUSTRALASIA VIRTUAL CONFERENCE
Revenue
                         FY20      FY19
                          $m        $m
Fibre broadband (GPON)   393       294      >   Growing fibre uptake and ARPU: June FY20 $48.42* vs June FY19:
                                                $47.50
Fibre premium (P2P)       73        74      >   Direct fibre and backhaul growth helping offset legacy churn

Copper based voice        82       106
                                                Copper revenues declining as customers migrate to Chorus fibre or
Copper based broadband   271       344
                                                competing fibre/wireless networks
Data services copper      16        18
Field Services            65        74      >   Reduced demand largely due to COVID-19 restrictions on activity

Value added network       29        30
services
Infrastructure            24        24      >   Commercial co-lo growth offsetting reduced copper unbundling demand

Other                     6          6
Total                    959       970
                                                *FY20 ARPU adjusted to exclude COVID-19 related industry credits

38   17 November 2020           UBS AUSTRALASIA VIRTUAL CONFERENCE
Expenses
                           FY20        FY19
                            $m          $m
                                                >   5% reduction in staff numbers, offset by COVID-19 impact on capitalisation
Labour                      80          74          rates and annual leave costs, plus investment in regulatory capability
Network maintenance         64          75      >   Lower fault volumes due to favourable weather, fibre uptake and COVID-19
                                                    restrictions on activity
Other network costs         29          33      >   Included $5m COVID-19 serco support payments

IT                          47          50      >   New platforms enabling lower IT maintenance and support costs

Rent, rates and property    25          30      >   Property maintenance activity reduced, partly COVID-19 related
maintenance
Regulatory levies           7           16      >   Reduction in annual Telecommunications Development Levy

Electricity                 15          17      >   Lower electricity prices and consumption

Provisioning                5           6
Consultants                 9           7       >   Increase in external advice related to new regulatory framework

Insurance                   3           3
Other                       27          23      >   Increased marketing to support copper to fibre migration

Total                      311         334

39   17 November 2020             UBS AUSTRALASIA VIRTUAL CONFERENCE
Reactive maintenance: Chorus network
      Key drivers for $58m spend                                                                     Reactive spend by type
                                                                                           20
     ▪ reactive maintenance spend in H2 FY20 was affected by COVID-                        15
        19 with lower reported fault volumes
                                                                                       $m 10
     ▪ copper (fixed and variable) fault volumes reduced due to drought                     5
        conditions in upper North Island and the ongoing reduction in
        total copper connections                                                            0
                                                                                                   Fibre       Copper - fixed    Copper -
                                                                                                                                 variable
     ▪ fibre maintenance increasing as share of connections grows, but                               H1 FY19     H2 FY19    H1 FY20   H2 FY20
        fault rate is lower on fibre (although costlier to fix)
                                                                                                Copper - reactive spend by area
     ▪ long run annual saving from full copper to fibre migration in                      15
        Chorus UFB areas estimated at ~$10m p.a for fixed fault costs
     Note:                                                                             $m 10
     ▪ reactive maintenance excludes spend on proactive maintenance and
       customer networks (i.e. premises wiring, no fault found, cancellations)             5
     ▪ ‘fixed’ faults: occur in parts of the network that affect multiple customers
       (e.g. cable between exchange and cabinet)                                           0
     ▪ ‘variable’ faults: only affect one customer (e.g. cable on customer property)            Chorus UFB     Rural (Non UFB)   LFC UFB

40     17 November 2020                           UBS AUSTRALASIA VIRTUAL CONFERENCE
Net debt/EBITDA

                                  As at              > S&P ND/EBITDA threshold 4.25x on a sustained basis
                              30 June 2020           > Moody’s intend to review 4.2x threshold once there is
                                   $m                    further clarity on regulatory framework and portion of
Borrowings                        2,234                  revenue regulated
+ PV of CIP debt                     183             >   Financial covenants require senior debt ratio to be no
securities (senior)                                      greater than 4.75 times

+ Net leases payable                 263
                                                     > The Board considers that a ‘BBB’ credit rating or
Sub total                         2,680                  equivalent credit rating is appropriate for a company
- Cash                                  0                such as Chorus.
Total net debt                    2,680
Net debt/EBITDA*                4.14 times

*Based on S&P and bank covenant methodologies

41   17 November 2020                       UBS AUSTRALASIA VIRTUAL CONFERENCE
Crown financing and debt profile
                                                     > At 30 June, debt of $2,234m comprised:
     > up to $1.33 billion CIP financing                 ▪ Long term bank facilities of $550m ($30m drawn); $5m OD
          available by 2023 (57:43 equity/debt)          ▪ NZ bond: $400m and $500m
     >    $1,067m drawn at 30 June 2020                  ▪ Euro Medium Term Notes $1,299m (NZ$ equivalent at hedged rates)
                                                                                         CIP debt securities available
                       drawn   undrawn
                                                                                         Face value of CIP debt securities issued
                                                          800
                                                                                         EUR EMTN
                                                          700
                                                                                         NZ Bond
                                                          600
                                                                                         GBP EMTN
                                                          500
                                                    NZ
NZ                                                        400         785
                                                    $M
$M
          462         462        161                      300
                                                                                  514   500
                                                          200   400                                                          46
                                                                                                               39
                                                          100                                    20                         163
                                                                             85                  86           128
                                 143                       0
                                           105

       UFB1       UFB1 DEBT    UFB2/2+   UFB2/2+
      EQUITY                    EQUITY    DEBT

     42    17 November 2020                 UBS AUSTRALASIA VIRTUAL CONFERENCE
Crown financing
     ▪ CIP equity securities
        •   unique class of security with no right to vote at       Equity
            shareholder meetings, but entitle the holder to a       securities
            right to repayment preference on liquidation            subject to
        •   an increasing portion of the securities will attract    paying
            dividend payments from 30 June 2025 onwards             dividends      30 June   30 June   30 June   30 June
        •   the dividend rate is based on 180 day NZ bank bill      (cumulative)   2025      2030      2033      2036      TOTAL
            rate, plus 6% p.a. margin
                                                                    UFB1 & 2       $85.3m    $197.1m   $377.7m   $766.4m   $766.4m
        •   may be redeemed at any time by cash payment of
            total issue price or the issue of Chorus shares (at a
            5% discount to the 20-day VWAP for Chorus
            shares)

     ▪ CIP debt securities
                                                                    Debt
        •   unsecured, non-interest bearing and carry no voting
                                                                    securities
            rights at shareholder meetings
                                                                    maturity       30 June   30 June   30 June   30 June
        •   Chorus is required to redeem the securities in          profile        2025      2030      2033      2036      TOTAL
            tranches from 30 June 2025 to 2036 by repaying
            the issue price to the holder                           UFB1 & 2       $85.3m    $104.7m   $166.7m   $210.2m   $566.9m

43   17 November 2020                           UBS AUSTRALASIA VIRTUAL CONFERENCE
You can also read