HALF YEAR RESULT - Chorus NZ

Page created by Franklin Alexander
 
CONTINUE READING
HALF YEAR RESULT - Chorus NZ
HALF YEAR RESULT

H1 FY20 RESULT PRESENTATION
24 February 2020
HALF YEAR RESULT - Chorus NZ
Disclaimer
This presentation:
• Is provided for general information purposes and does not constitute investment advice or an offer of or invitation to purchase Chorus
securities.
• Includes forward-looking statements. These statements are not guarantees or predictions of future performance. They involve known
and unknown risks, uncertainties and other factors, many of which are beyond Chorus’ control, and which may cause actual results to
differ materially from those contained in this presentation.
• Includes statements relating to past performance which should not be regarded as reliable indicators of future performance.
• Is current at the date of this presentation, unless otherwise stated. Except as required by law or the NZX and ASX listing rules, Chorus is
not under any obligation to update this presentation, whether as a result of new information, future events or otherwise.
• Should be read in conjunction with Chorus’ audited consolidated financial statements for the year to 30 June 2019 and NZX and ASX
market releases.
• Includes non-GAAP financial measures such as "EBITDA”. These measures do not have a standardised meaning prescribed by GAAP and
therefore may not be comparable to similar financial information presented by other entities. They should not be used in substitution for,
or isolation of, Chorus' audited consolidated financial statements. We monitor EBITDA as a key performance indicator and we believe it
assists investors in assessing the performance of the core operations of our business.
• Has been prepared with due care and attention. However, Chorus and its directors and employees accept no liability for any errors or
omissions.
• Contains information from third parties Chorus believes reliable. However, no representations or warranties (express or implied) are
made as to the accuracy or completeness of such information.

   2   24 February 2020                             H1 FY20 RESULT PRESENTATION
HALF YEAR RESULT - Chorus NZ
Agenda
    JB Rousselot, CEO    > HY20 overview                                    4
                         > Connections performance                          5-7
                         > UFB rollout and uptake                           8-10
                         > Subcontractor initiatives                        11
    David Collins, CFO   > Financial results                                12-16
                         > Capex                                            17-19
                         > FY20 guidance update and UFB recap               20-21
                         > Dividend policy and capital management           22-27
                         > Regulation: asset beta and WACC                  28-30
    JB Rousselot, CEO    > Winning with fibre: data usage and performance   31-33
                         > Strategic priorities                             34-42
                         Appendix A: Connection and market trends           43-45

3   24 February 2020               H1 FY20 RESULT PRESENTATION
HALF YEAR RESULT - Chorus NZ
A hyper active six months

▪   CEO transition
▪   UFB1 rollout completed (2011-2019)
▪   launch of Hyperfibre (2 and 4Gbps)
▪   contract for rural mobile backhaul
▪   S&P threshold increased to 4.25x
▪   draft Fibre Input Methodologies decision
▪   7-year EUR300 million bond issued
▪   merger of Customer Care and Network Field
    Management teams

                                                  1. Earnings before interest, income tax, depreciation and amortisation (EBITDA) is a
                                                  non-GAAP profit measure.

    4   24 February 2020           H1 FY20 RESULT PRESENTATION
HALF YEAR RESULT - Chorus NZ
Strong broadband growth

                                                                             Chorus UFB zone broadband mix
> Total broadband connections increased by                     1,000,000
     10k to 1,206,000 (HY19:-1k)                                900,000
     ▪ fibre now 68% of broadband connections in                800,000
       Chorus UFB zone                                          700,000
                                                                600,000
                                                                500,000
> Total fixed line connections declined by 18k                  400,000
     to 1,432,000 (HY19:-40k)                                   300,000
                                                                200,000
                                                                100,000
                                                               No. of -
                                                               connections

     Note: Q2 typically sees seasonal effect of holidays and
     student disconnections on total connections volumes                      Fibre   Copper broadband

 5    24 February 2020                         H1 FY20 RESULT PRESENTATION
HALF YEAR RESULT - Chorus NZ
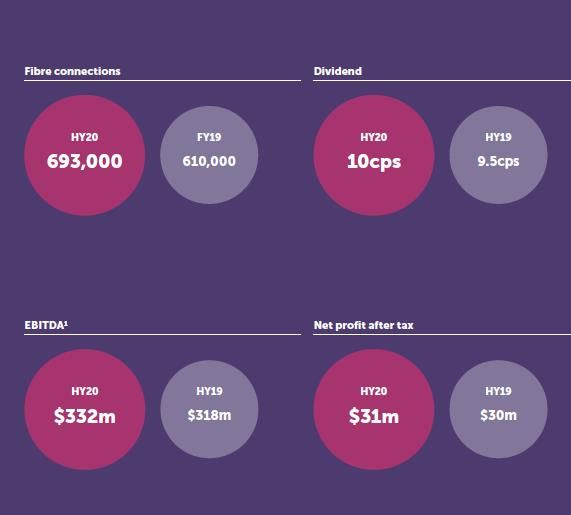
Gigabit is becoming the new norm
              Total mass market fibre uptake by plan type
        100     Business/Education plans
                                                                                   > 82,000 mass market fibre connections added
                      1Gbps                   $60 p.m.
         90
                      200Mbps
                                                                                   > 1Gbps connections grew by 29,000 (50%)
                                               $55 p.m.
                                                                                     ▪ attractive second tier RSP promotions
         80
                                                                                     ▪ RSP migration of 200Mbps customers
         70                                                                          ▪ now 13% of connections and growing
                       100Mbps                $46 p.m.
         60
                                                                                                          Fibre plan movement by quarter
% of
plans    50                                                                                         30
                                                                                                                                  Q1    Q2
         40                                                                                         20
                                                                                      Change in
         30
                                                                                      connections   10
                                                                                      (‘000s)
         20
                                                                                                     0
         10
                        50Mbps                 $42.50 p.m.                                          -10
                                                                                                           50Mbps   100Mbps   200Mbps    1Gbps
         0
         Dec-18                 Mar-19     Jun-19            Sep-19       Dec-19

    6     24 February 2020                                   H1 FY20 RESULT PRESENTATION
HALF YEAR RESULT - Chorus NZ
Connection changes by Zone (indicative)

                                                                                                                Chorus UFB          Rural (non-        Local Fibre
Q2       -7k -2k                                                                                                zone*               UFB) zone          Company
                                                                                                                                                       UFB zone
                      LFC
                                                                                 Total connections at               1,096,000             196,000         124,000
Q1       -7k   -3k
                      Zone                Broadband connections                  31 Dec**
                                          Copper (no broadband) connections      Broadband connections                  969,000            154,000          83,000

Q2        N/C        -2k
                                                                                 Copper (no broadband)                  127,000             42,000          41,000
                           Rural                                                 connections
                           Zone                                                  * Includes planned UFB1, 2 and 2+ coverage
Q1        +1k        -2k                                                         **Excludes 16k fibre premium and data services (copper) connections

Q2                                      +7k                         -8k
                                                                           Chorus
                                                                           UFB Zone
Q1                                      +16k                       -11k

     -             200,000    400,000    600,000    800,000    1,000,000
                                   No. of connections

     7         24 February 2020                               H1 FY20 RESULT PRESENTATION
HALF YEAR RESULT - Chorus NZ
Completion of UFB1 rollout a major milestone

    28,000kms of fibre and growing
                                                         100,000
                                                          90,000

     > UFB1 rollout completed 1 month ahead of            80,000

         schedule and within $1.8 billion guidance        70,000
                                                          60,000
                                                          50,000
     > UFB2* rollout already 37% complete                 40,000
                                                          30,000
     > 909,000 premises passed (FY19: 842,000)            20,000
         out of 1,054,000 target by December 2022         10,000
                                                                0
                                                                      FY20        FY21       FY22        FY23
                                                                     Premises passed*      Premises to pass

      *includes UFB2+ extension                                     *excludes UFB1 greenfields

8   24 February 2020              H1 FY20 RESULT PRESENTATION
HALF YEAR RESULT - Chorus NZ
UFB uptake: 56% within completed footprint
        1,185,000 customers able to connect (FY19: 1,108,000)
      > 664,000 connections (FY19: 584,000) within completed UFB footprint (includes business premium fibre)
        ▪ Auckland: 63% fibre uptake by address; 76% of our broadband connections are on fibre

                                                                                        Auckland: Chorus
   UFB2: 34% uptake in
                                                  UFB1: 58% uptake                    broadband connections
    completed footprint
                                                                                           by type (%)
                           32,000
                                                                                                 11

                                                                                          13
166,000                                       459,000
                                   62,000
                                                                       632,000
                                                                                                           76

                                                                                  Fibre   VDSL (copper)   ADSL (copper)
 Connections     Fibre available    To pass

  9     24 February 2020                                H1 FY20 RESULT PRESENTATION
HALF YEAR RESULT - Chorus NZ
Fibre installations consistent with FY19 trend
                                                                                                                     Uptake

                                                                     Fibre installations             (NZ wide)
> 99,000 fibre installations completed in HY20              20,000
     (HY19: 95k)                                                                    FY18      FY19     FY20

     ▪ customer satisfaction up from 7.7 (June) to 7.8      18,000
       (December)
     ▪ weighted average lead times down from 8 days         16,000
       (June) to 7 days (December)
     ▪ work in progress reduced from 23k (June) to 20k      14,000
       (December)
     ▪ field crew levels stable at ~670                     12,000

                                                            10,000

                                                             8,000
                                                                     July Aug Sept Oct Nov Dec Jan Feb Mar April May June

10    24 February 2020                 H1 FY20 RESULT PRESENTATION
Subcontractor initiatives

     ▪    supplier code of practice incorporated into key supply contracts
     ▪    established worker welfare portal and independent whistle-blower process
     ▪    implemented some changes to payment codes and processes to improve fairness and transparency
     ▪    subcontractor companies required to complete training to ensure awareness of minimum employment
          standards, along with mandatory statutory declarations of compliance
     ▪    trust fund established to support workers affected by discontinued contractors
     ▪    ongoing audit programme with regular updates to the Board
     ▪    Visionstream and UCG completed strategic workforce plans for expected decline in workforce numbers

         Contract scope    Connecting premises       UFB2 network build    Maintenance of copper
                           to fibre                                        and fibre; fibre build
                                                                           outside UFB areas

         Contractor        Electronet                Broadspectrum         Downer
                           UCG                       Electronet            Visionstream
                           Visionstream              Visionstream

         Contract period   Until September 2020      Until December 2022   Until March 2022

11   24 February 2020                             H1 FY20 RESULT PRESENTATION
Financial performance
                       David Collins, Chief Financial Officer

24 February 2020            H1 FY20 RESULT PRESENTATION
Income statement
                                            H1      H2      H1
                                           FY20    FY19    FY19
                                            $m      $m      $m
 Operating revenue                         483      481     489     >   Broadband revenue grew; copper connections
                                                                        and demand for field service activity reduced
 Operating expenses                        (151)   (163)   (171)    >   Positive trends across most cost lines

 Earnings before interest, tax,            332     318      318
 depreciation and amortisation
 (EBITDA)
 Depreciation and amortisation             (198)   (197)   (196)    >   Growing fibre asset depreciation partially offset by
                                                                        increasing amortisation of Crown financing
 Earnings before interest and income tax   134      121     122
 Net interest expense                      (88)    (86)     (79)    >   Increase due to growing bond debt and Crown
                                                                        financing interest
 Net earnings before income tax             46      35       43
 Income tax expense                        (15)    (12)     (13)
 Net earnings for the year                  31      23      30

13   24 February 2020                 H1 FY20 RESULT PRESENTATION
Revenue
                         H1     H2        H1
                        FY20   FY19      FY19
                         $m     $m        $m
 Fibre broadband        187    158        136     >   Growth in fibre connections and uptake of higher ARPU plans
 (GPON)
 Fibre premium (P2P)     36     37        37
 Copper based           144    163        181
 broadband
                                                      Copper revenues reducing as customers migrate to Chorus fibre
 Copper based voice      42     50        56          or competing fibre/wireless networks

 Data services copper    8      8         10
 Field services          33     35        39      >   Reduction in third party requests for network relocation

 Value added network     16     14        16
 services
 Infrastructure          12     12        12
 Other                   5      4          2      >   One-off legal settlement

 Total                  483    481       489

14   24 February 2020          H1 FY20 RESULT PRESENTATION
Expenses
                            H1     H2          H1
                           FY20   FY19        FY19
                            $m     $m          $m
                                                       >   Staff numbers now 862 vs 914 (HY19) One-off restructuring
Labour                      39     37           37         costs of $1.5m
Network maintenance         34     37           38     >   Growing proportion of connections on fibre and fewer
                                                           weather events affecting service
Other network costs         12     15           18     >   Fewer 3rd party requests for network relocation

IT                          23     24           26     >   New platforms reducing IT maintenance and support costs

Rent, rates and property    11     17           13
maintenance
Electricity                 8       8           9      >   Lower electricity prices and reduced power consumption

Provisioning                2       3           3
Insurance                   2       1           2
Consultants                 5       3           4      >   Increase in external advice for new regulatory framework

Regulatory levies           4       8           8      >   Reduction in required contribution to Telco Development Levy

Other                       11     10           13
Total                      151    163          171

15   24 February 2020             H1 FY20 RESULT PRESENTATION
Reactive maintenance: Chorus network
      Key drivers for $31m spend                                                                     Reactive spend by type
                                                                                           20
     ▪ copper (fixed and variable) fault volumes reduced due to                            15
        favourable weather, particularly in Auckland region, and
        reduction in total copper connections.                                         $m 10
                                                                                            5
     ▪ fibre maintenance increasing as share of connections grows,
        but fault rate is lower on fibre (although costlier to fix).                        0
                                                                                                   Fibre        Copper - fixed      Copper -
                                                                                                                                    variable
     ▪ long run annual saving from full copper to fibre migration in                                  H1 FY19      H2 FY19       H1 FY20
        Chorus UFB areas estimated at ~$10m p.a.
                                                                                                Copper - reactive spend by area
                                                                                          15

     Note:                                                                             $m 10
     ▪ reactive maintenance excludes spend on proactive maintenance and
       customer networks (i.e. premises wiring, no fault found, cancellations)
                                                                                           5
     ▪ ‘fixed’ faults: occur in parts of the network that affect multiple customers
       (e.g. cable between exchange and cabinet)
     ▪ ‘variable’ faults: only affect one customer (e.g. cable on customer property)       0
                                                                                                Chorus UFB   Rural (Non UFB)         LFC UFB

16     24 February 2020                                H1 FY20 RESULT PRESENTATION
Capex: Fibre
     45,000 brownfields premises passed

     ▪ Cost per UFB1 premises passed (CPPP): ~$1,558 vs $1,500 - $1,600 guidance

     Fibre capex                        H1 FY20   H2 FY19   H1 FY19
                                          $m        $m        $m

     UFB communal                           100       126       119 >   comprising $26m for UFB1; $74m for UFB2

     Fibre connections & layer 2            155       147       161 >   99,000 installations, including 14,000 UFB2

     Fibre products & systems                 7        10         7
     Other fibre connections & growth        28        29        36 >   includes greenfields spend of $20m (FY19: $34m)

     Customer retention costs                10        21         8 >   incentive offers linked to fibre connection volumes

     Subtotal                              300        333       331

17   24 February 2020                     H1 FY20 RESULT PRESENTATION
Capex: Fibre connections & layer 2
     Connections capex of $155m
     ▪    Cost per premises connected (CPPC):
          ▪ UFB1: $995* vs $1,000 - $1,150 guidance
          ▪ UFB2: $1,179* - in line with the lower end of UFB2 programme guidance of $1,650 - $1,850 in 2017 dollars
          * excludes layer 2 and includes standard installations, some non-standard single dwellings and service desk costs
          Note: UFB2 programme guidance includes layer 2, backbone costs for multi-dwelling units and rights of way with 10 or fewer premises,
          and service desk costs
      Fibre connections & layer 2 capex                                           H1 FY20               H2 FY19              H1 FY19

      Layer 2                                                                       $12m                   $16m                 $9m
      Premium business fibre connections                                            $6m                    $4m                 $4m
                                                                               800 connections        600 connections     600 connections
      Single dwelling units and apartments                                          $98m                   $98m               $100m
                                                                               99k connections        91k connections     95k connections

      Backbone build: multi-dwelling units and rights of way                        $39m                   $29m                 $48m
                                                                               6.5k completed         6.5k completed       9.5k completed
      TOTAL SPEND                                                                  $155m                  $147m                $161m

18   24 February 2020                             H1 FY20 RESULT PRESENTATION
Capex: Copper and Common
     Copper capex                      H1 FY20   H2 FY19   H1 FY19
                                         $m        $m        $m
     Network sustain                     15        25         19     >   reducing as copper connections decline and pole
                                                                         replacement programme slows
     Copper connections                   1         1         1
     Copper layer 2                       3         6         6
     Product                              0         0         1
     Customer retention costs            10        10         12
     Subtotal                            29        42        39

     Common capex                      H1 FY20   H2 FY19   H1 FY19
                                         $m        $m        $m
     Information technology              20        17        17      >   New IT systems to support customer delivery

     Building & engineering services      8        15         7

     Other                                0         2         1
     Subtotal                            28        34        25

19   24 February 2020                     H1 FY20 RESULT PRESENTATION
Guidance update
     > EBITDA: new range of $640m to $655m
         ▪ The revision to our prior range of $625m to $645m reflects:
            •   positive broadband connections performance and ARPU in H1
            •   the benefit of cost savings achieved in H1 and expectations for H2
            •   confirmation of a reduction in the Telecommunications Development Levy
            •   greater fibre uptake spend in H2

     > Gross capex: no change to $660m - $700m range
         ▪ Currently tracking towards the top half of gross capex guidance
            • Fibre connections & layer 2 capex increased from original range of $260m to $280m to a new
              range of $295m to $315m, reflecting new forecast of 180k to 200k fibre connections vs 160k
              to 180k previously

20   24 February 2020                 H1 FY20 RESULT PRESENTATION
UFB programme recap
     UFB1                                                          UFB2
> rollout completed at top of $1.75 to $1.8 billion communal
                                                                   Communal          Combined guidance range for UFB2
  capex guidance range
                                                                   rollout: $505 -   and 2+
> Crown financing will be claimed for ~827,000 premises            $565 million
  passed =$924m
  ▪ includes ~39k greenfields premises
                                                                   Cost to           In 2017 dollars and including layer
                                                                   connect:          2, backbone costs for MDUs and
> initial programme guidance for UFB1 cost to connect a            $1,650 -          rights of way with 10 or fewer
     standard residential connection is no longer relevant given   $1,850            premises and service desk costs
     end of rollout, non-standard connections and linkage to
     2011 dollars
     ▪ we’ll continue to provide an annual view on cost to
        connect. FY20 guidance remains $1,000 - $1,150
        (excluding layer 2 and including standard installations
        and some non-standard single dwellings and service
        desk costs)

21    24 February 2020                     H1 FY20 RESULT PRESENTATION
Interim dividend of 10cps, fully imputed

     ▪   supplementary dividend of 1.76 cps payable to non-resident shareholders
     ▪   record date: 17 March 2020
     ▪   payment date: 14 April 2020
     ▪   Dividend Reinvestment Plan available to New Zealand and Australian resident
         shareholders with no discount to be applied
     ▪   No change to FY20 dividend guidance of 24cps, subject to no material adverse changes
         in circumstances or outlook

22   24 February 2020                   H1 FY20 RESULT PRESENTATION
Current dividend policy until June 2021

     > In August 2019, the Board noted it expects to continue to be able to provide shareholders with
          modest dividend growth through to June 2021, subject to no material adverse changes in
          circumstance or outlook

     > This timeframe reflects:
        • the scheduled release of the Commerce Commission’s final determination of our regulated
               asset base and maximum allowable revenue for fibre
           •   following this determination, an expected update from Moody’s on their intention to place
               Chorus’ credit metric threshold more in line with other regulated utilities
           •   Chorus’ expected substantial growth in positive free cash flow as the UFB rollout nears
               completion, after 10 years of substantial investment, and connection spend gradually reduces

23   24 February 2020                     H1 FY20 RESULT PRESENTATION
Substantial free cash flow as UFB rollout ends

     > UFB communal capex will begin decreasing                       UFB capex demands will reduce
        following the end of UFB1 and as the UFB2 rollout                 significantly from FY21
        (premises passed) steps down through to December      350
                                                                             Communal spend        Connection spend
        2022
                                                              300

                                                              250
     > UFB connections capex is expected to gradually
        taper off, subject to ongoing demand and timing of    200
        future copper migration in selected areas
                                                              150                                  Illustrative only

                                                              100
     > Copper capex will continue to trend down as copper
        connection numbers reduce across our UFB/LFC zones    50

                                                               0                    UFB2 rollout ends Dec 2022

     > Other ongoing discretionary capex (e.g. footprint      $m      FY17   FY18   FY19   FY20*    FY21     FY22      FY23
        expansion) subject to market drivers and regulatory                                *based on midpoint of FY20 guidance
        investment incentives

24   24 February 2020                   H1 FY20 RESULT PRESENTATION
Transitioning to a cash flow based dividend policy
         Free cash flow preferred future dividend metric                      Net cash flows from
     > The Board recognises that investors have had constrained               operating activities
         returns through the decade long UFB investment cycle and
         our focus is on returning surplus cash flows to shareholders           Sustaining capital
     >   Our expectation is from FY22 we will transition to a dividend            expenditure
         policy based on a pay-out range of free cash flow that           All fibre, copper and common capex,
         reflects:                                                        excluding:
                                                                          ▪ UFB communal and future footprint
            • comparable Australasian infrastructure and utility-like        expansion
               businesses that pay out the majority of FCF                ▪ fibre connections/greenfields
                                                                          ▪ customer retention spend
            • a focus on providing shareholders with dividend
               predictability, stability and sustainable growth
            • robust management of capital expenditure
            • maintenance of leverage at levels consistent with a               Free cash flow*
               Baa2/BBB credit rating
     >   In the event of future credit rating threshold uplift, Chorus   *Note: Chorus will continue to have
         would also consider appropriate capital management activity,    elevated UFB related capex through
         noting the current ascribed capital balance of ~$225m           the transition period

25    24 February 2020                     H1 FY20 RESULT PRESENTATION
Net debt/EBITDA
Ratings agencies are revising threshold views as fibre rollout risk reduces

                                  As at               > S&P increased their ND/EBITDA threshold from 4x to
                              31 December                4.25x on a sustained basis
                                  2019
                                   $m
                                                      > Moody’s have stated their intention to review their
Borrowings                        2,876                  current 4.2x threshold in mid 2021
+ PV of CFH debt                     174
securities (senior)                                   > Financial covenants require senior debt ratio to be
+ Net leases payable                 255                 no greater than 4.75 times

Sub total                         3,305
                                                      > The Board considers that a ‘BBB’ credit rating or
- Cash                             (678)                 equivalent credit rating is appropriate for a company
Total net debt                    2,627                  such as Chorus.
Net debt/EBITDA*                4.06 times
*Based on S&P and bank covenant methodologies

26   24 February 2020                           H1 FY20 RESULT PRESENTATION
Crown financing and debt profile
                                                         > At 31 December, debt of $2,876m comprised:
     > up to $1.33 billion CIP financing                    ▪ Long term bank facilities of $550m undrawn;
          available by 2023 (57:43 equity/debt)             ▪ NZ bond: $400m and $500m
     >    $1,007m drawn at 31 December 2019                 ▪ Euro Medium Term Notes $1,976m (NZ$ equivalent at hedged rates)
                                                                                                CIP debt securities available
                       drawn   undrawn
                                                                                                Face value of CIP debt securities issued
                                                             800
           8            8                                                                       EUR EMTN
                                                             700
                                                                                                NZ Bond
                                                             600
                                                                                                GBP EMTN
                                                             500
                                                       NZ
NZ                                                           400               785
                                                       $M
$M                                                                 677
          454          454                                   300
                                 203                                                      514   500                                 58
                                                             200         400                                           41
                                                                                     2                    21
                                                             100                                                                   161
                                                                                     84                   84          126
                                  99       105                 0

       UFB1        UFB1 DEBT   UFB2/2+   UFB2/2+
      EQUITY                    EQUITY    DEBT

     27    24 February 2020                        H1 FY20 RESULT PRESENTATION
Regulation: a recap
Parameters                    Summary of key parameters from the Commission’s draft decision
Crown financing               Accepted that Crown financing is debt-like in nature. Calculation inputs to be clarified.
Taxation                      Accepted that tax losses in pre-implementation period can be carried forward.
TAMRP                         Tax-Adjusted Market Risk Premium updated from 7% to 7.5%.
Credit rating                 Inconsistent use of Chorus’ actual BBB rating for Crown financing vs BBB+ for WACC.
WACC: 2011-2022               Suggest WACC for the unrecovered loss asset will be adjusted on an annual basis from 2011
                              to 2022, using a diminishing period for calculating the risk free rate each year.
WACC: asset beta              Proposed a revised asset beta of 0.49, up from 0.46, for both pre and post 2022 periods.
                              Commission says difficult to quantify the pre-2022 asset beta and unrecovered losses
                              compensate for higher systematic risk.
WACC: percentile              Propose no uplift (above 50th percentile) is required to mitigate risk of under-investment. We
                              believe uplift to 75th percentile should apply for initial rollout, consistent with regulatory
                              practice at the time, and 67th percentile from implementation date.
Ex-ante allowance             10bps (of the average total RAB) ex-ante allowance proposed, from a range of 5 to 40bps, to
for asset stranding           be included in the maximum allowable revenue. We believe an accurate allowance requires
                              confirmation of the total RAB and our experts showed it could be above 40bps.
Depreciation                  Act requires straight line depreciation for initial RAB valuation, but Commission accepts non-
                              standard depreciation (i.e. tilted) could be considered post-implementation.
     28    24 February 2020                         H1 FY20 RESULT PRESENTATION
Draft asset beta does                                      0.7
                                                                             Reasonableness checks
    not reflect a fibre access
    network business                                          0.65   CNU estimate:
                                                                     during rollout
●    The Commission’s 0.49 asset beta estimate is
     below multiple benchmarks and based on                          CNU estimate:
     averaging a narrow telco comparator group.                0.6
                                                                     post 2022
●    Using a broader Damodaran telco group removes
     potential selection bias and indicates a range of
     0.54 to 0.65.                                            0.55
●    We estimate an asset beta of 0.65 during UFB
     rollout, and 0.60 for the first regulatory period.
●    In January Ofcom (UK) released detailed fibre
                                                               0.5   Commission
     investment proposals including asset beta: 0.65
                                                                     draft 0.49
     for FTTP to reflect higher risks vs 0.57 for
     Openreach’s established copper and dark fibre
     network (like Chorus’ legacy business)                   0.45
●    The financial loss asset does not compensate for                              Ofcom (UK): Ofcom: fibre to
                                                                                    Openreach
                                                                                                                  Damodaran
                                                                                                premises (2020) (Telco: wireless
                                                                                                                                 Crown Fibre
                                                                                                                                   Holdings
                                                                                                                                               NBN estimate

     systematic or asset stranding risk. The loss asset                           copper (2020)                  and services) estimate (2011)
     simply adjusts the initial RAB to better reflect costs
     that weren’t recovered through historic UFB pricing
     and demand. Recovery of these costs is not
     guaranteed and occurs over a long time horizon.

29    24 February 2020                           H1 FY20 RESULT PRESENTATION
A fair return?
> The Commission’s proposed annualised                               > Post January 2022: the WACC implied by
         approach to calculating the 2011 to 2022                        the draft decision does not reflect the
         WACC does not reflect a fair return for the                     nature of a fibre access business
         UFB investment programme
     ●       Chorus committed to UFB1 investment in 2011 and         ●       A 4.88% fibre WACC is only slightly above the
             financed our business accordingly. We could not                 WACC recently set for electricity distribution
             revisit our UFB capex programme annually.                       businesses at 4.23% (noting a 7% TAMRP was
                                                                             used)
     ●       If the Commission chooses not to recognise this as
             a single regulatory period, the annual WACC             ●       Ofcom’s recent fibre investment proposal suggests:
             calculation should still use 10-year risk free rates,       ▪    a 6.5% to 6.6% WACC (post-tax, nominal) for a
             consistent with prior practice taken in unregulated              business investing in FTTP
             industries (e.g. fuel market study).
                                                                         ▪    a 5.9% WACC (post-tax, nominal) for Openreach
     ●       Crown Fibre Holdings (CFH) detailed the WACC for                 as a predominantly legacy copper access
             a fibre company to Parliament in 2011:                           business
         ▪     CFH estimated a WACC of 7.72% to 8.97%
               (TCNZ co-operate scenario) and used a 9%
               WACC to establish wholesale pricing
         ▪     The NZ 10-year Government bond rate was used
               for the risk-free rate (5.25%)

30       24 February 2020                             H1 FY20 RESULT PRESENTATION
Winning with fibre
                              JB Rousselot, Chief Executive Officer

H1 FY20 RESULT PRESENTATION
24 February 2020
Monthly average data usage exceeds 300GB
          Monthly average data usage                                                                                                                                                                        > Monthly average data usage per connection on our network grew
          per connection on our network                                                                                                                                                                          to 302GB in January 2020
                                                                                                                                                                                                                 ▪ 372GB on fibre; 205GB on copper
     400
                                                                                                                                                                                             363
     350                                                                                                                                                                                                    > Fixed line networks carry more than 90% of NZ internet traffic
                                                                                                                                                                                             293
     300                                                                                                                                                                                                                       Chorus total monthly (January)
                                                                                                                                                                                                                    400                network traffic
Data 250
usage                                                                                                                                                                                        200                    350
(GB) 200
                                                                                                                                                                                                                    300
     150
                                                                                                                                                                                                                    250

     100                                                                                                                                                                                                   GB        200
                                                                                                                                                                                                           (millions)
         50                                                                                                                                                                                                         150
                                                           Copper                                        Fibre                                       Average
                                                                                                                                                                                                                    100
          0
                       Mar-15

                                                           Mar-16

                                                                                               Mar-17

                                                                                                                                   Mar-18

                                                                                                                                                                       Mar-19
              Dec-14

                                                  Dec-15

                                                                                      Dec-16

                                                                                                                          Dec-17

                                                                                                                                                              Dec-18

                                                                                                                                                                                                  Dec-19
                                Jun-15

                                                                    Jun-16

                                                                                                        Jun-17

                                                                                                                                            Jun-18

                                                                                                                                                                                Jun-19
                                         Sep-15

                                                                             Sep-16

                                                                                                                 Sep-17

                                                                                                                                                     Sep-18

                                                                                                                                                                                         Sep-19

                                                                                                                                                                                                                     50

                                                                                                                                                                                                                      0
                                                                                                                                                                                                                      2014   2015   2016   2017   2018   2019   2020

    32    24 February 2020                                                                                                                                                      H1 FY20 RESULT PRESENTATION
Fibre delivers superior
 broadband performance
Commerce Commission report shows:

> Fibre consistently enables multiple streams of
      Ultra High Definition content while other
      technologies have variable performance - see
      Figure 11.

> Fibre ensures low latency performance. Latency
      above 30ms can result in poor experience of
      applications such as gaming or video calls - see
      Figure 13.

 Source: Measuring Broadband New Zealand, Spring Report,
 December 2019, Commerce Commission

 33     24 February 2020                   H1 FY20 RESULT PRESENTATION
Our strategic priorities

                                                              Develop
     Win in our         Optimise                             long term
                                                  Grow new
     core fibre         non-fibre                             future of
                                                  revenues
     business            assets                                  the
                                                              business

34   24 February 2020       H1 FY20 RESULT PRESENTATION
Win in
our core
  fibre
business
                Driving market penetration and share
                Taking active wholesaling to another level

               > Chorus managed migration programme
                   ▪ 20,000 installations completed July to January
                   ▪ 15% uplift in uptake levels in our campaign areas
                   ▪ 35% of visited UFB2 homes agree to an installation, leading to
                        50% uptake within 6 months

               > Current marketing incentives
                   ▪ MDU installation campaigns
                   ▪ retailer credits up to $170 for gigabit connections above mix
                        thresholds
                   ▪    15,000 prezzy card offers sent to offnet consumers

35   24 February 2020                           H1 FY20 RESULT PRESENTATION
Win in
      our core
        fibre
      business

               Fibre continues to grow Wellington connections
                Return to connection growth in recently completed UFB areas
No. of                                                               No. of
connections                                                          connections
                           Karori exchange                                 1700
                                                                                           Island Bay exchange
     3200

     3100

     3000

     2900
                                                                          1600
     2800

     2700

     2600

     2500
                       UFB rollout                                        1500
                                                                                                            UFB rollout
            Sep-18     Dec-18    Mar-19   Jun-19   Sep-19   Dec-19               Sep-18   Dec-18   Mar-19   Jun-19   Sep-19   Dec-19

      36      24 February 2020                       H1 FY20 RESULT PRESENTATION
Win in
our core
  fibre
business

                Enhancing customer experience
                Fastest activation, best speed + experience
                                                                             Net promoter score
            > Chorus led installations: achieving 8.1                               (NPS)
                customer satisfaction vs 7.9 for regular ‘on-
                demand’ ordering                                 NPS           by fibre speed
                                                                 60

            > Wi-Fi ONT: ~130,000+ Wi-Fi capable ONTs            50
                                                                                                            50
                installed to date; RSP trials underway           40
                                                                 30
                                                                                                   30
            > Small business plans: ~1,500 connections           20
                                                                                        22
                with enhanced restoration target                 10
                                                                            12
                                                                  0
                                                                         50 or less     100        200     1,000

                                                                                 Fibre plan speed (Mbps)

37   24 February 2020                      H1 FY20 RESULT PRESENTATION
Win in
   our core
     fibre
   business
                         Regulatory framework
                   2020                             2021                            2022-2024                                 2025-2030
                                                                                    1st   regulatory period                   2nd regulatory
                                                                                                                              period
                   •     Mid-year: Final Input      •   June: Final Price Quality   •     Commission may choose to review
                         Methodologies decision         decision                          revenue cap framework and
Regulatory         •     Mid-year: copper                                                 anchor products
process                  withdrawal and 111 codes                                   •     Commission required to review
                   •     Q4: Draft Price Quality                                          copper pricing framework no later
                         path decision                                                    than 2025
                                                                                   Price caps + inflation
                                                                                                               Pricing subject
                          Price caps + annual inflation adjustment on         adjustment on fibre voice and
Fibre pricing                                                                                                  to price quality
                                    contracted UFB products                   broadband ‘anchor’, and direct
                                                                                                                determination
                                                                                    fibre access service
Copper in              Copper network to be deregulated and service can be withdrawn subject to Chorus’ choosing and minimum
UFB areas                                                   consumer protection requirements
Copper in                          Copper pricing in non-fibre areas capped at 2019 levels + CPI
rural areas                             (Dec 2019: line only $31.68; broadband $42.35)
                                                                                                                              Extends to UFB2
Unbundling                          Unbundled fibre available in UFB1 areas on commercial basis
                                                                                                                                   areas

   38   24 February 2020                                H1 FY20 RESULT PRESENTATION
Optimise
 non-fibre
  assets
                        Evaluating our future
                        network needs

      > robust criteria for capital prioritisation, reflecting
          network horizons and competitive features
          across zones (i.e. UFB, LFC, or Rural)
      >   review our ongoing property portfolio
          requirements
      >   maximise revenue opportunities from existing
          infrastructure assets (e.g. towers, poles)
      >   continue promoting uptake of our VDSL
          vectoring investment in rural and LFC areas
      >   identify opportunities to work with Government
          on bridging digital divides

39   24 February 2020                      H1 FY20 RESULT PRESENTATION
Grow new
     revenues

                        Opportunities to leverage our network

                        ▪   2,000Mbps and 4,000Mbps plans for residential and
                            business in selected centres
                        ▪   symmetric speeds up and down; new ONT required

                        ▪   Wi-Fi 6 capable devices now available, enabling
                            enhanced speeds and capacity for more devices
                        ▪   Wi-Fi to dominate indoor connectivity given cost,
                            performance and device availability

                        ▪   initial Mt Eden space filled; considering more sites
                        ▪   early CDN use case evolving to edge computing
                        ▪   leveraging with other Chorus products (e.g. backhaul)

                            More to come…..

40   24 February 2020                    H1 FY20 RESULT PRESENTATION
Develop
 long term
  future of
     the
  business
                         Developing our people, capabilities and
                         operating model
                                                                                   Employee engagement
                                                                50
                                                                                                                                             8.4
                                                                45

                                                                40                                                                           8.2

> Organisational change as we move from build to operate        35
                                                                                                                                             8
  ▪ Customer Network Operations                                 30
                                                                                                                                             7.8
  ▪ ongoing shift from legacy to digital platforms              25

> Develop asset management capability for new regulatory        20                                                                           7.6

     model                                                      15
                                                                                                                                             7.4

>    Align supplier partnerships with network needs
                                                                10
                                                                                                                                             7.2
                                                                 5

                                                                 0                                                                           7
                                                                         May             August             November        February

                                                                       Net Promoter Score (lefthand axis)      Engagement (righthand axis)

41    24 February 2020                   H1 FY20 RESULT PRESENTATION
Any questions?

42   24 February 2020   H1 FY20 RESULT PRESENTATION
Appendix A: Connection and market trends
                             31 Dec   31 March     30 June     30 Sept      31 Dec
                              2018        2019       2019        2019        2019
                                                                                      1400000    Baseband copper

Unbundled copper             39,000     31,000      24,000      21,000      18,000               Unbundled copper
(no broadband)                                                                        1200000

Baseband copper             244,000    233,000     214,000     201,000     192,000
(no broadband)                                                                                   Copper ADSL
                                                                                      1000000
Copper ADSL                 374,000    352,000     327,000     304,000     283,000
(includes naked)
                                                                                      800000
VDSL                        295,000    283,000     270,000     257,000     242,000
(includes naked)                                                                                  VDSL
                                                                                      600000
Fibre broadband             517,000    556,000     599,000     645,000     681,000
(GPON)

Data services                 5,000      5,000       5,000       4,000       4,000    400000
(copper)                                                                                          Fibre (GPON)

Fibre premium                12,000     12,000      11,000      12,000      12,000    200000
(P2P)

Total connections         1,486,000   1,472,000   1,450,000   1,444,000   1,432,000
                                                                                            0     Business premium
                                                                                          31-Dec-18       31-Mar-19   30-Jun-19   30-Sep-19   31-Dec-19
        > 1,206,000 broadband connections comprises:
          ▪ 681,000 fibre (GPON) connections
          ▪ 525,000 VDSL/ADSL (copper) connections

           43      24 February 2020                           H1 FY20 RESULT PRESENTATION
Appendix A: Connection and market trends (continued)

           Broadband uptake by retailer (all technology)                                                                                                                                                                                                                                                                           NZ broadband market – by technology
2,000,000                                                                                                                                                                                                                                                                                2,000,000

1,800,000                                                                                                                                                                                                                                                                                1,800,000

1,600,000                                                                                                                                                                                                                                                                                1,600,000

1,400,000                                                                                                                                                                                                                                                                                1,400,000

1,200,000                                                                                                                                                                                                                                                                                1,200,000

1,000,000                                                                                                                                                                                                                                                                                1,000,000

 800,000                                                                                                                                                                                                                                                                                  800,000

 600,000                                                                                                                                                                                                                                                                                  600,000

 400,000                                                                                                                                                                                                                                                                                  400,000

 200,000                                                                                                                                                                                                                                                                                  200,000

       -                                                                                                                                                                                                                                                                                       -
                                                    Q1 2014

                                                                                                                                                                  Q4 2016
            Q1 2013
                      Q2 2013
                                Q3 2013
                                          Q4 2013

                                                              Q2 2014
                                                                        Q3 2014
                                                                                  Q4 2014
                                                                                            Q1 2015
                                                                                                      Q2 2015
                                                                                                                Q3 2015
                                                                                                                          Q4 2015
                                                                                                                                    Q1 2016
                                                                                                                                              Q2 2016
                                                                                                                                                        Q3 2016

                                                                                                                                                                            Q1 2017
                                                                                                                                                                                      Q2 2017
                                                                                                                                                                                                Q3 2017
                                                                                                                                                                                                          Q4 2017
                                                                                                                                                                                                                    Q1 2018
                                                                                                                                                                                                                              Q2 2018
                                                                                                                                                                                                                                        Q3 2018

                                                                                                                                                                                                                                                           Q1 2019
                                                                                                                                                                                                                                                                     Q2 2019
                                                                                                                                                                                                                                                                               Q3 2019
                                                                                                                                                                                                                                                  Q42018

                                                                                                                                                                                                                                                                                                                                                                                                                                                                                                                                                     Q1 2019
                                                                                                                                                                                                                                                                                                     Q1 2013
                                                                                                                                                                                                                                                                                                               Q2 2013
                                                                                                                                                                                                                                                                                                                         Q3 2013
                                                                                                                                                                                                                                                                                                                                   Q4 2013
                                                                                                                                                                                                                                                                                                                                             Q1 2014
                                                                                                                                                                                                                                                                                                                                                       Q2 2014
                                                                                                                                                                                                                                                                                                                                                                 Q3 2014
                                                                                                                                                                                                                                                                                                                                                                           Q4 2014
                                                                                                                                                                                                                                                                                                                                                                                     Q1 2015
                                                                                                                                                                                                                                                                                                                                                                                               Q2 2015
                                                                                                                                                                                                                                                                                                                                                                                                         Q3 2015
                                                                                                                                                                                                                                                                                                                                                                                                                   Q4 2015
                                                                                                                                                                                                                                                                                                                                                                                                                             Q1 2016
                                                                                                                                                                                                                                                                                                                                                                                                                                       Q2 2016
                                                                                                                                                                                                                                                                                                                                                                                                                                                 Q3 2016
                                                                                                                                                                                                                                                                                                                                                                                                                                                           Q4 2016
                                                                                                                                                                                                                                                                                                                                                                                                                                                                     Q1 2017
                                                                                                                                                                                                                                                                                                                                                                                                                                                                               Q2 2017
                                                                                                                                                                                                                                                                                                                                                                                                                                                                                         Q3 2017
                                                                                                                                                                                                                                                                                                                                                                                                                                                                                                   Q4 2017
                                                                                                                                                                                                                                                                                                                                                                                                                                                                                                             Q1 2018
                                                                                                                                                                                                                                                                                                                                                                                                                                                                                                                       Q2 2018
                                                                                                                                                                                                                                                                                                                                                                                                                                                                                                                                 Q3 2018
                                                                                                                                                                                                                                                                                                                                                                                                                                                                                                                                           Q4 2018

                                                                                                                                                                                                                                                                                                                                                                                                                                                                                                                                                               Q2 2019
                                                                                                                                                                                                                                                                                                                                                                                                                                                                                                                                                                         Q3 2019
                                                                                                                                                                                                                                                                                            Chorus xDSL                                                                              Chorus mass market fibre                                                                            Chorus premium fibre
           Spark                    Vodafone                                      Orcon                         Vocus                          2degrees                                   Trustpower                                         ROM
                                                                                                                                                                                                                                                                                            Local fibre companies (UFB)                                                              Other fibre networks                                                                                Other xDSL
                                                                                                                                                                                                                                                                                            Vodafone cable                                                                           Fixed (mobile) wireless                                                                             Legacy fixed wireless, satellite
                                                                                                                  Source: IDC                                                                                                                                                                                                                                                                                                Source: IDC

      44          24 February 2020                                                                                                                                                                                  H1 FY20 RESULT PRESENTATION
Appendix A: Connection and market trends (continued)

                   70.00%
                                 UFB1 uptake
                                        Dec-18   Mar-19   Jun-19   Sep-19   Dec-19

                   60.00%

                   50.00%

% uptake
relative to        40.00%
capable
addresses
                   30.00%

                   20.00%

                   10.00%

                    0.00%

     45       24 February 2020     H1 FY20 RESULT PRESENTATION
You can also read