Introduction to teaching science with three-dimensional images of dinosaur footprints from Cristo Rey, New Mexico
←
→
Page content transcription
If your browser does not render page correctly, please read the page content below
Research article
Geosci. Commun., 5, 1–9, 2022
https://doi.org/10.5194/gc-5-1-2022
© Author(s) 2022. This work is distributed under
the Creative Commons Attribution 4.0 License.

Introduction to teaching science with three-dimensional images
of dinosaur footprints from Cristo Rey, New Mexico
Valeria V. Martinez and Laura F. Serpa
Department of Earth, Environmental, and Resource Sciences, University of Texas at El Paso,
500 W. University Ave., El Paso, Texas 79968 USA

Correspondence: Valeria V. Martinez (vvguerrero@miners.utep.edu)

Received: 26 May 2021 – Discussion started: 11 June 2021
Revised: 26 September 2021 – Accepted: 4 October 2021 – Published: 4 January 2022

Abstract. In this paper we discuss the use of three-               1   Introduction
dimensional (3-D) imagery and virtual field trips to teach
pre-university and non-major university geoscience courses.        The current pandemic has changed education in many ways,
In particular, 3-D PDF (Portable Document Format) files can        but few areas of science education have been impacted as
be used to either prepare students for or completely replace       much as the geological sciences where field observations and
a field trip when logistical problems make the actual trip too     trips are a significant part of most geoscience curricula. Dur-
difficult to be effective or when some students need an al-        ing the pandemic, many universities replaced field trips and
ternative accommodation. Three-dimensional images can re-          exercises with a variety of virtual field experiences (Rotzien
place or supplement classroom activities, such as the iden-        et al., 2021) despite some prior faculty reticence to the use
tification of rocks and minerals from hand samples or the          of computer-based tools for field mapping classes and other
identification of geologic structures from 2-D photographs         field activities. In addition, prior to the pandemic there was a
and limited field observations. Students can also become in-       growing trend at many universities and schools in the USA to
volved in data collection and processing to further their un-      eliminate or restrict field activities because of administrative
derstanding of photogrammetry and visualization. The use of        concerns about student liability, cost, and, in some cases, the
3-D imagery can make additional time available to instruc-         lack of faculty able and/or willing to teach field-based classes
tors to cover more advanced topics and teach students more         on a regular basis. It is our opinion that the pandemic will be
about the role of science in geologic research.                    a major factor in a permanent decrease in the number of field-
    We use an example from Cristo Rey, New Mexico, where           based geology activities in US universities. Furthermore, we
dinosaur footprints and tracks are present but difficult to see    expect that field observational geology will become virtual
in many cases, and they are often in places that are hard to ac-   for nearly all pre- or early-college students who are not ma-
cess for many people. At this site, approximately 10 000 pho-      joring in a geoscience.
tographs were collected and processed as 3-D images to show           One critical question regarding the changing emphasis on
one approximately 72 m2 area of known footprints. How-             field experiences (Whitmeyer et al., 2020) in geoscience edu-
ever, we also conducted some very simple digital manipula-         cation is whether field-based activities are truly essential and
tions of the images that allowed us to identify new footprints     where might they be most valuable. The authors of this paper
and tracks that were not apparent when viewed in the field.        are experienced geoscientists with considerable field expe-
The photographs and 3-D images have been donated to the            rience, but we contend that there are some significant ben-
Insights El Paso Science Center (denoted Insights Museum           efits to the use of technology in geoscience education. We
herein) that owns the fossil site, and they are now being used     argue that non-majors at universities and students in the pre-
to develop educational materials and lessons for the nearby        university system may learn more from virtual field activities
communities.                                                       than they might learn from actual field-based observations. In
                                                                   particular, we see that the use of three- and four-dimensional
                                                                   photogrammetry models and videos, as well as many other

Published by Copernicus Publications on behalf of the European Geosciences Union.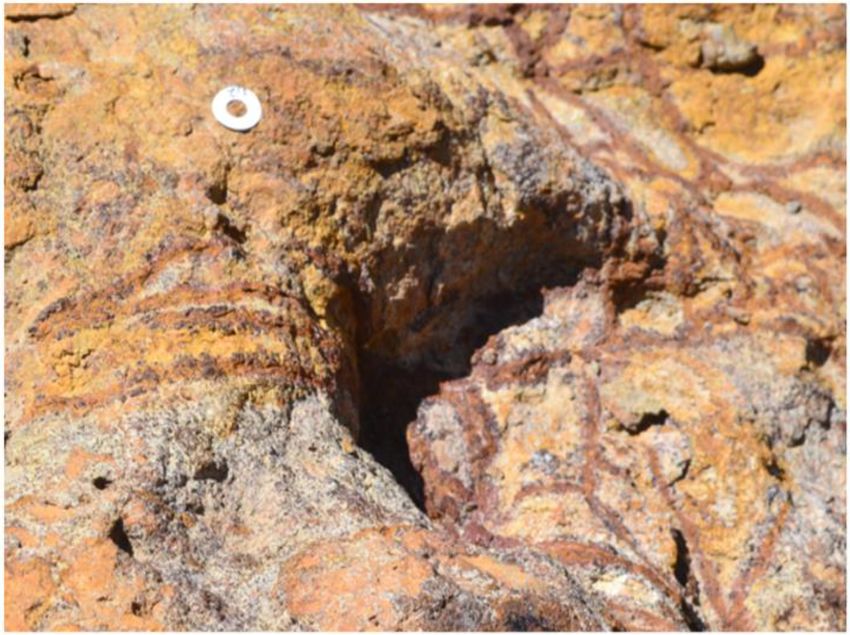
2                   V. V. Martinez and L. F. Serpa: Teaching science with three-dimensional images of dinosaur footprints

developing technologies like artificial intelligence and large-    and manipulated by students with minimal expense or exper-
scale statistical methods (Whitmeyer et al., 2019), has an ed-     tise. Our intent is to use this approach to increase interest in
ucational advantage over field work, because these methods         the study of geology amongst these groups of students, so we
of delivery are more relevant to many students. In addition,       can increase the rigor of our courses over time. Initially the
the incorporation of virtual activities and lessons in a modern    fossil identification activities will follow traditional lessons
textbook should provide more time for discussions of what          plans that include the identification of dinosaurs based on
geoscience researchers actually do and why that is important       their footprints, estimating the size and speed of a dinosaur
science. To test this concept, we are working with a local         based on the measured stride (Thulborn, 1990), and looking
museum to develop educational materials on dinosaur foot-          at dinosaur activities in relationship to their environmental
prints, and that effort is described below.                        setting (Lockley, 2011, 1986). We anticipate that the Insights
                                                                   Museum will expand on our preliminary work, but we will
1.1   Study area
                                                                   work closely with them to develop some initial lessons based
                                                                   on our own experience of discovery at the site.
Cristo Rey, New Mexico (Fig. 1), is the site of numerous
Cretaceous dinosaur footprints and trackways that are par-         1.2   Geologic background
ticularly difficult to recognize and map (Kappus and Cornell,
2003; Kappus et al., 2011). Weathering patterns obscure or         The first fossil footprints, identified as Cretaceous theropod
mimic many of the fossils and the locality experienced Ter-        footprints, were discovered by Kappus and Cornell (2003).
tiary uplift and tilting that deformed the site and made the       The footprints are in Cretaceous sedimentary deposits that
terrain difficult to navigate. The fossil site is located adja-    were intruded by a Tertiary trachyandesite dome (Lovejoy,
cent to the US–Mexico border near the cities of Las Cruces,        1976). The dinosaur tracks are located primarily in the up-
NM, and El Paso, TX, and this makes it a potentially valu-         per sandstone of the Anapra formation, which is a massive
able local education resource. The donation of the land to         cross-bedded arkosic sandstone varying in thickness from 1–
the Insights Museum in 2011 opened the site to educational         2 m and interbedded with grey and purple shale (Lovejoy,
groups and the development of exhibits, but that work is still     1976). These sedimentary layers indicate that the Cretaceous
in early development. In an effort to preserve as much infor-      environment in this area was a shallow sea (Kappus et al.,
mation as possible on the dinosaur footprints and to provide       2011).
students and teachers with a non-invasive way to study the
fossils, Martinez (2016) created a detailed high-resolution        1.3   Methods
photographic record of a portion of the site and used that data
to build 3-D images of the ground surface. Those images not        Most of the initial research on the Cristo Rey tracks con-
only provide a record of the site but also led to the identifi-    sisted of field notes, photos, and drawings (Kappus and Cor-
cation of several new footprints and fossils based on digital      nell, 2003; Kappus et al., 2011). More recently, technology
manipulation of the images.                                        has become available to create 3-D visualizations of geologic
   The use of 3-D models to study fossils is a relatively recent   units (Carrivick et al., 2016), and this is changing the way
technique (Djuricic et al., 2016; Bates et al., 2008; Adams et     fossils are studied (Remondino et al., 2010). Eric Kappus,
al., 2010; Remondino et al., 2010; Tavani et al., 2014) that       Jose Hurtado, and Raed AlDouri (personal communication,
has advantages over methods such as paper mapping, plaster         2016) used lidar to record the Cristo Rey footprints to pro-
casts or collecting samples as it is non-destructive and can be    duce the first 3-D images of the site. The resulting anaglyph
easily shared with a wide audience. Our preliminary study of       3-D images require anaglyph glasses to see and cannot be
the images we collected (Martinez, 2016) shows numerous            easily manipulated on a computer, but they provide the in-
Cretaceous Theropoda, Iguanodon, and Ankylosaurus foot-            spiration for continued work in this area.
prints (Fig. 2) previously identified by Kappus et al. (2010)
and Kappus and Cornell (2003) as well as new footprints            1.4   Data collection
and trails of those dinosaurs that were not previously rec-
ognized. These images were donated to the Insights Museum          The original goal of this project was to create a digital record
and we are helping to develop educational resources for the        that could be used in educational programs and research that
local community to encourage studies of the fossils.               did not require field visits in all cases. The materials needed
   Our educational activities focus on both methodology and        for this project can be easily obtained and used with teachers
fossil identification for several age groups. In the USA, ge-      and their students (Fleming and Pavlis, 2018). However, we
ology is often taught in middle schools for 11- to 13-year-        did use materials in this project that may not be readily avail-
old students. It is also a popular choice for university stu-      able to most teachers. For example, we used a Nikon camera
dents who do not want to use mathematics but are required          series D3100 digital single-lens reflex (DSLR) camera for
to take at least one science course. We are focusing on the        our photography and Agisoft Photoscan Pro™ and ENVI™
use of 3-D images that can be easily used in the classroom         software for processing and data analysis, which may not be

Geosci. Commun., 5, 1–9, 2022                                                              https://doi.org/10.5194/gc-5-1-2022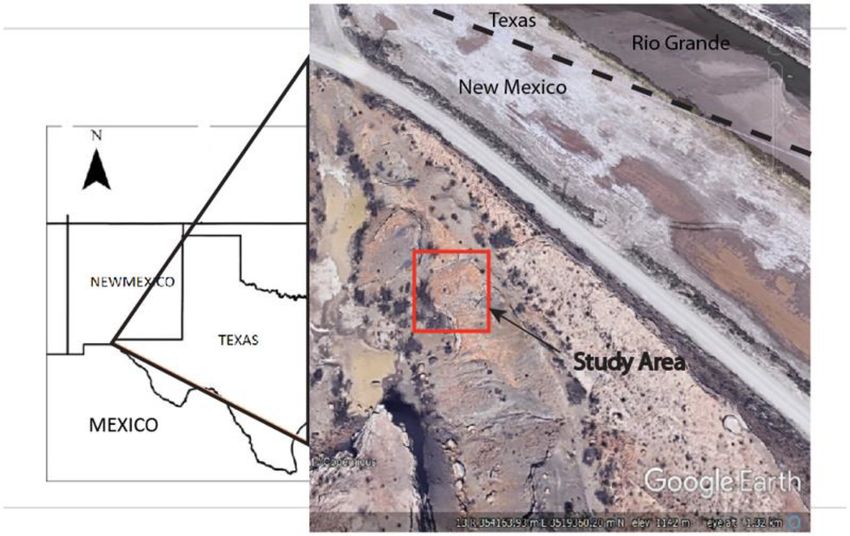
V. V. Martinez and L. F. Serpa: Teaching science with three-dimensional images of dinosaur footprints 3
Figure 1. Map of the region modified from ©Google Earth (2021). The red box in the image shows the study area in Cristo Rey, New
Mexico.
nate number (Fig. 5). The lead author, Martinez, developed
the grid system, supervised the grid measuring process, and
took all the photographs. At each grid intersection, a suite of
photographs was taken at a distance of ∼ 1 m from the sur-
face with the camera directed into the adjacent grid areas.
This was done at each grid position until all four corners had
been occupied for photography. The total number of pictures
taken at each grid position depended on the surface texture
and variations in the surface of the target. For example, if
there were a lot of variations in the target surface, then more
pictures were taken in order to capture sufficient details for
subsequent modeling.
Figure 2. The general shapes of the three types of Cretaceous di-
nosaur footprints identified (Kappus and Cornell, 2003; Kappus et
1.5 Data processing
al., 2011; Martinez, 2016) at Cristo Rey. Panel (a) is an ankylosaur,
panel (b) is an iguanodon, and panel (c) is a theropod (outlines mod- The images were processed using the structure from motion
ified from Kappus et al., 2011).
(SfM) photogrammetry technique (Westoby et al., 2012).
The photogrammetric processing was done using Agisoft
Photoscan Pro™ software to create a 3-D model from the
affordable for most teachers. However, a cell phone camera photos. Each set of photos for a single grid section was pro-
and several inexpensive and free software packages can be cessed individually to form a 1 m × 1 m “chunk” (Agisoft,
used if the data set is kept small (Fleming and Pavlis, 2018). 2021), because the data set was too large to process the en-
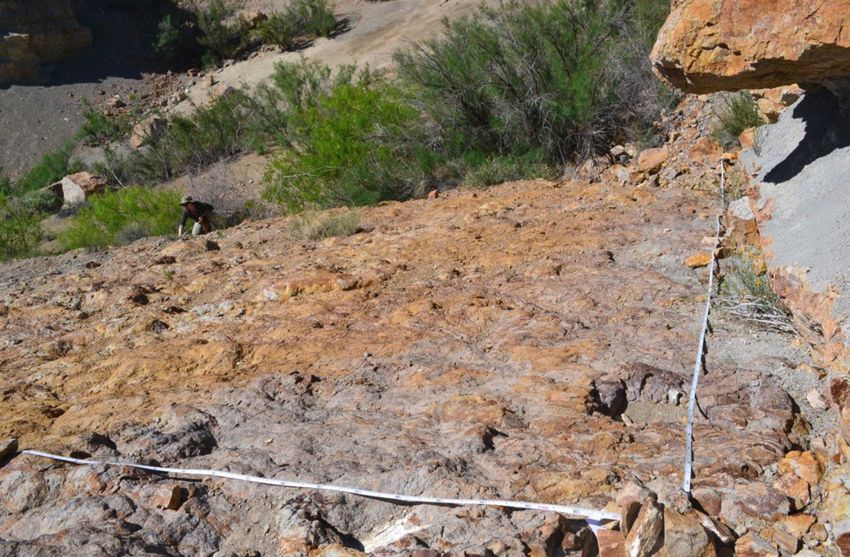
We collected approximately 10 000 photographs and re- tire set as a single unit. Once all the chunks were created,
duced the number to 7600 photographs using a grid system they were arranged to form larger chunks, starting with grid
that was approximately 9 m across in the x direction and 8 m positions (0,0) and (0,1). In this fashion, the chunks were it-
across in the y direction (Fig. 3). Four people were needed for eratively aligned and merged to make progressively bigger
the data collection with one located at position (0,0) to estab- chunks.
lish the origin position, one person measuring the x coordi- In 2015–2016 we were limited by available computing
nates with a measuring tape, another measuring the y coordi- power and did not have sufficient RAM and CPU power to
nates with a second measuring tape (Fig. 4), and one using a create a single model for the entire outcrop. For that rea-
meterstick to precisely mark grid points on the outcrop using son, we chose to work on a subset of our data in an area
temporary adhesive stickers labeled with the point’s coordi- where Kappus et al. (2011) found the most dinosaur foot-
https://doi.org/10.5194/gc-5-1-2022 Geosci. Commun., 5, 1–9, 2022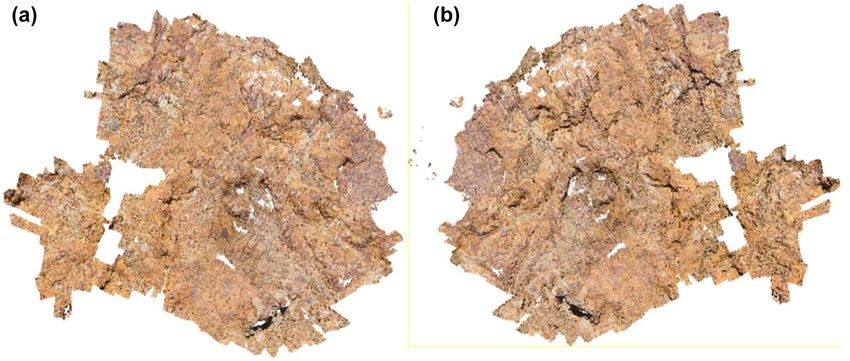
4                     V. V. Martinez and L. F. Serpa: Teaching science with three-dimensional images of dinosaur footprints

                                                                       Figure 5. This photo shows the circular mark used to indicate the
                                                                       intersection of two 1 m spaced grid lines in the survey area.
Figure 3. Grid layout used to take photographs. The grid spacing
is 1 m, and photos were taken from each grid intersection with a
camera aimed into the target grid space. The shaded area shows the
area we processed for this study, and the heavy dashed line outlines   pographic relief in the region (James et al., 2017). We also
the map area from Kappus et al. (2011).                                did not have position information for the individual photos,
                                                                       so it was not possible to georeference the data (Brush et al.,
                                                                       2019). This was our first effort to collect photogrammetry
                                                                       data, and we recognize our mistakes. We subsequently col-
                                                                       lected small unmanned aerial vehicle (sUAV, i.e., drone) and
                                                                       lidar data which we will compare to our hand-held photogra-
                                                                       phy in the near future. Despite the problems with the initial
                                                                       work, we have high-quality photos of the entire fossil site and
                                                                       can produce 3-D images of the individual gridded sections
                                                                       independently or in small groups. This provides us with an
                                                                       excellent educational data set that students and teachers can
                                                                       access freely and learn more about fossils and photogramme-
                                                                       try techniques.

                                                                       2   Education applications

Figure 4. The grid system used in this study was based on two met-     As noted above, our photos were not georeferenced and
ric tape measures laid out perpendicular to each other to establish    lacked sufficient overlap to produce a continuous 3-D model
the locations for photographs. The positions of the individual grid    of the area. When we collected the data in 2015, we had
intersections at 1 m spacing were marked as shown in Fig. 5.           no previous experience with photogrammetry and only knew
                                                                       that a lot of photos from a range of orientations were needed
                                                                       to produce a model. This experience is one of several early
prints (Fig. 3). In early 2021 we used Pix4D™ software to              efforts (Brush et al., 2019; Pavlis and Mason, 2017; Fleming
reprocess some of the data for this paper and have had some            and Pavlis, 2018) among a group of faculty and students in
success, but we have not yet been able to produce a single             our department to explore photogrammetry as a potential tool
model of the entire area. There is insufficient overlap of pho-        for geoscience research and education. We have subsequently
tos between some of the grid areas to use the SfM software to          learned a great deal more about photogrammetry, and we rec-
completely merge all of the images into a single model (Wen-           ognize the need to pre-plan a project with careful considera-
zel et al., 2013). The method we used to collect data focused          tion of goals and methodology (Brush et al., 2019; James et
on coverage within each grid area but not on the connectivity          al., 2017; Carrivick et al., 2016; Bemis et al., 2014; Wenzel
between grid areas.                                                    et al., 2013).
   Besides the problems with the lack of overlap between                  The photographs described in this paper make up our ini-
grid sections in many of our photos, the camera was also               tial donation to the Insights Museum to provide a permanent
too close to the surface to accurately capture all of the to-          record of the fossil site. In addition, we will provide 3-D im-

Geosci. Commun., 5, 1–9, 2022                                                                    https://doi.org/10.5194/gc-5-1-2022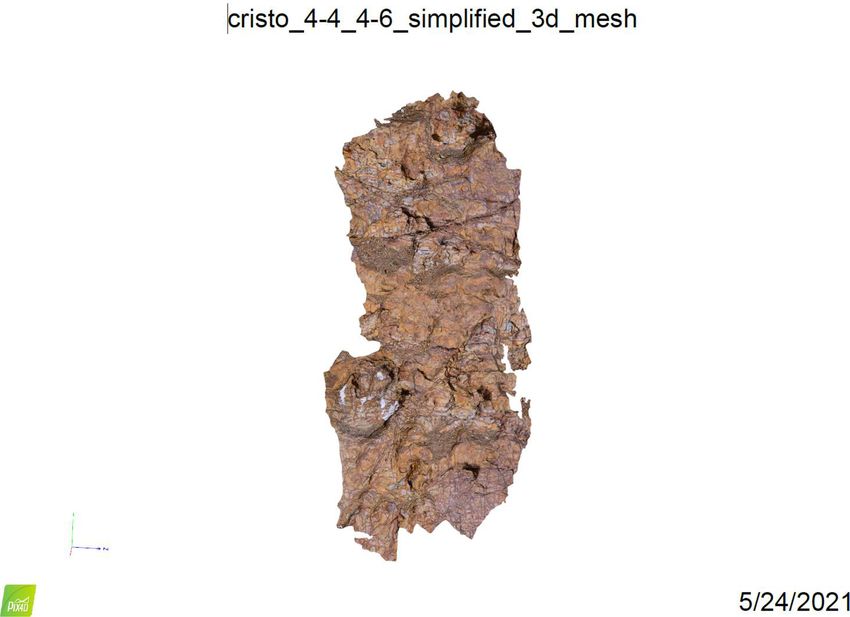
V. V. Martinez and L. F. Serpa: Teaching science with three-dimensional images of dinosaur footprints                             5

ages made with the SfM software (cloud data) that can be           the orientation and tilt of the 3-D image to bring out varying
distributed in a variety of formats. The basic format for the      views of the depth and highlight the mud ridges around the
cloud data as seen in Figs. 6 and 7 is LAS (LASer), a for-         footprint. The image on the left side of Fig. 6 shows a view
mat commonly used for lidar point cloud data, which can be         of what would be seen in the field if the lighting were good.
manipulated using software like Cloud Compare™, which is           However, because the students will have a 3-D image (Fig. 8)
freeware and has the ability to make depth measurements and        to look at, they will be able to manipulate it with a computer,
comparisons with other data sources and many other rele-           tablet, or smart phone in ways that are not available to the
vant applications. In addition, we can post images on the web      field observer. One of the first things we did with the images
and produce 3-D PDF files (see the Supplement) that can be         when we started this project was to turn the 3-D PDF image
opened using software from Adobe™ on most standard lap-            over and look at the back side where footprints that are de-
top computers and tablets. For this project, we are focusing       pressed in the top side pop out as raised impressions on the
on the 3-D PDF images, because most schools and univer-            back side of the image as shown on the right side of Fig. 6.
sities have access to these files and the Adobe Acrobat soft-         The footprints may be difficult for students to find initially
ware necessary to interact with them. In many US schools,          because there is a lot of color variations in the rocks. How-
students are not allowed to access some websites, and in par-      ever, we can change the colors in the computer image also;
ticular, Sketchfab is usually not considered appropriate for       Fig. 7. shows the same images as shown in Fig. 6 but the true
pre-college-age students although it is an excellent site for      colors are replaced by two tone color variations that change
posting 3-D images. Adobe Acrobat has several options for          intensity with depth. In this format, the most visible footprint
manipulating the 3-D PDF files to help students recognize          is easily seen as a depressed area that is darker brown than
fossils and they can be accessed without a direct connection       the surrounding, yellow high areas in the right-hand image
to the internet.                                                   and as a light area in the backside of the image where we
   The original fossils identified by Martinez (2016) were         used grey tones. Students can experiment with their image
from a small set of photos where she removed the color from        colors, orientation or scale to find a representation that helps
a 3-D PDF image and found that the weathering patterns in          them to visualize the footprints and learn something about
the rocks obscured the footprints and distracted from recog-       how visualization works in the process.
nition of the fossil relief. This was first observed by simply        Once students learn to find the footprints in the image,
turning the 3-D PDF over and looking at the back side which        they can compare them to published information (Thulborn,
had no color at that time and showed the footprint as a high       1990) to identify the dinosaurs that made the prints. Students
area rising above the background rock. Subsequent mapping          can also measure the prints and if there are sufficient prints,
of depth variations at a small scale combined with color re-       they can measure the stride of the dinosaurs to make an es-
moval made more footprints and tracks apparent in the site         timate of the sizes of the dinosaurs. Some additional lessons
as shown in Figs. 6 and 7.                                         that can be included might be to look at how mud was ap-
                                                                   parently pushed away from the footprint and compare that
2.1   Fossil identification
                                                                   to how a human footprint changes when a person runs com-
                                                                   pared to a walking person’s footprint in mud. In some cases,
Our experience suggests that most students first learn about       students might consider how a footprint would look if the
fossils by seeing a few examples, usually photographs in a         dinosaur were pushing along in shallow mud while swim-
textbook, and learning to recognize some basic characteris-        ming. This would provide additional information about the
tics of a fossil that can be used to identify the source. For      environment and lifestyle of the dinosaurs (Boggs, 2011).
students living near a fossil locality, this may also involve         This data can also give teachers a chance to develop their
a field trip to collect fossils. However, some fossil localities   students’ critical thinking skills. Cristo Rey is located in a
are rapidly disappearing as the fossils have all been collected.   desert region, but the dinosaurs clearly lived in a shallow
Cristo Rey fossils have been heavily collected and most re-        water environment in our area which could open a discus-
maining fossils are in hard to access areas that may not be        sion on climate change (Dalla Vecchia, 2008), for example.
safe to visit for young people with little or no field expe-       Comparing how the students might displace mud in a wet
rience. We also hope that the remaining fossils will not be        environment and observing similar features in the dinosaur
collected so that scientific studies of the footprints can be      footprints could create a better understanding of how sci-
conducted well into the future.                                    ence works and builds understanding of the processes we
   Figures 6 and 7 show images from a part of the area that        study. The mud ridges around the footprints also provide evi-
includes two footprints and are photographs of the actual 3-       dence the dinosaurs were walking on a sloping surface which
D dense cloud models. A 3-D PDF of that area is included           was subsequently tilted in the opposite direction during uplift
in the Supplement, and a 2-D image of the figure is shown          of the area. In addition, some footprints overlap other foot-
in Fig. 8. The supplemental 3-D PDF file should be manipu-         prints which opens discussions of the time relationships and
latable with Adobe Acrobat Pro™ with 3-D enabled but may           whether one of the types of dinosaurs found in our area could
take a few minutes to open. Readers and students can change        have lived there at a much earlier time than another. These

https://doi.org/10.5194/gc-5-1-2022                                                            Geosci. Commun., 5, 1–9, 2022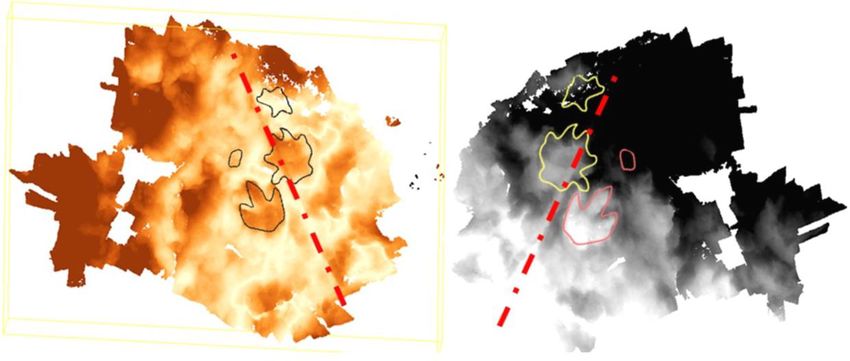
6                     V. V. Martinez and L. F. Serpa: Teaching science with three-dimensional images of dinosaur footprints

Figure 6. Front and back view of Cristo Rey 3-D PDF image from grid sections (3, 4) to (3, 5) and (4, 4) to (4, 6). Each image occupies an
area of approximately 2 m by 2 m. Panel (a) shows what a field observer would see in the fossil locality, and panel (b) shows the same image
as panel (a) but reversed to show the back side of the fossil image which a field observer would not see.

Figure 7. The same images shown in Fig. 6 but the natural color of the images has been replaced by colors that vary with depth. The dashed
red line shows the location of a fracture in the rocks, and the footprints are outlined in this image.

                                                                            observations would make an excellent exercise for the stu-
                                                                            dents to explore with the entire data set.

                                                                            2.2   Photogrammetry

                                                                            In addition to learning about fossils, students can learn more
                                                                            about the process of visualization and making 3-D images
                                                                            from the more than 7000 photos available from the Insights
                                                                            Museum. There are inexpensive or free software packages
                                                                            available to work with smartphone images to build 3-D mod-
                                                                            els (Fleming and Pavlis, 2018). This gives students an excel-
                                                                            lent opportunity to learn more about how humans perceive
                                                                            depth and dimensionality, for example. Where more sophis-
                                                                            ticated software is available, students can work on building
                                                                            a geologically accurate representation of the Cristo Rey fos-
                                                                            sil sites. This should also give students a good understanding
                                                                            and the necessary skills to look at rocks and minerals, for ex-
Figure 8. This figure is a 2-D image of the 3-D PDF of Cristo Rey           ample, or any number of subjects in 3-D which is likely to be
sections 4–5 and 4–6 included in the Supplement to this paper.              common in their future regardless of the career they choose.
                                                                               The methods used in this project are not intended for rigor-
                                                                            ous research projects where accurate measurements are crit-

Geosci. Commun., 5, 1–9, 2022                                                                            https://doi.org/10.5194/gc-5-1-2022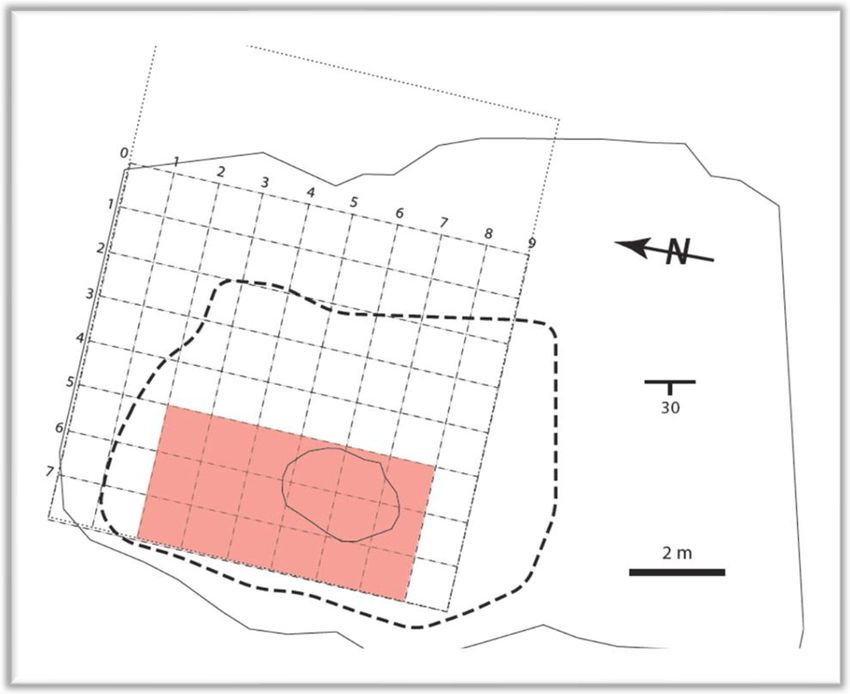
V. V. Martinez and L. F. Serpa: Teaching science with three-dimensional images of dinosaur footprints                               7

ical. Rather, we are focusing on the visualization aspect of       ing sophisticated equipment in greater detail than is possible
photogrammetry and making it easily accessible to teachers         with a 2-D image. We also have the flexibility of linking spe-
and students in a wide range of applications. For more ad-         cific images and lessons from Microsoft Word documents to
vanced courses and research applications, it will be critical      PowerPoint lessons to aid students in viewing the lesson dig-
to train students in the details of properly planning a project    itally.
(James et al., 2017; Wenzel et al., 2013; Brush et al., 2019;         The use of 3-D PDF files in a classroom or textbook is just
Fleming and Pavlis, 2018) to ensure they get the intended in-      the first of many possible uses of digital data and software
formation from their photos. We also hope that properly col-       to give students a sample of the tools that many researchers
lected research data will become available for education ap-       use regularly. The tools that we used to generate the 3-D PDF
plications. However, more casual application of photogram-         files from the photographs can easily be accessed and manip-
metry in educational settings is an effective method to build      ulated on a smartphone or tablet. The same methods can be
interest in a topic and, more importantly, to expand the level     applied to rocks and minerals, outcrops, and large-scale ge-
of information available in a classroom or textbook from 2-D       ologic features. Rotzien et al. (2021) used 3-D Google Earth
images to 3- and even 4-D images.                                  images to prepare students for field mapping. Google Earth
                                                                   is often used in labs and introductory classes and textbooks
                                                                   so this is not a new idea. However, Google Earth is not usu-
3   Conclusions                                                    ally of high enough resolution to see the detailed outcrop im-
                                                                   ages or identify rock types or fossils. It cannot be manipu-
At many US universities, introductory geology is taught us-        lated with other software, so it is not the ideal tool for the
ing a small set of rock and mineral samples in a lab often         lessons we think students should have. We believe the pri-
combined with field excursions that may be taught by grad-         mary outcome of using higher-level technology in introduc-
uate students with little training in the broad range of topics    tory classes is that students will see geoscience more as a
covered in the lab. Introductory physical geology textbooks        rigorous science than as something that should be left to pre-
and lab manuals typically devote 4 to 5 chapters to rock and       university level courses with teachers who may not see the
mineral identification and a chapter on, for example, struc-       subject as a “real” or quantitative science.
tural geology that uses photographs or sketches where a stu-          We would like to see a change in how introductory uni-
dent is expected to memorize the names of the features in          versity geoscience is taught with more emphasis on under-
the image. One reason for this is that geoscience is often         standing the nature and process of science and its applica-
not taught at the high school level (ages 14 to 18 typically)      tions through the use of a broad range of high-resolution dig-
and there are relatively few geoscience majors entering the        ital imagery. Exercises could involve looking at a variety of
universities as freshmen. As a result, departments try to re-      characteristics from one area or seeing the same geologic fea-
cruit majors from the students who choose to take a geol-          ture in different places and varying stages of development,
ogy course to meet a science elective or because their major       for example. Every university could develop virtual field trip
requires it. Those students are often not well prepared for        activities using digital data from their local area, so students
a more rigorous science course and departments may focus           can learn about why geology is relevant to their lives. Soft-
on making their course interesting, informative, and relevant      ware, such as StraboSpot (https://Strabospot.org, last access:
but usually not as difficult as, for example, an introductory      April 2018; Walker et al., 2019), is becoming more available
physics or chemistry course. We compare this to students           and could provide the tools for rewriting our non-majors’
taking an introductory university biology class that is based      textbooks, so students get a more realistic idea of how the
almost entirely on pictures, dissecting animals, and field trips   Earth works and what a geoscientist does. The possibilities
to collect plants and insects. Many students might enjoy such      for developing virtual class materials are growing rapidly,
a class, but it is not likely to inspire many of them to become    and we think now is the time to bring it into the classroom.
research scientists when this method is used at the university
level.
   We are not suggesting that field experiences or working         Code and data availability. The photographs and images used
in a lab with samples is not valuable, particularly in more        in this work are currently at the Insights Museum (http://www.
advanced classes, but many universities train teachers who         insightselpaso.org/, last access: 27 November 2021) but are not yet
only take one introductory geology class before they teach a       available at the time of this writing.
class in the pre-college system. As a result, few students learn
much about what makes geology a science or arrive at univer-
                                                                   Supplement. The supplement related to this article is available
sities with the intent of becoming a geologist. We believe the
                                                                   online at: https://doi.org/10.5194/gc-5-1-2022-supplement.
increasing availability of 3-D images that can show a wide
range of scales and include videos on a tablet or cell phone
frees up an instructor and textbook to explain the processes
behind the images and how a geologist studies the Earth us-

https://doi.org/10.5194/gc-5-1-2022                                                             Geosci. Commun., 5, 1–9, 2022
8 V. V. Martinez and L. F. Serpa: Teaching science with three-dimensional images of dinosaur footprints
Author contributions. The data were collected, processed, and terrain models from ground-based photography, Geosphere, 15,
analyzed by VVM for her master’s thesis under the supervision of 188–221, https://doi.org/10.1130/GES01691.1, 2019.
LFS. LFS subsequently reprocessed some of the data and assisted Carrivick, J., Smith, M., and Quincey, D.: Structure from Motion
in the preparation of this article. in the Geosciences, John Wiley and Sons, West Sussex, UK,
https://doi.org/10.1002/9781118895818, 2016.
Dalla Vecchia, F. M.: The impact of dinosaur palaeoichnology in
Competing interests. The contact author has declared that nei- palaeoenvironmental and palaeogeographic reconstrucions: The
ther they nor their co-author has any competing interests. case of the Periadriatic carbonate Platform, Oryctos, 8, 89–106,
2008.
Djuricic, A., Dorninger, P., Nothegger, C., Harzhauser, M., Szekely,
Disclaimer. Publisher’s note: Copernicus Publications remains B., Rasztovits, S., Mandic, O., Molnar, G., and Pfeifer, N.: High-
neutral with regard to jurisdictional claims in published maps and resolution 3D surface modeling of a fossil oyster reef, Geo-
institutional affiliations. sphere, 12, 1457–1477, https://doi.org/10.1130/GES01282.1,
2016.
Fleming, Z. and Pavlis, T.: An orientation based correction method
for SfM-MVS point clouds–Implications for field geology. J.
Special issue statement. This article is part of the special issue
Struct. Geol., 76–89, https://doi.org/10.1016/j.jsg.2018.05.014,
“Virtual geoscience education resources”. It is not associated with
2018.
a conference.
James, M., Robson, S., and Smith, M.: 3-D uncertainty-based
topographic change detection with structure-from-motion pho-
togrammetry: precision maps for ground control and directly
Acknowledgements. The authors greatly appreciate the assis- georeferenced surveys, Earth Surface Processes and Landforms,
tance of Eric Kappus in identifying the fossils recorded in the data. 42, 1769–1788, https://doi.org/10.1002/esp.4125, 2017.
The reviewers, Lisa White and an anonymous reviewer, provided Kappus, E. and Cornell, W. C.: A New Cretaceous Dinosaur Track-
valuable improvements to the text. We particularly thank the many site in Southern New Mexico, Palaentologia Electronica, 6, 6 pp.,
students and faculty at the University of Texas at El Paso who as- available at: https://palaeo-electronica.org/2003_1/track/issue1_
sisted in the data collection and early learning experiences working 03.htm (last access: 27 November 2021), 2003.
with photogrammetry. Kappus, E., Lucas, S., Hunt, A., Heckert, A., and Lock-
ley, M.: Dinosaur Footprints from the Lower Cretaceous
Sarten Member of the Mojado Formation at Cerro de Cristo
Review statement. This paper was edited by Simon Buckley and Rey, Dona Ana County, New Mexico, Ichnos, 10, 263–267,
reviewed by Lisa D. White and one anonymous referee. https://doi.org/10.1080/10420940390257905, 2010.
Kappus, E. J., Lucas, S. G., and Langford, R.: Cerro de Cristo Rey
Cretaceous Dionsar Tracksites, Sunlad Park, New Mexico, USA,
References and Chihuahua, Mexico, New Mexico Museum of Natural His-
tory and Science, 272–288, 2011.
Adams, T. L., Stranac, C., Polcyn, M. J., and Jacobs, L. L.: Lockley, M. G.: The Paleobiological and Paleoenviromental Impor-
High Resolution Three Dimensional Laser-scanning of the Type tance of Dinosaur Footprints, Soc. Sediment. Geol., 1, 37–47,
Specimen of EubronetsGlenrosenis Shuler, 1935, from the Co- https://doi.org/10.2307/3514457, 1986.
manchean (Lower Cretaceous) of Texas: Implications for Digi- Lockley, M. G.: Therapod- and Prosauropod-Dominated Ichnofau-
tal Archiving and Preservations, Palaentologia Electronica, 13, nas from the Navajo-Nugget Sandstone (Lower Jurassic) at Di-
1T, 11 pp., available at: http://palaeo-electronica.org/2010_3/ nosaur National Monument: Implications for Prosauropod Be-
226/index.html (last access: 27 November 2021), 2010. havior and Ecology, New Mexico Museum of Natural History
Agisoft: Agisoft PhotoScan User Manual: Professional Edi- and Science, 316–320, 2011.
tion, Version 1.2, available at: http://www.agisoft.com/pdf/ Lovejoy, E. M.: Geology of Cerro Rey Upflit, Chihuahua and New
photoscan-pro_1_2_en.pdf, last access: 27 November 2021. Mexico, New Mexico Institute of Mining & Technology, 92 pp.,
Bates, K. T., Manning, P. L., and Hodgetts, D.:Three-Dimensional 1976.
Modelling and Analysis of Dinosaur Tracks, Paleontology, 51, Martinez, V. V.: Reconstructing Dinosaur Foot Tracks and Identify-
999–1010, https://doi.org/10.1111/j.1475-4983.2008.00789.x, ing New Dinosaur Footprints using Structure from Motion Pho-
2008. togrammetry, MS Thesis, U. of Texas at El Paso, 2016.
Bemis, S., Micklethwaite, S., Turner, D., James, M., Akciz, S., Pavlis, T. and Mason, K.: The new world of 3D geologic mapping,
Thiele, S., and Bangash, H.: Ground-based and UAV-Based pho- GSA Today, 27, 4–10, https://doi.org/10.1130/GSATG313A.1,
togrammetry: A multi-scale, high-resolution mapping tool for 2017.
structural geology and paleoseismology, J. Struct. Geol., 69, Remondino, F., Rizzi, A., Girardi, S., Petti, F. M., and Avanzini, M.:
163–178, https://doi.org/10.1016/j.jsg.2014.10.007, 2014. Ichnology-Recovery Digital 3D Models of Dinosaru Footprints,
Boggs Jr., S.: Principles of Sedimentology and Stratigraphy, 5th The Photogrammetric Records, 25, 266–282, 2010.
Edn., Pearson, Upper Saddle River, New Jersey, USA, 2011. Rotzien, J. R., Sincavage, R., Pellowski, C., Gavillot, Y., Filkorn,
Brush, J., Pavlis, T., Hurtado, J., Mason, K., Knott, J., and Williams, H., Cooper, S., Shannon, J., Yildiz, U., Sawyer, F., and Uzun-
K.: Evaluation of field methods for 3-D mapping and 3-D visual- lar, N.: Field-Based Geoscience Education during the COVID-19
ization of complex metamorphic structure using multiview stereo
Geosci. Commun., 5, 1–9, 2022 https://doi.org/10.5194/gc-5-1-2022V. V. Martinez and L. F. Serpa: Teaching science with three-dimensional images of dinosaur footprints 9 Pandemic: Planning, Execution, Outcomes, and Forecasts, GSA Westoby, M. J., Brasington, J., Glasser, N. F., Hambrey, Today, 31, 4–10, https://doi.org/10.1130/GSATG483A.1, 2021. M. J., and Reynolds, J. M.: Structure-from-Motion Tavani, S., Granado, P., Corradetti, A., Girundo, M., Iannace, A., photogrammetry: A low-cost, effective tool for geosi- Arbues, P., Munoz, J. A., and Mazzoli, S.: Building a virtual out- cence applicaitons, Geomorphology, 179, 300–314, crop, extracting geological information from it, and sharing the https://doi.org/10.1016/j.geomorph.2012.08.021, 2012. results in Google Earth via OpenPlot and Photoscan: An example Whitmeyer, S., Pyle, E., Pavlis, T., Swanger, W., and from the Khaviz Anticline (Iran), Comput. Geosci., 63, 44–53, Roberts, L.: Modern approaches to field data collection https://doi.org/10.1016/j.cageo.2013.10.013, 2014. and mapping: Digital methods, crowdsourcing and the fu- Thulborn, T.: Dinosaur tracks, xvii Edn., Chapman & Hall, London, ture of statistical analyses, J. Struct. Geol., 125, 29–40, 1990. https://doi.org/10.1016/j.jsg.2018.06.023, 2019. Walker, J., Tikoff, B., Newman, J., Clark, R., Ash, J., Good, Whitmeyer, S., Atchison, C., and Collins, T.: Using mo- J., Bunse, E. G., Moller, A., Kahn, M., Williams, R. T., bile technologies to enhance accessibility and inclu- Michels, Z., Andrew, J. E., and Rufledt, C.: StraboSpot sion in field-based learning, GSA Today, 30, 4–10, data system for structural geology, Geosphere, 15, 533–547, https://doi.org/10.1130/GSATG462A.1, 2020. https://doi.org/10.1130/GES02039.1, 2019. Wenzel, K., Rothermel, M., Fitsch, D., and Haala, N.: Image Acquisition and Model Selection for Multi-View Stereo. In- ternational Archives of the Photogrammetry, Remote Sens- ing and Spatial Information Sciences, XL-5(W1), 251–258, https://doi.org/10.5194/isprsarchives-xl-5-w1-251-2013, 2013. https://doi.org/10.5194/gc-5-1-2022 Geosci. Commun., 5, 1–9, 2022
You can also read