A Participatory Assessment of the Impact of Flooding in Some Communities in Lokoja, Kogi State, Nigeria - Scientific Research Publishing
←
→
Page content transcription
If your browser does not render page correctly, please read the page content below
American Journal of Climate Change, 2021, 10, 12-31
                                                                                                  https://www.scirp.org/journal/ajcc
                                                                                                              ISSN Online: 2167-9509
                                                                                                                ISSN Print: 2167-9495

A Participatory Assessment of the Impact of
Flooding in Some Communities in Lokoja,
Kogi State, Nigeria

Felix Ndukson Buba*, Samam Obaguo, Okibe Ogah, Felicia Oluwatoyin Ajayi

African Regional Centre for Space Science and Technology Education in English (ARCSSTE-E), Obafemi Awolowo University
Campus, Ile-Ife, Nigeria

How to cite this paper: Buba, F. N., Obaguo,      Abstract
S., Ogah, O., & Ajayi, F. O. (2021). A Partici-
patory Assessment of the Impact of Flooding       The frequency and consequences of extreme flood events have increased in
in Some Communities in Lokoja, Kogi State,        recent times, having huge impact on the socio-economic well-being of na-
Nigeria. American Journal of Climate Change,
                                                  tions with the most significant impact being felt at the community level.
10, 12-31.
https://doi.org/10.4236/ajcc.2021.101002          Flooding is the most common environmental hazard in Nigeria, particularly
                                                  Lokoja, with the frequency, intensity, and extent likely to increase due to the
Received: August 6, 2020                          effects of global warming leading to climate change such as sea level rise,
Accepted: March 14, 2021
                                                  more intensive precipitation levels, and higher river discharges. While de-
Published: March 17, 2021
                                                  structive impacts of flood events continue to increase, flood managers in Ni-
Copyright © 2021 by author(s) and                 geria have continued to implement a top-down approach towards mitigating
Scientific Research Publishing Inc.               these impacts, without involving affected communities in planning and im-
This work is licensed under the Creative
                                                  plementation of mitigation strategies. This study therefore employed a parti-
Commons Attribution International
License (CC BY 4.0).                              cipatory approach to determine the causes and impact of flooding in the
http://creativecommons.org/licenses/by/4.0/       study area. Participatory research tools such as key informant interviews, fo-
                 Open Access                      cus group discussions, and questionnaire surveys using the purposive sam-
                                                  pling method were deployed to elicit data on the perception of the communi-
                                                  ties about the causes and impact of flood events. Descriptive statistical analy-
                                                  sis was performed to elucidate the major causes and areas of impact while qu-
                                                  alitative analysis was carried out to corroborate the results and to make for a
                                                  robust outcome. The Chi Square Test analysis was performed to empirically
                                                  establish a relationship between the impacts and flooding. Results show that
                                                  major causes of flooding are the release of water from dams (83% in Adan-
                                                  kolo, 97% in Gadumo, and 100% in Ganaja), overflow of rivers, and heavy
                                                  rainfall while flooding affects economic concerns, property and basic ameni-
                                                  ties. The Chi Square Test analysis determined empirically that a relationship
                                                  exists between several areas of impact and flood occurrence. The research
                                                  concludes that participatory flood research approach can provide flood man-

DOI: 10.4236/ajcc.2021.101002           Mar. 17, 2021                12                          American Journal of Climate Change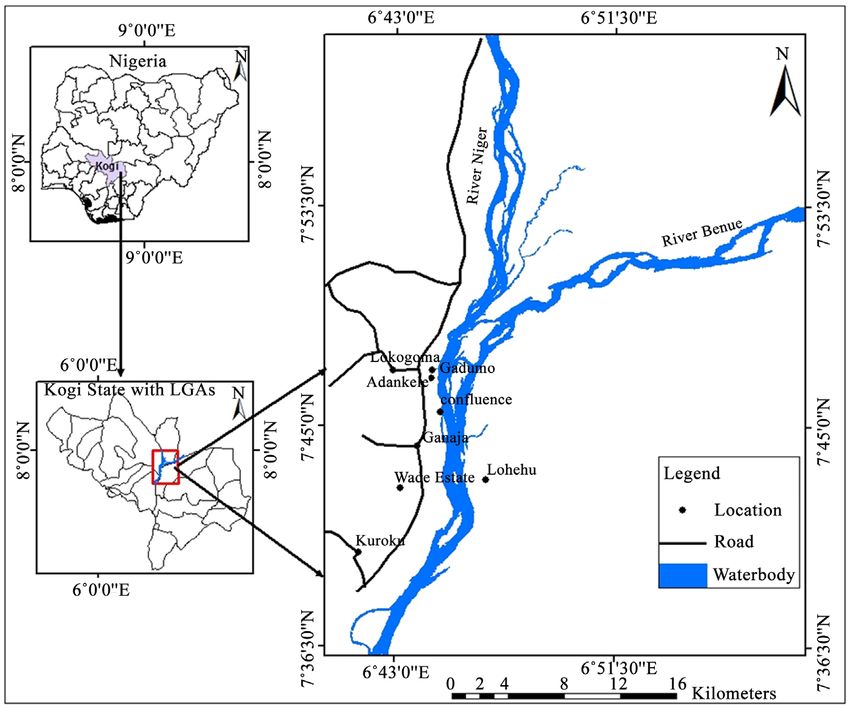
F. N. Buba et al.

                                  agers and decision makers a bottom-up approach for effective and robust
                                  flood mitigation strategies.

                                  Keywords
                                  Flood Impact, Participatory Approach, Chi Square Test, Top-Down,
                                  Bottom-Up, Mitigation

                                1. Introduction
                                Over the years the world has witnessed several notable disasters which have
                                caused large fatalities, devastating economic losses, and incredible environ-
                                mental damages, with the most significant impact of natural disasters being felt
                                at the community level. Floods are among the most devastating natural disasters
                                in the world, claiming more lives and causing more damage to properties than
                                any other natural phenomena, as well as being the most widespread (Kundu &
                                Kundu, 2011; Rabalao, 2010). Statistically, every year approximately 100 million
                                people are affected by episodes of flooding globally (Sayama et al., 2010).
                                   Developing countries especially in the African continent are vulnerable to
                                flood disasters due to the weakness of state infrastructure and absence or lack of
                                implementation of appropriate policies guiding disaster reduction and preven-
                                tion. Nigeria is one of the most disaster-prone countries in Africa, and floods are
                                the most common and recurring natural disaster, with the frequency, severity,
                                and spread of these floods increasing (FGN, 2013). The most devastating floods
                                in the history of the country occurred between July and October 2012, affecting
                                25 of the 36 states. The impact was very high and unprecedented in terms of
                                human, material, and production loss: 363 people killed, 5851 injured, 3,891,304
                                affected, and 387,153 displaced (FGN, 2013). Flooding is a frequent phenome-
                                non in major urban centres such as Lagos, Port Harcourt, Kano, Kaduna, etc.
                                   Floods can be caused by anthropogenic activities which are human interven-
                                tion in the natural processes which may include increase in settlement areas;
                                population growth in low-lying plains prone to flooding leading to alterations in
                                the natural drainage and river basin system; deforestation and climate change;
                                and urbanization (Nharo, 2016; Adefisan et al., 2015; Nkwunonwo et al., 2015;
                                Komolafe et al., 2015; Iyi & Ugwuanyi, 2014; FGN, 2013; Ojigi et al., 2013; San-
                                tato et al., 2013; WMO, 2008). Attempts by man to harness available water re-
                                sources have resulted in the construction of dams and other water control
                                structures. The failures of these structures have resulted in floods (Komolafe et
                                al., 2015; Rabalao, 2010).
                                   Rabalao (2010) investigated the social, psychological and economic impact of
                                flooding in Ga-Motla and Ga-Moeka communities of Moretele district in
                                northwest province, South Africa, using participatory approach through ques-
                                tionnaire administration, and concluded that the changing environment due to
                                urbanization, sprawl, and increase in population density exacerbate the impacts

DOI: 10.4236/ajcc.2021.101002                        13                          American Journal of Climate Change
F. N. Buba et al.
of flooding. Hu et al. (2019) investigated the impact of flooding on the Chinese
economy from the perspective of the manufacturing sector and found that large
flood events on average reduce firm outputs (measured by labour productivity)
by about 28.3% per year. Using an input-output analysis, the study estimated the
potential macro-economic impact to be 12.3% annual loss in total output, which
amounts to 15,416 RMB billion, which indicates that the scale of economic im-
pacts from flooding is much larger than microanalyses of direct damage indi-
cates.
Tawari-Fufeyin et al. (2015) conducted a study to evaluate the effects of the
Nigerian 2012 flood waters in selected towns of Bayelsa and Delta States in terms
of some physical and chemical parameters. The study concluded that although
the communities were adversely affected by the floods in terms of their liveli-
hoods with a likelihood of some effects on the potable water sources of the
communities, the study did not, however, reveal any significant or drastic effect
on the water sources as most of the parameters measured were within allowable
limits set by the World Health Organization (WHO). Umaru and Hafiz (2019)
conducted another study to examine the perceived effects of flooding on lives
and properties of the residents of Lokoja. Although results showed that flooding
caused damage to household properties, vehicles, building collapse, farmlands,
etc., the study did not seek to empirically establish a relationship between flood
events and the identified impacts.
The need to involve the public in the process of decision-making for sustain-
able development is increasingly being recognized. Participation is hence a cen-
tral issue within the field of development cooperation, participatory develop-
ment being defined as a partnership which is built upon the basis of dialogue
among the various actors, during which the agenda is jointly set, and local views
and indigenous knowledge are deliberately sought and respected (Kienberger &
Steinbruch, 2005). Participatory development involves people who are affected
by developmental processes as planners and implementers. It is a way of over-
coming the shortcomings of top-down development and the limitations of ex-
pert research and planning (Development Studies Network, 2013).
The aim of participatory approach is to facilitate the identification of prob-
lems peculiar to an environment by the indigenous citizens and not outsiders
who assume what their problems are. The best practice guidance on flood pre-
vention, protection, and mitigation from the European Union Water Directives
stipulates that public participation in decision-making concerning flood preven-
tion and protection is needed, both to improve the quality and the implementa-
tion of the decisions and to give the public the opportunity to express its con-
cerns and to enable authorities take due account of such concerns (Demeritt &
Nobert, 2014). The common practice of eliciting comments only after most of
the work of reaching a decision has been done is cause for resentment, while
many decisions can be better informed and their information base can be more
credible if the interested and affected parties are appropriately and effectively
involved (Cinderby & Forrester, 2016).
DOI: 10.4236/ajcc.2021.101002 14 American Journal of Climate ChangeF. N. Buba et al.
So far, state and government agencies have played a dominant role in shaping
policy responses and decision-making for flood management (known as the
top-down approach) in Nigeria, with inadequate space for non-state actors and
local communities (Olorunfemi, 2011). This has resulted in significant short-
comings in the formulation of flood management strategies. This situation in-
formed the participatory approach adopted in this research.
Flood disasters in Kogi State, particularly Lokoja and its environs have been a
recurring phenomenon. In 2010 and 2012 several communities in Lokoja, Ibaji,
and Kogi Local Government Areas (LGAs) were devastated by flooding. Three
hundred and forty-four (344) communities of the State were affected by the 2012
floods with many farmlands submerged (Okpala-Okaka et al., 2013). Aside from
the loss of lives and properties, floods prevent the optimal exploitation of the
land and proper management and control of water resources (Ojigi et al., 2013).
This research employed a participatory approach to assess the impact of flood
events on three communities that are inundated almost on an annual basis in
Lokoja. The study set out to elicit the causes and impact of flooding, and to de-
termine or establish an empirical relationship between flood events and the
identified impacts. By adopting participatory approach, the researchers are con-
vinced that the most vulnerable groups and the threats they face can be better
identified because local knowledge can improve the way in which internal and
external actors understand flood risk and take decisions about flood manage-
ment.
2. Materials and Methods
2.1. Study Area
Nigeria has two major drainage systems flowing through it: the Rivers Niger and
Benue that divide the country into three unequal geographical regions with a
confluence in the Lokoja area of Kogi State, making Kogi State and Lokoja in
particular one of the areas frequently affected by floods (Oluwaseun et al., 2013).
The study area is located in Lokoja, at latitude 7˚45'0''N to 7˚53'30''N and longi-
tude 6˚43'0''E to 6˚51'30''E (see Figure 1), with a total land area of 29,833 km2
(Adefisan & Egiku, 2018). Communities located around the channels and at the
confluence of these rivers bear the full brunt of the impacts of flood events, with
three of these communities, Gadumo, Adankolo, and Ganaja, among the most
affected.
The climate of the study area is characterized by wet and dry seasons: the dry
season lasts from November to February while the wet season lasts from March
to October. The annual rainfall is between 1016 mm and 1524 mm; the city is
generally hot throughout the year with an annual temperature of 27˚C (Alabi,
2009). Economically, the strategic central location of the city and its location at
the confluence region of the two great rivers Niger and Benue attracted many
ethnic groups and individuals. Economic activities such as agriculture, spinning,
weaving, blacksmithing, pottery, dyeing, fishing, etc are carried out by the
DOI: 10.4236/ajcc.2021.101002 15 American Journal of Climate ChangeF. N. Buba et al.
Figure 1. Map of the study area.
various ethnic groups in Lokoja (Audu, 2009), with agriculture being the main
occupation of the people.
2.2. Data Requirements
The research collected data from a sample of an identified population, employ-
ing a combination of questionnaire survey and interview survey. It employed
purposive sampling technique for the administration of questionnaires and the
snowball or chain-referral sampling technique was employed for interviews (key
informants and focus group discussions). The chain-referral method is a tech-
nique of sampling based on purposive sampling, normally used to select re-
spondents based on their expertise, experiences and job responsibilities (Maf-
eretlhane, 2012). The chain-referral involves an iterative process to identify
relevant personalities through interviews with state and local officials, traditional
rulers, and other relevant stakeholders referred to the researcher (Lo et al., 2012,
cited in Buba, 2016). This maximizes the efficiency of stakeholder identification
that leads to a representation of a wide range of situated knowledge and exper-
tise including certified experts and key player organizations, and uncertified ex-
perts from local communities and Non-Governmental Organizations (Maskrey
et al., 2016).
Community support and approval for the study were obtained through meet-
ings with traditional leadership, political structures (ward councillors and de-
velopment committees) and other stakeholders. Primary data collection was
achieved through participatory approaches, that is, the application of tools for
DOI: 10.4236/ajcc.2021.101002 16 American Journal of Climate ChangeF. N. Buba et al.
eliciting the local knowledge and perceptions such as interviews and question-
naire administration surveys. Some of the stakeholders involved in the study in-
clude community representatives from affected sectors such as trade and agri-
culture, government officials, elders, village heads and chiefs and other commu-
nity leaders, and victims of flood events.
Fieldwork was undertaken for the purposes of participatory data collection.
The initial activities were comprised of visits to the local government and inter-
actions with some of the local people. Based on these initial activities, a selection
was made of the communities that were always inundated and worst hit by
flooding. In this regard, three (3) communities were identified which included
Ganaja, Gadumo, and Adankolo. These were the communities that were studied
in detail. During this step it was important to clearly discuss the purpose of the
work, being purely academic, to avoid creating different expectations from the
people. This initial approach was necessary in order to create empathy and rap-
port with the local people which is important when carrying out commu-
nity-based research.
The knowledge captured included flood events experienced in terms of mag-
nitude, type, and frequency; causes of floods; and impacts in terms of physical,
economic, and social effects. The participatory tools employed include:
1) Key informant interview (KII): semi-structured interviews guided by a set
of questions but conducted in a semi-open format to allow the interviewee to
talk freely about the issues. The researchers conducted a total of three (3) key
informant interviews, one key informant selected for each of the three villages,
the selection done through the chain referral sampling technique.
2) Focus group discussions (FGD): conducted mainly with community mem-
bers affected by flooding. A total of three focus group discussions were held, one
in each of the three villages. Participants were informed and mobilized before-
hand through the village heads and community leaders. Participants were en-
couraged to freely contribute their views on all issues concerning the research
topic, although the discussions were guided by a set of questions.
3) Questionnaire Administration Survey: a detailed survey was conducted,
making use of a purposive sampling method for questionnaire administration. A
total of one hundred and seventy number of questionnaires were administered
while one hundred and sixty-nine were retrieved: sixty-seven for Ganaja village,
fifty-three for Gadumo village, and 49 for Adankolo village.
Data from focus group discussions and key informant interviews were audio
recorded and stored in a password-protected system to ensure confidentiality
and access to the researchers only. The audio recordings were transcribed and
the transcripts subjected to further analysis.
2.3. Analyses
Data from the questionnaire survey were analysed using the SPSS package. Two
main analyses were conducted. Descriptive statistical analysis was done to de-
termine the frequency and percentages of respondents as regards the causes of
DOI: 10.4236/ajcc.2021.101002 17 American Journal of Climate ChangeF. N. Buba et al.
flooding in the study area and to also determine the major areas of livelihood of
the people impacted. The major areas determined to be impacted by flooding
were subjected to further analysis using the Chi Square inferential statistical test
to empirically determine if there is any association between the areas impacted
and flooding. The Chi square test is a statistical test which measures the associa-
tion between two categorical variables (Ugoni & Walker, 1995), and is calcu-
lated under the assumption of no association, with the degree of freedom given
as one (1) at 5% level of significance (95% confidence level). The rule for
making a decision is that if the p-value < 0.05, we conclude that an association
exists while if the p-value > 0.05, we conclude that no association exists, where
the p-value is the probability of observing a sample statistic as extreme as the
test statistic.
Data from focus group discussions and key informant interviews were quali-
tatively analysed, adopting a thematic analytical approach to derive recurring
categories and themes. The transcripts were used to develop a codebook using a
hybrid of inductive approach. The quotations from participants were pooled to-
gether to understand patterns across the data.
3. Results and Discussion
3.1. Results
Data generated from the questionnaire administration during the fieldwork were
analysed using the SPSS package to determine the causes of flood events and to
assess the impact of flood events on the communities in the study area. Table 1
an Table 2 detail the causes of floods while Tables 3-7 detail the areas most im-
pacted by the flood events.
Table 1. Major causes of flood events in the study area.
Adankolo Gadumo Ganaja
Frequency Percent (%) Frequency Percent (%) Frequency Percent (%)
Heavy rainfall 15 24.2 34 44.7 33 42.9
Overflow of rivers 47 75.8 41 54.0 44 57.1
No response 0 0 1 1.3 0 0
Total 62 100 76 100 77 100
Table 2. Other causes of flooding.
Adankolo Gadumo Ganaja
Frequency Percent (%) Frequency Percent (%) Frequency Percent (%)
Opening of dam 15 83.3 36 97.3 27 100
Erosion 1 5.6 0 0 0 0
Lack of drainage
2 11.1 0 0 0 0
system
Cutting down
0 0 1 2.7 0 0
of trees
Total 18 100 37 100 27 100
DOI: 10.4236/ajcc.2021.101002 18 American Journal of Climate ChangeF. N. Buba et al.
Table 3. Major economic concerns affected by flooding in the study area.
Adankolo Gadumo Ganaja
Frequency Percent (%) Frequency Percent (%) Frequency Percent (%)
Farmlands 47 58.0 52 41.6 60 42.5
Markets 12 14.8 31 24.8 42 29.8
Transportation
21 25.9 41 32.8 33 23.4
system
Electricity supply 1 1.3 1 0.8 6 4.3
Total 81 100 125 100 141 100
Table 4. Other economic losses due to flooding.
Adankolo Gadumo Ganaja
Frequency Percent (%) Frequency Percent (%) Frequency Percent (%)
Affected animals 2 25 4 40 0 0
Collapse of
6 75 5 50 4 80
houses and shops
Documents
0 0 1 10 0 0
destroyed
Reduction of
0 0 0 0 1 20
house rent
Total 8 100 10 100 5 100
Table 5. Basic amenities affected by flooding in the study area.
Adankolo Gadumo Ganaja
Frequency Percent (%) Frequency Percent (%) Frequency Percent (%)
Roads 41 27.9 47 31.6 43 27
Water supply 18 12.2 40 26.8 36 22.6
Health facilities 5 3.4 2 1.3 7 4.5
Schools 34 23.1 6 4.0 9 5.6
Houses 48 32.7 53 35.6 64 40.3
Documents 1 0.7 0 0 0 0
Student activities 0 0 1 0.7 0 0
Total 147 100 149 100 159 100
Table 6. Outbreak of major diseases due to flooding in the study area.
Adankolo Gadumo Ganaja
Frequency Percent (%) Frequency Percent (%) Frequency Percent (%)
Cholera 28 32.6 42 32.3 50 34.0
Typhoid fever 27 31.4 38 29.2 44 29.9
Malaria 31 36 50 38.5 46 31.3
Hepatitis 0 0 0 0 7 4.8
Total 86 100 130 100 147 100
DOI: 10.4236/ajcc.2021.101002 19 American Journal of Climate ChangeF. N. Buba et al.
Table 7. Other diseases due to flooding.
Adankolo Gadumo Ganaja
Frequency Percent (%) Frequency Percent (%) Frequency Percent (%)
Snake bite 1 25 1 33.4 0 0
Leg cut 2 50 0 0 0
Skin problem 1 25 0 0
Guinea worm 0 0 1 33.3 0 0
Cold 0 0 1 33.3 0 0
Total 4 100 3 100 0 0
The data were also analysed using the Chi square test to determine the asso-
ciation between flooding and various impacts assessed. Some of the impacts of
flooding on the communities from community-generated data and assessed by
the study include the effects of flooding on markets, transportation system,
farmlands, water supply, health facilities, electricity supply, schools, houses, and
on health concerns such as cholera, typhoid fever, malaria, and hepatitis.
Assumption 1:
The transportation system is NOT affected by flood occurrence.
Alternatives Observed Expected Residual
Yes 95 115.1 −20.1
No 74 53.9 20.1
Degree of freedom df = 1
Chi-Square X2 = 10.962a
p-value p = 0.001
Determination of critical value
Degree of freedom is given by df = 1 at 5% level of significance.
X2 =10.962a
p = 0.001
Decision rule: reject assumption if p-value < 0.05 and accept if p-value > 0.05.
Since p-value (0.001) is less than 0.05, the assumption of no association was
rejected. This implies that the transportation system is affected by flood occur-
rence.
Assumption 2:
Farmlands are NOT affected by flood occurrence.
Alternatives Observed Expected Residual
Yes 159 147.9 11.1
No 10 21.1 −11.1
Degree of freedom df = 1
Chi-Square X2 = 6.696a
p-value p = 0.010
DOI: 10.4236/ajcc.2021.101002 20 American Journal of Climate ChangeF. N. Buba et al.
Determination of critical value
Degree of freedom is given by df = 1 at 5% level of significance.
X2 = 6.696a
p = 0.010
Decision rule: reject assumption if p-value < 0.05 and accept if p-value > 0.05.
Since p-value (0.010) is less than 0.05, the assumption of no association was
rejected. This implies that farmlands are affected by flood occurrence.
Assumption 3:
Markets are NOT affected by flood occurrence.
Alternatives Observed Expected Residual
Yes 131 112.7 18.3
No 38 56.3 −18.3
Degree of freedom df = 1
Chi-Square X = 8.950a
2
p-value p = 0.003
Determination of critical value
Degree of freedom is given by df = 1 at 5% level of significance.
X2 =8.950a
p = 0.003
Decision rule: reject assumption of no association if p-value < 0.05 and accept
if p-value > 0.05.
Since p-value (0.003) is less than 0.05, the assumption of no association was
rejected. This implies that markets are also affected by flood occurrence.
Assumption 4:
Water supply is NOT affected by flood occurrence.
Alternatives Observed Expected Residual
Yes 94 112.7 −18.7
No 75 56.3 18.7
Degree of freedom df = 1
Chi-Square X2 = 9.278a
p-value p = 0.002
Determination of critical value
Degree of freedom is given by df = 1 at 5% level of significance.
X2 =9.278a
p = 0.002
Decision rule: reject assumption of no association if p-value < 0.05 and accept
if p-value > 0.05.
Since p-value (0.002) is less than 0.05, the assumption of no association was
DOI: 10.4236/ajcc.2021.101002 21 American Journal of Climate ChangeF. N. Buba et al.
rejected. This implies that the water supply is also affected by flood occurrence.
Assumption 5:
Health facilities are NOT affected by flood occurrence.
Alternatives Observed Expected Residual
Yes 14 18.8 −4.8
No 155 150.2 4.8
Degree of freedom df = 1
Chi-Square X2 = 1.368a
p-value p = 0.242
Determination of critical value
Degree of freedom is given by df = 1 at 5% level of significance.
X2 =1.368a
p = 0.242
Decision rule: reject assumption of no association if p-value < 0.05 and accept
if p-value > 0.05.
Since p-value (0.242) is greater than 0.05, the assumption of no association
was accepted. This implies that the health facilities in the study area are not af-
fected by flood occurrence.
Assumption 6:
Electricity supply is NOT affected by flood occurrence.
Alternatives Observed Expected Residual
Yes 8 9.4 −1.4
No 161 159.6 1.4
Degree of freedom df = 1
Chi-Square X2 = 0.218a
p-Value p = 0.641
Determination of critical value
Degree of freedom is given by df = 1 at 5% level of significance.
X2 =1.368a
p = 0.641
Decision rule: reject assumption of no association if p-value < 0.05 and accept
if p-value > 0.05.
Since p-value (0.641) is greater than 0.05, the assumption of no association
was accepted. This implies that the electricity facilities in the study area are not
affected by flood occurrence.
Assumption 7:
School facilities are NOT affected by flood occurrence.
DOI: 10.4236/ajcc.2021.101002 22 American Journal of Climate ChangeF. N. Buba et al.
Alternatives Observed Expected Residual
Yes 49 42.3 6.8
No 120 126.8 −6.8
Degree of freedom df = 1
Chi-Square X = 1.438a
2
p-Value p = 0.230
Determination of critical value
Degree of freedom is given by df = 1 at 5% level of significance.
X2 =1.438a
p = 0.230
Decision rule: reject assumption of no association if p-value < 0.05 and accept
if p-value > 0.05.
Since p-value (0.230) is greater than 0.05, the assumption of no association
was accepted. This implies that school facilities in the study area are not affected
by flood occurrence.
Assumption 8:
Houses are NOT affected by flood occurrence.
Alternatives Observed Expected Residual
Yes 165 153.6 11.4
No 4 15.4 −11.4
Degree of freedom df = 1
Chi-Square X = 9.246a
2
p-Value p = 0.002
Determination of critical value
Degree of freedom is given by df = 1 at 5% level of significance.
X2 =9.246a
p = 0.002
Decision rule: reject assumption of no association if p-value < 0.05 and accept
if p-value > 0.05.
Since p-value (0.002) is less than 0.05, the assumption of no association was
rejected. This implies that houses in the study area are affected by flood occur-
rence.
Assumption 9:
There is NO cholera outbreak after the flood occurrence.
Alternatives Observed Expected Residual
Yes 120 135.2 −15.2
No 49 33.8 15.2
Degree of freedom df = 1
Chi-Square X = 8.544a
2
p-value p = 0.003
DOI: 10.4236/ajcc.2021.101002 23 American Journal of Climate ChangeF. N. Buba et al.
Determination of critical value
Degree of freedom is given by df = 1 at 5% level of significance.
X2 =8.544a
p = 0.003
Decision rule: reject assumption of no association if p-value < 0.05 and accept
if p-value > 0.05.
Since p-value (0.003) is less than 0.05, the assumption of no association was
rejected. This implies that cholera outbreaks affect people in the communities
after a flood occurrence.
Assumption 10:
Typhoid fever DOES NOT affect people after a flood occurrence.
Alternatives Observed Expected Residual
Yes 109 120.7 −11.7
No 60 48.3 11.7
Degree of freedom df = 1
Chi-Square X = 3.979a
2
p-Value p = 0.046
Determination of critical value
Degree of freedom is given by df = 1 at 5% level of significance.
X2 =3.979a
p = 0.046
Decision rule: reject assumption of no association if p-value < 0.05 and accept
if p-value > 0.05.
Since p-value (0.046) is less than 0.05, the assumption of no association was
rejected. This implies that typhoid fever does affect people in the communities
after a flood occurrence.
Assumption 11:
Malaria DOES NOT affect people after a flood occurrence.
Alternatives Observed Expected Residual
Yes 127 112.7 14.3
No 42 56.3 −14.3
Degree of freedom df = 1
Chi-Square X = 5.470a
2
p-Value p = 0.019
Determination of critical value
Degree of freedom is given by df = 1 at 5% level of significance.
X2 =5.470a
p = 0.019
DOI: 10.4236/ajcc.2021.101002 24 American Journal of Climate ChangeF. N. Buba et al.
Decision rule: reject assumption of no association if p-value < 0.05 and accept
if p-value > 0.05.
Since p-value (0.019) is less than 0.05, the assumption of no association was
rejected. This implies that malaria does affect people after a flood occurrence.
Assumption 12:
Hepatitis DOES NOT affect people after a flood occurrence.
Alternatives Observed Expected Residual
Yes 7 9.4 −2.4
No 162 159.6 2.4
Degree of freedom df = 1
Chi-Square X = 0.644a
2
p-Value p = 0.422
Determination of critical value
Degree of freedom is given by df = 1 at 5% level of significance.
X2 =0.644a
p = 0.422
Decision rule: reject assumption of no association if p-value < 0.05 and accept
if p-value > 0.05.
Since p-value (0.422) is greater than 0.05, the assumption of no association
was accepted. This implies that cases of hepatitis do not arise in the study after a
flood occurrence.
To further assess the impact of flooding in the study area, qualitative analysis
of data from focus group discussion and key informant interview was under-
taken. A cross section of participants expressed the following views:
Destruction of property, relocation of residents, expansion of gutter
R: When flood comes, it will destroy so many houses and properties:
KII_Adankolo.
R: The flood demolished/collapsed some of the houses that the foundations
were not strong enough when building it. You can see that flood has collapsed
some of the buildings: KII_Ganaja.
R: Some have packed away from most of the affected houses permanently. For
some since it occurs every year, they move out and after the flood they return
after renovating the house: KII_Gadumo.
Low/lack of business patronage, destruction of farm lands/animals
R: The patronage here is also low because nobody will want water to carry
them away when they come here for business. If you are moving about you will
be told that maybe the water has gone under with people: KII_Ganaja.
P: … for example there are 10 rooms in this compound and I am occupying
just a room so the challenge is that people will not agree to come back to rent
this place after the flood because they are afraid of packing their properties out
again when another flood occurs: FGD_Ganaja.
DOI: 10.4236/ajcc.2021.101002 25 American Journal of Climate ChangeF. N. Buba et al.
R: The challenge is that during the flood, there is no business activity going on
here: KII_Gadnaja.
R: If you have a fish pond here and if the water gets to a particular level, the
fishes will be swept off, the flood will wipe away the house, and you can’t use the
lands for farming: KII_Ganaja.
R: I had a house where I was rearing animals but when flood came, I had no
place to pack them to … And you are looking for buyer and there is none, so
when there is no place to pack them to, that is how we lose our animals. This my
neighbour Alhaji had goats, he lost them. Because when water is coming both
animals and humans start running to save our lives: KII_Gadumo.
R: The flood destroyed our crops e,g maize, rice, groundnut: KII_Gadumo.
R: Look at our crops, I cultivated this farmland here but the flood came and
destroyed it. Sometimes we will collect loan to farm and after farming, flood will
move everything away. So where do you get money to pay back the loan, this will
cause problem between us and the banks: KII_Adankolo.
Presence of dangerous animals, loss of life, dirty environment, paralysis of
activities
R: during flood, there is the presence of dangerous animals like snakes, scor-
pions: KII_Ganaja.
P: when flood starts you will see different kinds of terrible snakes, even yes-
terday we still saw snakes coming out of the river: FGD_Gadumo.
R: During the flood, a lot of people lost their lives: KII_Ganaja.
P: … the farmland, everything even trees are dying; you can see that tree there
dead not to talk about human lives: FGD_Gadumo.
R: Then after the flood, the environment will be so dirty: KII_Ganaja.
R: No activity goes on during the flood, people will have to run for their lives:
KII_Ganaja.
Imposes hardship, invasion of disease and sickness, exploitation
P: flood imposes hardship on the community: FGD_Gadumo.
P: So now we don’t have anything, not even food. We even beg people to give
us a room to stay but they will not accept: FGD_Ganaja.
P: Even the water flowing here is so poisonous. You heard one of our elders
here saying that his leg is paining him (disease): FGD_Gadumo.
P: there is this infection around already; bacterial infection and all that, we
have to fumigate: FGD_Gadumo.
P: it also came with a lot of sicknesses e.g diarrhoea, malaria, hepatitis:
FGD_Ganaja.
P: when this flood comes, some people take it as an opportunity to make
money from us; if you want to rent a room for just 1 or 2 months before you re-
turn to your house, somebody will tell you to pay #30,000 for one-bedroom flat:
FGD_Adankolo.
3.2. Discussion
Findings from the descriptive statistical analyses conducted on the data gener-
DOI: 10.4236/ajcc.2021.101002 26 American Journal of Climate ChangeF. N. Buba et al.
ated from the questionnaire survey indicated that the major cause of flooding in
the communities is the opening of Ladgo dam in Cameroun. In Adankolo
community, 83% of respondents attribute flooding to the opening of the said
dam while 97.3% and 100% of respondents in Gadumo and Ganaja communities
respectively also attribute flooding in their communities to the opening of the
dam. The next important cause of flooding in these communities is the overflow
of rivers Niger, Benue, and Meme (Adankolo 75.8%, Gadumo 54%, and Ganaja
57.1%). The heavy rainfall experienced in these communities also causes flood-
ing, to a lesser degree (Adankolo 24.2%, Gadumo 44.7%, and Ganaja 42.9%).
Other factors mentioned that exacerbate flooding but are not the cause include
erosion and lack of drainage systems. These findings are consistent with a study
conducted by Ojigi et al. (2013) on the geospatial mapping of the 2012 flood dis-
aster in central parts of Nigeria. In the study, the researchers attributed the 2012
flooding to the release of waters from Ladgo dam in Cameroun into the River
Benue floodplain.
Data from participatory approaches such as focus group discussions and key
informant interviews were analysed qualitatively to also determine the causes of
flooding. Qualitative analysis was done to corroborate the results from the ques-
tionnaire survey and to make the research more robust. After pooling the re-
sponses thematically, three main causes of flooding became apparent: release of
water from dams, poor dam maintenance, and heavy rainfall. Results of the
qualitative analysis of data from focus group discussions and key informant in-
terviews relating to the causes of flooding were consistent and support results
from questionnaire data analysis.
Findings from further analyses of the questionnaire survey data using the Chi
square inferential statistical technique revealed an empirical association between
the identified impacts with flooding in all the three communities. Impacts such
as destruction of markets, transportation system, farmlands, water supply infra-
structure, and houses (Figure 2) showed empirical association with flooding.
Findings also revealed an empirical association between health challenges such
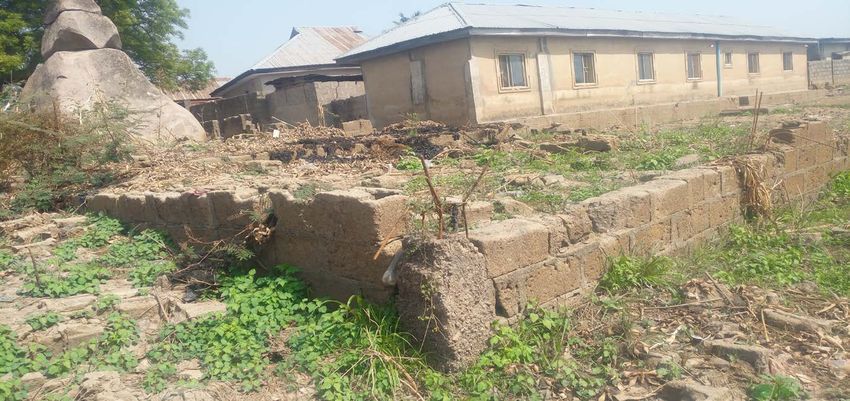
Figure 2. Property destroyed by a previous flood and a new one constructed on the same
site at Adankolo (Source: fieldwork, 2019).
DOI: 10.4236/ajcc.2021.101002 27 American Journal of Climate ChangeF. N. Buba et al.
as cholera, typhoid fever, and malaria. These findings are also consistent with a
study carried out by Umaru and Hafiz (2019) on the perceived effects of flood on
lives and properties of the residents of Lokoja. Their study showed that flooding
caused damage to, among others, buildings, farmlands, and other infrastructure.
An interesting aspect of the present study is that the Chi square statistical test
showed no association between flooding and such infrastructure as water supply,
health facilities, electricity supply and school facilities. This may be explained by
the fact that such infrastructure are sited outside of the floodplain. Hepatitis as a
health challenge did not show any association with flooding in the study area.
To further assess the impact of flooding in the study area, qualitative analysis
of data from focus group discussion and key informant interview on areas of
impact was undertaken. This was to also corroborate results from questionnaire
survey and therefore make the research more robust. Pooling the responses of
participants from these two interview types together, a thematic analysis re-
vealed the following categories of impacts: destruction of property and houses,
impromptu relocation of residents, low/lack of business patronage, destruction
of farm lands/animals; presence of dangerous animals, loss of life, degrading the
environment, paralysis of activities; hardship, diseases and sickness, and exploi-
tation by unscrupulous landlords. These impacts as revealed from qualitative
analysis of focus group discussion and key informant interviews were consistent
and indeed corroborate the results from the questionnaire survey analysis.
This research has studied in some detail the impact of flooding in the com-
munities that made up the study area. This information is very important in the
context of contingency planning and emergency response, and therefore needed
by flood managers and other relevant authorities. Knowing where the flood dis-
aster has had the most impact will determine the direction of emergency re-
sponse, relief and recovery and will also determine the thinking for contingency
planning for future flood events. In developed countries, the information on the
severity of flooding measured by the impact will be key in insurance claims.
Equally important, the study has revealed that affected communities should be
involved in a participatory and bottom-up manner in drawing up measures to
mitigate the impacts of flooding, and indeed, in flood management strategies.
Flooding is a complex socio-environmental problem, and understanding its
complexities requires consideration of multiple stakeholder perceptions and
knowledge claims. This explains the multi-disciplinary nature of any research on
flooding, employing a diverse knowledge base including the perception of the
people directly affected by the disaster, because different types of knowledge
about floods can come from both analysis by researchers and experiences of
people in flood-affected areas. Investigating the impacts of flooding from the
perspective of the affected communities will help policy and decision makers to
employ a bottom-up approach to flood mitigation.
The Chi Square Test analysis was employed in this work to establish an em-
pirical relationship between flooding and its deleterious outcomes such as de-
struction of property and the outbreak of diseases. To the best knowledge of the
DOI: 10.4236/ajcc.2021.101002 28 American Journal of Climate ChangeF. N. Buba et al.
researchers based on widely reviewed literature on flooding in Nigeria, the chi
square has not been employed as a methodological approach to test inferentially
the impact of flood events in the country.
4. Conclusion
The National Emergency Management Agency (NEMA) is the department of the
Nigerian government saddled with the constitutional responsibility of managing
floods and other disasters in the country. Their interventions, however, are gen-
erally seen to be reactive, focusing on the distribution of relief materials after
flood events. This approach to flood management is seen to be inadequate and
top-down as they do not involve the affected communities in any decisions.
This study therefore employed participatory tools that involved these com-
munities to determine the causes of flooding in these communities and the main
areas of impact. The research concludes that flooding in the study area is mainly
caused by the release of water from Ladgo Dam in Cameroon, and overflow of
the Rivers Niger, Benue, and Meme, due to heavy rainfall. The research also
concludes that the areas most affected by flood events include houses, farmlands,
businesses and outbreak of diseases. The research also empirically determined
that there is a relationship between flood events and destroyed property and in-
frastructure and the outbreak of diseases in the study area. Having established
empirically that a relationship exists between destroyed infrastructure and dis-
eases, and flooding, the research concludes that flooding is responsible for the
destruction of basic amenities and the outbreak of some diseases in the affected
communities. Therefore, participatory approaches are suitable for flood research
and management because they ensure a bottom-up approach for robust flood
management strategies.
Conflicts of Interest
The authors declare no conflicts of interest regarding the publication of this
paper.
References
Adefisan, E. A., & Egiku, J. (2018). Vulnerability Assessment of 2015 Flood in North
Central Nigeria Using Integrated Approach of Hydrological Model and GIS. Global
Scientific Journal, 6, 262-275.
Adefisan, E. A., Abdulkareem, S. B., & Orimoloye, I. R. (2015). Application of Geospatial
Technology in Identifying Areas Vulnerable to Flooding in Ibadan Metropolis. Journal
of Environment and Earth Sciences, 5, 156-165.
Alabi, M. O. (2009). Urban Sprawl, Pattern, and Measurement in Lokoja, Nigeria. Theo-
retical and Empirical Researches in Urban Management, 4, 158-164.
Audu, S. M. (2009). A Reflection on the Nature of Inter-Group Relations in Lokoja, Nige-
ria. Journal of Sustainable Development in Africa, 11, 325-333.
Buba, F. N. (2016). Analysis of the Spatial Distribution of Lead Concentration in the Soil
of Anka, Zamfara State, Nigeria. Journal of Environment Pollution and Human Health,
DOI: 10.4236/ajcc.2021.101002 29 American Journal of Climate ChangeF. N. Buba et al.
4, 16-23.
Cinderby, S., & Forrester, J. M. (2016). Co-Designing Possible Flooding Solutions: Par-
ticipatory Mapping Methods to Identify Flood Management Options from a UK Bor-
ders Case Study. Journal for Geographic Information Science, 1, 149-156.
https://doi.org/10.1553/giscience2016_01_s149
Demeritt, D., & Nobert, S. (2014). Models of Best Practice in Flood Risk Communication
and Management. Journal of Environmental Hazards, 13, 313-328.
https://doi.org/10.1080/17477891.2014.924897
Development Studies Network (2013). Challenges for Participatory Development in
Contemporary Development Practice. Development Bulletin No. 75.
FGN Federal Government of Nigeria (2013). Nigeria Post-Disaster Needs Assessment:
2012 Floods. A Report by the FGN with Technical Support from the World Bank,
European Union, United Nations, and Other Partners.
Hu, X., Pant, R., Hall, J. W., Surminski, S., & Huang, J. (2019). Multi-Scale Assessment of
the Economic Impacts of Flooding: Evidence from Firm to Macro-Level Analysis in the
Chinese Manufacturing Sector. Sustainability, 11, 1-18.
https://doi.org/10.3390/su11071933
Iyi, E. A., & Ugwuanyi, B. C. (2014). Community Participation Approach to Flood Disas-
ter Management: The Case of Enugu East Local Government Area of Enugu State, Ni-
geria. International Journal of Engineering Science Invention, 3, 4-13.
Kienberger, S., & Steinbruch, S. (2005). PGIS and Disaster Risk Management: Assessing
Vulnerability with PGIS Methods-Experiences from Buzi, Mozambique. Mapping for
Change: International Conference on Participatory Spatial Information Management
and Communication, Nairobi, 7-10 September 2005, 12 p.
Komolafe, A. A., Adegboyega, S. A., & Akinluyi, F. O. (2015). A Review of Flood Risk
Analysis in Nigeria. American Journal of Environmental Science, 11, 157-166.
https://doi.org/10.3844/ajessp.2015.157.166
Kundu, A., & Kundu, S. (2011). Flood Vulnerability Assessment Using PGIS Approach.
Journal of Remote Sensing and GIS, 2, 8-22.
Maferetlhane, I. O. (2012). The Role of Indigenous Knowledge in Disaster Risk Reduc-
tion: A Critical Analysis. Unpublished Master’s Thesis, Potchefstroom: North West
University.
Maskrey, A. S., Mount J. N., Thorne, R. C., & Dryden, I. L. (2016).Participatory Modeling
for Stakeholder Involvement in the Development of Flood Risk Management Interven-
tion Options. Environmental Modeling and Software, 82, 275-294.
https://doi.org/10.1016/j.envsoft.2016.04.027
Nharo, T. (2016). Modeling Floods in the Middle Zambezi Basin Using Remote Sensing
and Hydrological Modeling Techniques. Master of Science Thesis, Harare: University
of Zimbabwe.
Nkwunonwo, U. C., Malcolm, N., & Brian, B. (2015). Flooding and Flood Risk Reduction
in Nigeria: Cardinal Gaps. Journal of Geography and Natural Disasters, 5, 136.
Ojigi, M. L., Abdulkadir, F. I., & Aderoju, M. O. (2013). Geospatial Mapping and Analysis
of the 2012 Flood Disaster in Central Parts of Nigeria. 8th National GIS Symposium,
Dammam, 15-17 April 2013, 14 p.
Okpala-Okaka, C., Ndukwu, R. I., & Ebinne, E. S. (2013). Management of Flood Disaster
Risks in Nigeria. Journal of Environmental Management and Safety, 4, 6-18.
Olorunfemi, F. B. (2011). Managing Flood Disasters under a Changing Climate: Lessons
Learnt from Nigeria and South Africa. NISER Research Seminar Series, Ibadan, 3 May
DOI: 10.4236/ajcc.2021.101002 30 American Journal of Climate ChangeF. N. Buba et al.
2011, 44 p.
Oluwaseun, O. O., Ibrahim, A. T., Ahmed, I. A., Samsudeen, O. A., & Oladeinde, A.
(2013). The Role of Earth Observation Satellites during the International Collaboration
on the 2012 Nigeria Flood Disaster. 64th International Astronautical Congress, Beijing,
23-27 September 2013, 8 p.
Rabalao, R. T. (2010). The Social, Psychological, and Economic Impact of Flooding in
Ga-Motla and Ga-Moeka Communities of Moretele District in North West Province,
South Africa. Unpublished Master’s Thesis, Bloemfontein: University of the Free State.
Santato, S., Bander, S., & Schaller, M. (2013). The European Floods Directive and Opportu-
nities Offered by Land Use Planning. CSC Report 12, Hamburg: Climate Service Center
Germany.
Sayama, K., Fukami, K., Tanaka, S., & Takeuchi, K. (2010). Rainfall-Runoff-Inundation
Analysis for Flood Risk Assessment at the Regional Scale. International Symposium on
a Robust and Resilient Society against Natural Hazards and Environmental Disasters,
and the 3rd AUN/SEED-NET Regional Conference on Geo-Disaster Mitigation, Kyoto,
August 24-26 2010, 11 p.
Tawari-Fufeyin, P., Paul, M., & Godleads, A. O. (2015). Some Aspects of a Historic Flooding
in Nigeria and Its Effects on Some Niger-Delta Communities. American Journal of Water
Resources, 5, 7-16.
Ugoni, A., & Walker, B. F. (1995). The Chi Square Test: An Introduction. COMSIG Re-
view, 4, 1-5.
Umaru, J. U., & Hafiz, S. S. (2019). Perceived Effects of Flood on Lives and Properties of
the Residents of Lokoja, Kogi State, Nigeria. Discovery, 55, 441-452.
WMO World Meteorological Organization (2008). Urban Flood Risk Management—A
Tool for Integrated Flood Management, Version 1.0. WMO/GWP Associated Pro-
gramme on Flood Management, 2008: A Joint Initiative of the WMO and the Global
Water Partnership. Technical Document No. 11.
DOI: 10.4236/ajcc.2021.101002 31 American Journal of Climate ChangeYou can also read