Investigating the influence of phenological patterns on influxes of flying-foxes in urban environments - April 2021
←
→
Page content transcription
If your browser does not render page correctly, please read the page content below
Investigating the influence of
phenological patterns on
influxes of flying-foxes in urban
environments
Clean Air and Urban Landscapes Hub
Threatened Species Recovery Hub

April 2021

Shona Elliot-Kerr 1,2

Pia E Lentini 2,3

Brendan Wintle 2

Kylie Soanes1

1 School of Ecosystem and Forest Sciences, The University of Melbourne.

2 School of Biosciences, The University of Melbourne.

3 School of Global, Urban and Social Studies, RMIT University

About the Clean Air and Urban Landscapes Hub
The Clean Air and Urban Landscapes (CAUL) Hub is funded by the Australian Government’s
National Environmental Science Program. The mission of the CAUL Hub is to take a
comprehensive view of the sustainability and liveability of cities with a focus on practical
research outcomes, and to promote Indigenous perspectives in urban environments. This
includes research on air quality, urban greening, liveability and biodiversity, with a focus on
practical implementation of research findings, public engagement and participation by
Indigenous Australians. The CAUL Hub is a consortium of four universities: The University of
Melbourne, RMIT University, the University of Western Australia and the University of
Wollongong.
www.nespurban.edu.au

Acknowledgements

We acknowledge the Traditional Owners of the lands and waters where this research took place,
all around Australia, and pay our respects to Elders past and present. We acknowledge that all
cities in Australia were built on Indigenous land, and that this land was never ceded.

This research was conducted in collaboration with the Threatened Species Recovery Hub of the
National Environmental Science Program. We thank David Westcott (CSIRO) for providing data
from the National Flying Fox Monitoring Program. We thank Qiaoyun Xie and Alfredo Huete
(University of Technology Sydney) for providing data and advice relating to the Australian
Phenology Product developed for TERN.

Please cite this document as

Elliot-Kerr S, Lentini PE, Wintle B, Soanes K (2021) Investigating the influence of phenological
patterns on influxes of flying-foxes in urban environments. Report prepared by the Clean Air
and Urban Landscapes Hub and Threatened Species Recovery Hub. The University of
Melbourne.

The Clean Air and Urban Landscapes Hub is funded by the Australian Government's National
Environmental Science Program
Executive summary
  •   Flying-fox influxes – mass and sudden gatherings of flying-foxes at a roosting site – are often
      unanticipated and poorly understood. While short-lived, influxes numbering tens of
      thousands of flying-foxes cause significant community concern when they occur within an
      urban environment.

  •   Anecdotally, influxes often occur during mass flowering events that provide a sudden and
      abundant food resource. However, information on flowering events is sparse and difficult to
      collect and analyse at a national scale. Remotely sensed phenological data could provide an
      alternative indicator by detecting the ‘peaks’ in phenological activity that precede flowering
      events.

  •   We investigated the potential of remotely sensed phenological data to explain patterns of
      flying-fox influxes across the east-coast of Australia. We identified ‘peak’ values extracted
      from the TERN Australian Phenology Product as a proxy of vegetation productivity (and
      specifically greenness), and thus, a potential precursor to mass flowering events. We tested
      the association between above-median peaks in the greenness of woody vegetation and the
      presence or absence of influxes in future surveys at 241 flying-fox camps.

  •   We found positive correlations between above-median peaks in vegetation greenness and
      influxes for all species (except spectacled flying-foxes). The most informative lag periods
      between the presence of a peak and the occurrence of an influx ranged from six to seventeen
      months, depending on the species of interest. The relationship was strongest for camps in
      subtropical climates, compared to tropical or temperate zones. Little red flying-foxes showed
      the clearest direct relationship between vegetation greening cycles and influxes, but peak
      greenness also has predictive potential for black and grey-headed flying-fox species.

  •   Overall, our research indicates that remotely sensed phenological data can help explain
      influxes of flying-foxes around urban areas. We suggest that future analyses interrogate this
      relationship by 1) focussing on the subtropical zone, 2) accounting for variation in the
      magnitude of productivity peaks and influxes (as opposed to presence/absence), and 3)
      incorporating other environmental factors. This would provide a more comprehensive
      understanding of how phenological patterns influence flying-fox influxes and the value of this
      method as a predictive tool to guide management

                                              Page 1
Introduction

Background
Australia’s flying-foxes, or fruit bats, face various threats and challenges across their distributions. Of
the four flying-fox species present on the mainland, two are federally listed under the Commonwealth
Environmental Protection and Biodiversity Conservation Act 1999 – the grey-headed flying-fox
(Vulnerable), and the spectacled flying-fox (Endangered).

Flying-foxes are increasingly roosting in urban environments which often leads to concern and conflict
within local communities (Currey et al. 2018, Timmiss et al. 2021). This is particularly evident when
large numbers of flying-foxes roost in ‘camps’ within dense urban areas, close to sensitive community
spaces (e.g. schools, hospitals), or affect the amenity and use of public green space.

Conflict between human residents and flying-foxes in urban areas is exacerbated by the unpredictable
and changing nature of the size of flying-fox camps and the species’ high mobility (Welbergen et al.
2020). Large numbers of flying-foxes can move to roost at a particular camp hundreds of kilometres
away, either in response to the sudden availability of a food resource nearby, or driven by disturbance
at their original campsite. This behaviour can lead to ‘influxes’ of hundreds, or hundreds of thousands
of flying-foxes spontaneously appearing at the same location. The drivers of these influxes are poorly
monitored and understood, so there is often little-to-no warning before a mass arrival of flying-foxes.

Influxes are usually temporary, with flying-foxes moving on once the local food resource is depleted.
However, fear that the situation will become permanent often drives the human residents to call on
local government to intervene through active camp management. Methods of active camp
management include creating ‘buffers’ by removing some the vegetation bordering the camp,
subsidies for measures that reduce impacts on residents, or camp dispersals (Currey et al. 2018).
Recent research suggests the effectiveness of these measures is highly variable and context-
dependent, and there is no guarantee that influxes will not occur again in future (Lentini and Soanes
2020).

Better preparing the community for these temporary influxes could help to alleviate conflict and
concern. If managers could provide residents with information on where and when influxes might
occur, then active camp management could be required less often. This in turn would result in fewer
unnecessary interventions, fewer wasted resources, and reduced community angst. With information
on why an influx may be about to occur, managers will be better prepared to address community
concerns and decide on appropriate action.

Phenological cycles of vegetation greening, flowering, and fruiting may provide insights into flying-fox
camp occupancy patterns, and anecdotal reports suggest that major influxes are associated with
mass-flowering events. Recent research also suggests that spatio-temporal patterns in food
resources, as indicated by remotely sensed data, may explain influxes of flying-foxes (e.g. Giles et al
2016). However, this effect has yet to be investigated at a national scale, as data representing
flowering events per-se have not been available. Remotely sensed data representing indices of
vegetation greenness such as NDVI could be a promising avenue, allowing for broadscale assessment
and analysis of the relationship between vegetation phenology and patterns of flying-fox influxes and
movements.

                                                  Page 2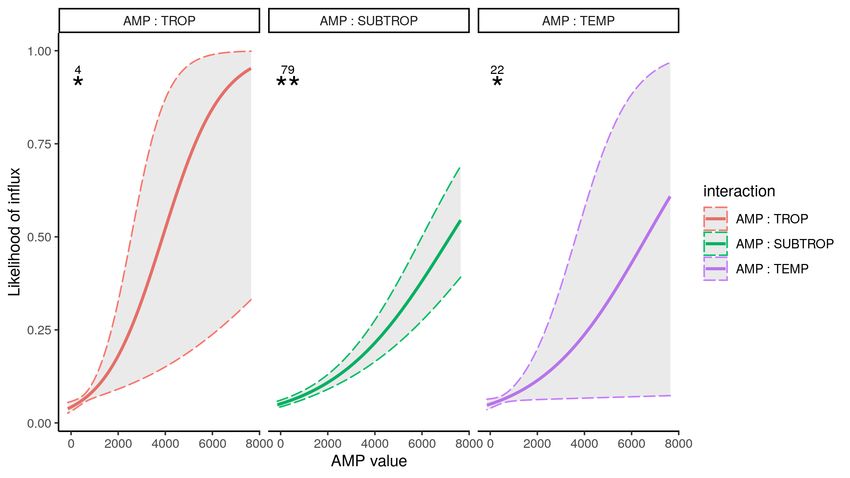
Project objective
This project investigated the degree to which remotely sensed phenological data have the potential to
predict influxes of flying-foxes in urban environments. This work will help managers and the local
community better understand the dynamics of flying-fox camps and has the potential to help predict
areas of likely future conflict. By developing a better understanding of where, when and why such
influxes occur, this project will help managers decide when they may need to intervene, and how they
can better manage the expectations of the community.
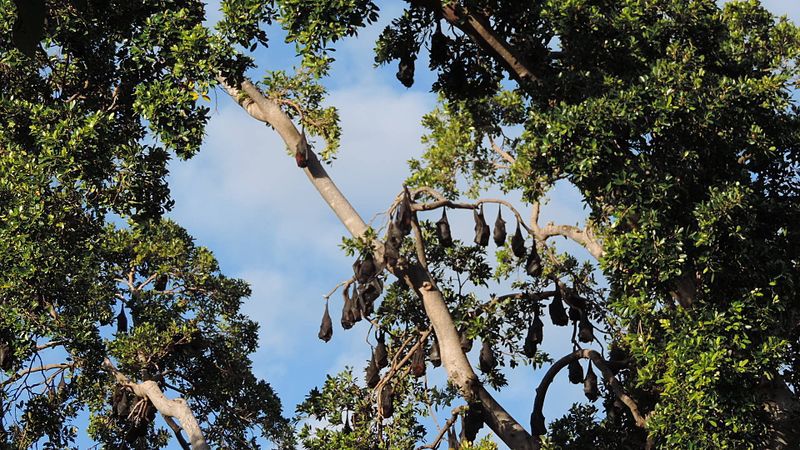
Figure 1. Flying-foxes at a roosting site. Kerry Raymond (CC BY 4.0)
Page 3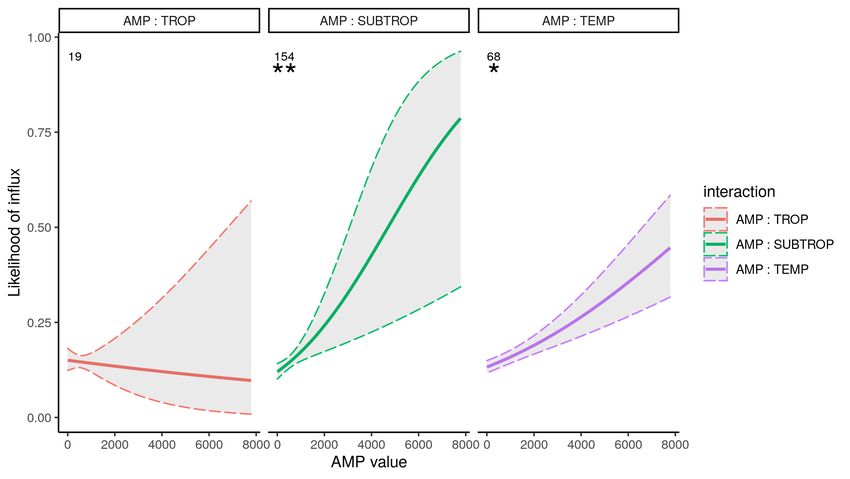
Methods

Data on flying-foxes
We used data from the National Flying-Fox Monitoring Program (CSIRO) to investigate flying-fox
influxes across the east coast of Australia. The National Flying-Fox Monitoring Program conducts
regular counts of flying-fox camps nation-wide. Camps are surveyed four times a year (February, May,
August and November), providing census estimates of flying-foxes. The program focuses on grey-
headed and spectacled flying-foxes, however little red and black flying-foxes are also counted. Given
the large number of camps (n= 456) that are monitored, not all camps are visited during every count
season. Priority camps are monitored more regularly, while others are monitored every few seasons
on a rotational basis, or in response to emerging issues. For each camp, the location (spatial
coordinates), camp name, and number of bats of each species counted in every survey is recorded.
We used data supplied by the National Flying-Fox Monitoring Program consisting of 20 count events
between November 2012 and August 2017. More information on the methods of the National Flying-
Fox Monitoring Program can be found in Westcott et al. (2011).

Classifying influxes
We determined whether each camp was experiencing an ‘influx’ of flying-foxes relative to its baseline
state. We established the baseline state for each camp as the median number of flying-foxes counted
across all surveys. A camp was classified as having an influx of flying-foxes if the number of individuals
observed during a survey represented an increase of 200% or greater above the median camp size
(Figure 2). Each survey at a given camp was classified based on a binary ‘absence’ (0) or ‘presence’ (1)
of influx. This was done for each species separately and for all species pooled (i.e. total camp size,
regardless of different species). We only included camps where ten or more surveys had been
conducted (n= 241 camps and 3698 surveys) to ensure good discrimination between baseline
numbers and influx events at a given camp.

Phenological data
The Australian Phenology Product is a national dataset made available by the Terrestrial Ecosystem
Restoration Network (TERN) (Broich et al. 2014, Broich et al. 2015). It is a measure of ‘land surface
phenology’ detected via remote-sensing, as opposed to a measure of ‘vegetation phenology’ that
would be obtained through on-ground observations. The Australian Phenology Product uses the
satellite-derived MODIS Enhanced Vegetation Index (MODIS 131C) and an algorithm that is calibrated
for Australia’s unique climatic conditions to generate phenological cycles that represent the growth
and development of vegetation. Key metrics include the start and end of each growing season,
maximum (peak) and minimum values within a growing season, amplitude and length of the growing
season, and inter-annual variation (Figure 3). The dataset is available from 2000 to 2018 at a
resolution of 500m by 500m.

                                                 Page 4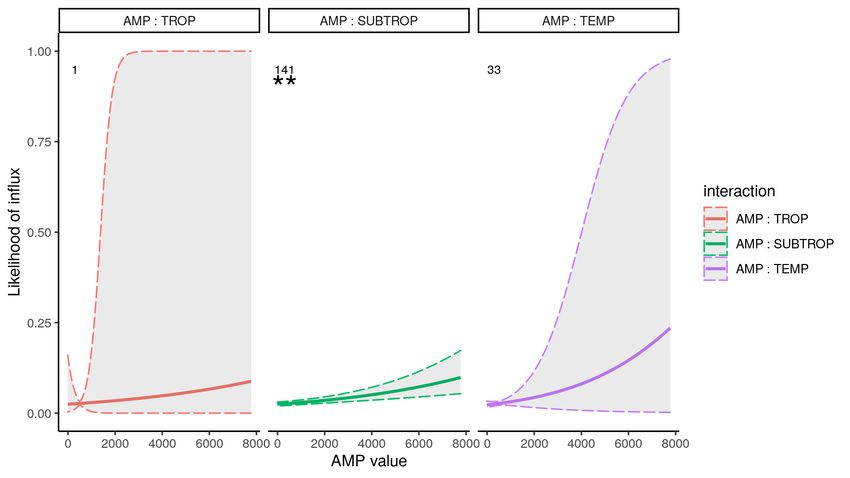
40000
                   35000
                   30000

                   25000
Flying-fox count

                   20000
                                                                                                                                                                                                  200%
                   15000

                   10000
                                                                                                                                                                                                  Median
                   5000
                      0
                           Nov-12
                                    Feb-13

                                                               Nov-13
                                                                        Feb-14

                                                                                                   Nov-14
                                                                                                            Feb-15

                                                                                                                                       Nov-15
                                                                                                                                                Feb-16

                                                                                                                                                                           Nov-16
                                                                                                                                                                                    Feb-17
                                             May-13
                                                      Aug-13

                                                                                 May-14
                                                                                          Aug-14

                                                                                                                     May-15
                                                                                                                              Aug-15

                                                                                                                                                         May-16
                                                                                                                                                                  Aug-16

                                                                                                                                                                                             May-17
                                                                                                                                                                                                      Aug-17
                                                                                                            Survey

Figure 2. Example of influxes identified from counts. A baseline level was established by calculating the median
number of flying-foxes observed during counts. All counts that represented a 200% increase above the median
value were considered ‘influxes’, as indicated by the red circles.

Figure 3. Example of a phenological curve derived for a single camp from 2000 to 2015. Peaks in productivity are
shown by red dots.

                                                                                                   Page 5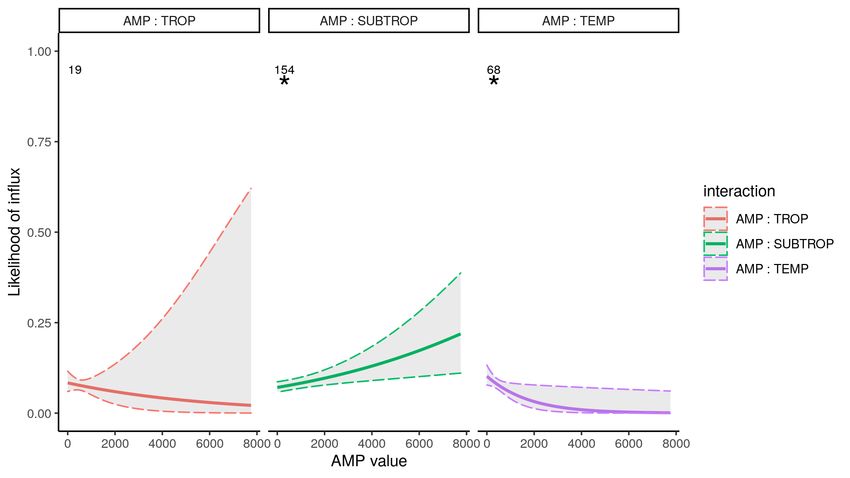
Identifying peaks in vegetation productivity
We were particularly interested in the size and timing of peak values from the Australian Phenology
Product. These represent peaks in vegetation greenness that typically occur within the ‘growing
season’ and are followed by a period of low growth and reproduction. In plant species that provide
foraging resources to flying-foxes, such as Eucalypts, the size and timing of peak values could
therefore provide a proxy of future flowering.
The Australian Phenology Product covers all classes of vegetation, including grasses, Australia-wide.
As we were only interested in vegetation which flying-foxes are known to feed on (i.e. trees and
shrubs), we only considered vegetation classified as “Woody vegetation (forest)” or “Sparse woody
vegetation” in the National Forest and Sparse Woody Vegetation Data set (Version 3, 2018 Release,
DoE 2018). We then created a 50km buffer around each camp to represent the plausible foraging
resources that were most likely to affect influxes at that location (Figure 4). We extracted values on
the timing and intensity of peaks for all wooded cells within each buffer (n=241 camps).
Mass flowering events (such as those that are attractive to flying-foxes) are thought to be preceded
by periods of abnormally high vegetation productivity, which can be detected as unusually large peak
values within the growing season. To identify these events, we first established a baseline level that
reflected the typical peak of a growing season within the woody vegetation surrounding each camp.
This was calculated by taking the median value of peaks observed across all cells and years for the
woody vegetation within each camp buffer. We classified peak values that were >25% greater than
the median as an ‘above median’ peak. For each buffer, at each point in time, we calculated the
number of cells that were experiencing an above median peak and called this count of cells the
“Above-Median Peaks” (AMP) value. In this way, the larger the AMP value, the larger the area of
woody vegetation surrounding a camp that experienced abnormally high productivity, and the larger
the area of foraging habitat we would expect to become available to flying-foxes if this high
productivity results in a mass-flowering event.
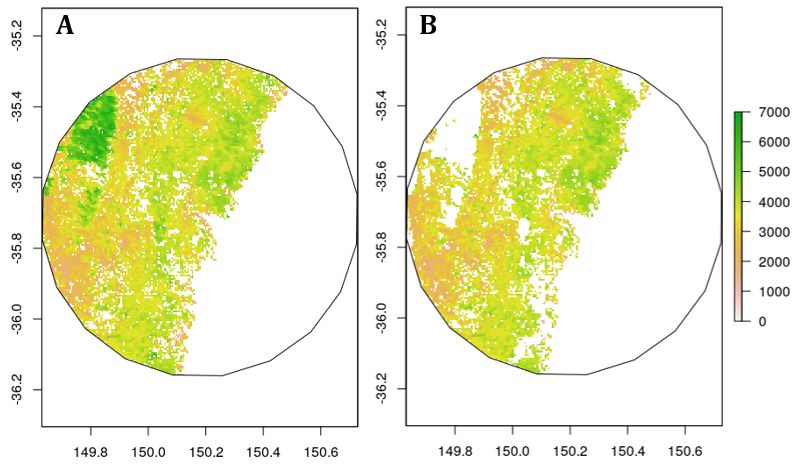
Figure 4. Example of peak phenology values extracted from a 50km buffer surrounding the Bateman’s Bay
Water Garden camp in 2016. The panel on the left (A) includes all vegetation types, while the panel on the right
(B) is restricted to woody vegetation that is likely to be a foraging resource for flying-foxes. The median peak
value across all years for this camp is 3436 therefor cells above 4295 (n= 2333 in B) classify as “above median
peaks”
Page 6Establishing a time-lag
The Australian Phenology Product, and our measure of AMP, do not directly measure flowering but
instead indicate vegetation productivity patterns that typically precede flowering. There is therefore
an expected ‘time-lag’ between the observed AMP and the response of flying-foxes to a possible
flowering event. In the absence of prior information on the most appropriate time-lag, we
investigated a range of plausible, three-month windows within six to seventeen months prior to a
flying-fox survey. We extracted the AMP values at each time-lag period, then related these to the
recorded flying-fox influx data for every survey using linear regression models. The F-statistic was
used to determine which three-month window correlated most strongly with the presence/absence
of flying-fox influxes both for all species pooled, and each species separately. The best-fitting time-lag
between peak vegetation greenness (AMP) and recorded influxes at a camp differed for each flying-
fox species (Table 1). We used the AMP values for the best window for the further analysis of each
species.
Table 1. Summary of the datasets for each species individually and pooled, including the number of camps at
which the species was detected, the number of surveys that the species was detected in, the number of surveys
that classified as an influx, and the percentage of surveys during which the species was classified as being in
influx. The best-fitting time-lag between peak vegetation greenness (AMP) and recorded influxes at a camp
differed for each flying-fox species
No. Time
Species No. surveys No. influx Influx %
camps lag
Pooled
241 3698 468 12.7 9–11 months
flying-fox
Little red
105 1680 131 7.8 9–11 months
flying-fox
Grey-headed
241 3686 309 8.4 15–17 months
flying-fox
Black
175 2721 159 5.8 9–11 months
flying-fox
Spectacled
32 490 67 13.7 6–8 months
flying-fox
Page 7Other covariates
Since flying-fox camps span a vast latitudinal gradient encompassing different environmental
conditions and ecological communities, we expected that the relationship between the occurrence of
influxes and AMP could vary across different vegetation types and climatic regions. To account for
these differences, we included the Kӧppen climate classification for each camp as an interaction
covariate in the model structure. The Kӧppen system classifies areas by the dominate native
vegetation type and the historical amount of rainfall and humidity (Bureau of Meteorology 2014).
Across the camps that were used in our analyses, there were three major classes and eight minor sub-
classes. Four of these minor sub-classes contained fewer than ten camps so they did not have
sufficient survey data (statistical power) to make meaningful inferences. Instead, we combined the
classes into the three major climate regions: tropical, subtropical, and temperate (containing 19, 154
and 68 camps respectively).
Figure 5. The location of the 241 flying-fox camps included in our analysis across each of the three Kӧppen (KPN)
classes (tropical, subtropical, temperate).
Page 8Analysis
GLMM
We analysed the relationship between the presence (1) or absence (0) of influxes for every flying-fox
survey, and the AMP value from the relevant preceding time-lag period using a binomial generalised
linear mixed-effects model structure. We also fitted an interaction term between the Kӧppen climate
class and AMP, incorporated a corCompSym correlation structure to account for temporal correlation
between consecutive survey periods, and fitted the camp identity as having a random effect on the
intercept
Dynamic occupancy model
We initially intended to use a dynamic occupancy model structure to analyse our data, as we believed
it would be an appropriate way to investigate the spatio-temporal dynamics of flying-fox influxes at a
national scale. However, after further investigation we established that the rare and fleeting nature of
influxes violates the dynamic occupancy model assumption of species persistence (the continuation of
a species presence at a site). Although flying-foxes often persisted throughout time at camps, the
“presence” (influx) classification of our data for the model only indicated abnormally high numbers of
flying-foxes, which were, by definition, rare events. This makes dynamic occupancy modelling
structures unsuitable for predictions of such rare occurrences.
Page 9Results and discussion
Occurrence of flying-fox influxes
The influx of flying-foxes to roost sites commonly occurs across the east coast of Australia. We
identified 468 influx events and found that 69% (n= 167) of the 241 camps used in our analyses
experienced at least one influx during the five-year study period (2012–2017). Individual camps
experienced between 0 and 7 influxes with 26 camps (11% of the total) experiencing five or more
influxes. Less than a third (31% or 74 camps) did not experience an influx during the surveyed period.
In many cases, these influxes represented a greater than ten-fold increase in flying-fox numbers (131
camps). The largest number of flying-foxes recorded during an influx (pooled across all species) was
506,000 individuals, and more than 100,000 individuals were recorded during individual surveys at 19
camps.
All four species of flying-fox contributed to influxes, though grey-headed flying-foxes and black flying-
foxes were the most common. The species associated with the greatest number of influxes at
different camps was the grey-headed flying-fox, with 309 individual influx events (8% of all surveys
were influx events) across 241 unique camps. It is important to reiterate that the National Flying-fox
Monitoring Program specifically targets camps likely to support grey-headed and spectacled flying-
foxes (Westcott et al. 2011) and so our findings do not represent a comprehensive assessment of
influxes for black and little red flying-foxes.
Relationship between phenology and flying-fox influxes
General comments
Our derived “Above-Median Peaks” (AMP) metric showed a statistically significant relationship with
the likelihood of influx for all species in at least one of the three climate zones (see Figures 6–10,
Table 2).
The p-values for all models are provided to indicate the statistical significance of the observed
relationship between AMP and influxes, with smaller p-values suggesting that this relationship is less
likely due to random chance, i.e., that flying-foxes are indeed responding to the phenological
patterns. All species had the strongest predictive relationships in the subtropical climate zone
compared to the temperate and tropical zones. Our models indicated that the AMP-influx relationship
was positive and significant in all cases except for spectacled flying-foxes (Figure 10) and grey-headed
flying-foxes in tropical climates (Figure 8). Hence, we can infer that relatively greater peaks of
vegetation greenness (larger AMP values) increase the likelihood of influxes occurring in subsequent
months.
The slopes (beta coefficients) of the relationships indicate how strongly AMP affected the likelihood
of influx, and these varied between species and climate zones. Little red flying-foxes were the only
species that showed a significant response to AMP in the tropical zone (Figure 7). The lack of
significant relationships for other species could be due a number of causes; low statistical power
(fewer survey records to distinguish the true pattern) as a result of there being fewer camps
monitored in the tropical zone (19 of 241 camps, Appendix Table 1); patterns in species migrations
and nomadic movements (if species spend less time in tropical areas they have less opportunity to
respond to AMP); or the fact that the relationships between vegetation phenology (cycles of greening,
flowering and fruiting) and flying-fox movements and occupancy patterns are fundamentally different
in tropical areas, so the AMP metric does not adequately capture these patterns.
Page 10Standard error values also ranged in size, and there is higher uncertainty in the strength (slope) of the
relationship for model parameters with larger standard errors (or wider 95% confidence intervals).
We only tested AMP and Kӧppen climate classes as predictor variables, but there could be other
important ecological or abiotic factors that could be added to the models which would allow for more
accurate influx predictions (see below for further discussion).
Table 2. Details of the modelled AMP and likelihood of influx relationships, for all species and climate regions.
The beta coefficient describes the slope of the line, and the standard error (shown in parenthesis) describes the
uncertainty around the slope estimates. The p-value for each relationship provides information about the
likelihood of the observed pattern between AMP and influx being related to chance. Values greater than 0.05
are generally considered “not significant”. “Significant” relationships (p-value < 0.05) are highlighted with a
single asterisk and strongly significant relationships (< 0.001) are shown with two.
Tropical Subtropical Temperate
Species beta (se) p-value beta (se) p-value beta (se) p-value
Pooled
-0.06 (0.17) 0.72 0.2 (0.07) > 0.001 ** 0.4 (0.13) 0.002 *
flying-fox
Little red
0.91 (0.30) 0.003 * 0.46 (0.05) > 0.001 * 0.5 (0.24) 0.04 *
flying-fox
Grey-headed
-0.17 (0.28) 0.54 0.15 (0.05) 0.003 * -0.57 (0.27) 0.03 *
flying-fox
Black
0.17 (1.93) 0.93 0.18 (0.04) > 0.001 * 0.32 (0.34) 0.34
flying-fox
Spectacled
-0.22 (0.21) 0.29 -0.67 (0.26) 0.01 * n/a n/a
flying-fox
Page 11All species pooled models
When the survey data for all species were pooled, above-median peaks in vegetation greenness
(AMP) were positively associated with the occurrence of influxes in subtropical and temperate
regions. These relationships were statistically significant and indicate that flying-foxes tend to influx
nine to eleven months following periods of high AMP (or the ecological conditions that the metric
captures) in both these climate zones (Table 2). In the tropical zone, the combination of wide
confidence intervals and a p-value >0.05 suggests that there is no clear relationship between AMP
and influxes (Figure 6).
Pooling the species, as we have for these models, is useful because the public do not tend to
discriminate between flying-fox species, particularly when an influx is occurring. 89% of the camps
included in our analysis supported multiple species during at least one survey count, though not all
species will equally contribute to what the public perceives to be an influx event. While the pooled
data provide useful insights for management of public responses, differences in the movement
patterns and feeding behaviours of each species could drive different responses to phenological
patterns and warrant closer inspection.
All species pooled
Figure 6. Response curves showing the relationship between our derived Above-Median Peaks (AMP) phenology
metric (x-axis) and likelihood of a flying fox influx, pooled across all four mainland species (y-axis) for each of the
three Kӧppen classes (tropical, subtropical and temperate respectively, indicated by the different colours). Each
‘pooled’ data point is the sum of the individual species counts at a given survey location and time. A single
asterisk (*) indicates a p-value < 0.05 between the model and a null model and the double asterisk (**) indicates
a p-value < 0.001. 95% confidence intervals are shaded in grey, between the dashed lines. Numbers indicate
number of camps within each region.
Page 12Little red flying-fox
Little red flying-foxes had the strongest response to AMP of any species (Figure 7, Table 2). AMP 9–11
months prior to the surveys positively correlated with the likelihood of a little red flying-fox influx
across all three climate zones. The subtropical climate zone has a p-value > 0.001 and small 95%
confidence intervals (Figure 7) which indicate a particularly robust statistical relationship. The larger
confidence intervals in temperate and tropical zones suggest that other factors not considered here
affect the likelihood of influxes in addition to AMP. These could include changes to habitats elsewhere
in the landscape, such as losses due to clearing, fire, or disturbances at other roosting sites. Little red
flying-foxes are the most widely distributed of the mainland flying-foxes, occupying camps not only
across the east coast of Australia but also across the northern and western coasts, and they venture
farther inland than any of the other species. They are also thought to be the most nomadic and can
respond rapidly in very large numbers to the sudden availability of resources, forming densely-packed
camps (Churchill 1998). Given these factors, it is perhaps unsurprising that they responded strongly to
the phenology data used here, but also that there are other factors at play in parts of their range not
featured in this analysis that could be better accounted for. Incorporating additional covariates may
provide better predictive power
Little red flying-fox
Figure 7. The response curves showing the relationship between AMP (x-axis) and likelihood of a little red flying
fox influx (y-axis) for each Kӧppen class- tropical, subtropical and temperate respectively (indicated by the
different colours). The single asterisk (*) indicates a p-value < 0.05 between the model and a null model and the
double asterisk (**) indicates a p-value < 0.001. 95% confidence intervals are shaded in grey, between the
dashed lines. Numbers indicate number of camps within each region.
Page 13Grey-headed flying fox
There was a significant positive relationship between AMP values fifteen to seventeen months prior
to grey-headed flying-fox influx events in the subtropical and temperate zones. However, compared
to species such as the little red flying-fox, the slopes of these relationships were not as strong (as
evidenced by smaller beta values; Table 2). These weaker relationships for grey-headed flying-foxes
may reflect their fairly consistent migratory behaviour, as they are known to occupy the more
northern parts of their range in greater numbers during winter, then move south in spring and
summer to give birth and raise their young. In this way, the predictive potential of AMP alone could
be reduced because the current model structure does not account for movement behaviours – i.e.
there are likely fewer individuals to respond to a flowering event and create an influx in the southern
portions of their range in winter (or, conversely, in northern parts of their range during summer).
Grey-headed flying-foxes also demonstrate high dietary flexibility, feeding on the nectar, blossom,
fruits and occasionally foliage of over 170 plant species (e.g. Eby 1998, Eby and Law 2008, Parry-Jones
et al. 1991), and are the most temperate of the species, with their range coinciding with the east
coast capital cities and major metropolitan areas. Hence, their movements may be driven to a greater
extent by urban food resources that are not adequately captured by the phenology measures used
here than other species. The presence of flying-foxes in cities is often linked to the presence of
constant and varied food sources in urban habitats (McDonald-Madden et al. 2005, Williams et al.
2006). Influxes may also be influenced by the absence of resources elsewhere in the landscape, or
disturbances and habitat destruction at other roost locations which were not accounted for in this
model.
Grey-headed flying-fox
Figure 8. The response curves showing the relationship between AMP (x-axis) and likelihood of a grey-headed
flying fox (GHFF) influx (y-axis) for each Kӧppen class- tropical, subtropical and temperate respectively (indicated
by the different colours). The asterisk (*) indicates a p-value < 0.05 between the model and a null model. 95%
confidence intervals are shaded in grey, between the dashed lines. Numbers indicate number of camps within
each region.
Page 14Black flying-fox
Black flying-fox influxes were positively correlated with the AMP measures taken from the period nine
to eleven months prior to the surveys in subtropical and temperate climate zones. In subtropical
areas in particular, the relationship was strongly statistically significant, indicating that AMP is a good
predictor of influxes in these areas. The black flying-fox is predominantly a tropical and subtropical
species whose distribution also stretches coastally across the Northern Territory and into Western
Australia, so as with the little red flying-fox there are substantial portions of its range not being
accounted for in our analysis. Like the grey-headed flying-fox they are also capable of feeding from a
wide range of plant species, including blossom, nectar, fruits and leaves, and are known to readily use
resources in urban areas (Markus and Hall 2004, Palmer et al 2000).
Black flying-fox
Figure 9. The response curves showing the relationship between AMP (x-axis) and likelihood of a black flying fox
(BFF) influx (y-axis) for each Kӧppen class- tropical, subtropical and temperate respectively (indicated by the
different colours). The single asterisk (*) indicates a p-value < 0.05 between the model and a null model. 95%
confidence intervals are shaded in grey, between the dashed lines. Numbers indicate number of camps within
each region.
Page 15Spectacled flying-fox
Spectacled flying-foxes have the most restricted distribution of the mainland species and only occur in
tropical and subtropical camps. For this species, AMP values six to eight months prior to the surveys
were negatively correlated with a likelihood of an influx (i.e., the opposite of what was observed for
the other species), though these relationships were comparatively weak and only significant in the
subtropical zone. Unlike the other three species of flying-fox studied here, which primarily feed on
nectar and pollen, spectacled flying-foxes have a more frugivorous diet and in turn are more
dependent on fleshy rainforest fruits (Churchill 1998, Richards 1990, Parsons et al. 2006). The AMP
metric may be more useful in predicting subsequent nectar and pollen production in subtropical plant
species, rather than tropical fruits which rely not only on environmental cues such as rainfall but also
the abundance and activity of animal pollinators. Given these findings, we do not recommend that
AMP be used to predict influx behaviour in spectacled flying-foxes.
Spectacled flying-fox
Figure 10. The response curves showing the relationship between AMP (x-axis) and likelihood of a spectacled
flying fox (SFF) influx (y-axis) for each Kӧppen climate class (indicated by the red and green colours as tropical
and subtropical respectively) . The single asterisk (*) indicates a p-value < 0.05 between the model and a null
model. 95% confidence intervals are shaded in grey, between the dashed lines. Numbers indicate number of
camps within each region.
Page 16Study limitations
In addition to the factors discussed above relating to the ecology and distribution of the individual
species, a key limitation of our dataset is that each flying-fox count provides a brief snapshot in time
(once every three months). Many influxes and fluctuations in camp size will occur outside the
observation window, and thus we have only a partial understanding of camp dynamics. While many
camps have additional, more regular count data, these are disparate across state and local
government organisations and can be difficult to access and standardise. Sourcing and incorporating
locally collected camp data for each individual camp at a national scale was beyond the scope of this
study, but may prove useful for more targeted, regional-scale investigations.
Further, we did not directly measure flowering events. While our measure of AMP is an indicator of
the conditions that are required to precede future flowering events, peaks in productivity do not
necessarily lead to pollen production and nectar flow. Furthermore, the data do not distinguish
between plant species, and so treat all phenological peaks in woody vegetation as equally likely to
provide foraging resources to flying-foxes. In reality this is not the case – some species provide higher-
quality and quantities of pollen, nectar, and fruits, while the areas surrounding some of the camps in
our data set may support relatively unproductive or inedible species (Eby and Law 2008). Hence,
exploring methods that restrict the analyses to key foraging species for flying-foxes would be useful in
further refining the patterns revealed here.
Page 17Conclusion and future directions
• Our analyses suggest that remotely sensed phenological patterns can partially explain the
occurrence of flying-fox influxes. Peaks in phenological activity within 50km of a camp often
preceded influxes of little red, grey-headed and black flying-foxes, though this pattern was
not observed for spectacled flying-foxes. The relationship was strongest in the subtropical
zones – this corresponds to regions of south-east Queensland and northern New South Wales
that have a high concentration of flying-fox camps in urban areas and are often subject to
community conflict.
• Phenology alone is not the only factor influencing influxes – 27% of the influx events (based
on pooled specie counts) occurred when AMP was very low. Other important factors to
consider include habitat loss or disturbance in other parts of the species’ ranges, including
fire, land clearing, active management at camps, or heat-stress events. Incorporating these
factors into future analyses may improve our understanding of the drivers of flying-fox
influxes.
• We identify two priorities for future investigation of remotely sensed phenology data as a
management-relevant indicator of flying-fox influxes:
1. Conducting comparable analyses at smaller, regional scales in partnership with
management groups that conduct flying-fox surveys more frequently and thus have
higher-resolution influx data. Focusing on the subtropical zone, in which phenological
patterns appeared to have the strongest influence and high management-relevance
would be a useful next step.
2. Conducting more sophisticated analyses that account for the magnitude of the
influxes and greenness peaks rather than reducing the data to a presence-absence
framework. One possible avenue for this could be to investigate rare-event models
that can appropriately consider spatio-temporal fluctuations and the effect of
distance.
• We note that the Australian Phenology Product currently extends to 2018. For such data to
form an ‘early-warning’ system capable of guiding managers, the support to generate this
resource would need to be ongoing and the data provided in a timely manner.
• Given the potential importance of mass flowering events to flying-fox influxes, a more precise
understanding of when and where these events occur and how they might be predicted is
critical. However, information on the association between mass flowering events and flying-
fox influxes is largely anecdotal. Systematic collection of real-world data on the location and
timing of mass flowering events, particularly those that occur in or near urban environments,
would be valuable to validate remotely sensed data and could be included in future analyses.
• Further, information on the foraging habits of flying-foxes in urban environments would shed
light on the degree to which they are influenced by broadscale phenological patterns
compared with the novel and more stable food resources available within urban cities and
towns. Such research is currently underway, including through citizen science platforms such
as the CAUL Urban Wildlife App.
Page 18References
Broich, M., Huete, A., Tulbure, M.G., Ma, X., Xin, Q., Paget, M., Restrepo-Coupe, N., Davies, K.,
Devadas, R. and Held, A. (2014). Land surface phenological response to decadal climate variability
across Australia using satellite remote sensing. Biogeosciences, 11, p.5181-5198.
Broich, M., Huete, A., Paget, M., Ma, X., Tulbure, M., Coupe, N.R., Evans, B., Beringer, J., Devadas, R.,
Davies, K. and Held, A. (2015). A spatially explicit land surface phenology data product for science,
monitoring and natural resources management applications. Environmental Modelling &
Software, 64, p.191-204.
Bureau of Meteorology (2014) Key Climate groups of the objective classification of Australian
Climates using Kӧppen's scheme. Bioregional Assessment Source Dataset.
http://www.bom.gov.au/climate/averages/climatology/gridded-data-
info/metadata/md_koppen_classification.shtml
Churchill, S., 1998. Australian bats. New Holland.
Currey, K., Kendal, D., Van der Ree, R. and Lentini, P.E., 2018. Land manager perspectives on conflict
mitigation strategies for urban flying-fox camps. Diversity, 10, p.39.
Department of the Environment and Energy (2018). National forest and sparse woody vegetation
data. Version 3.0. Commonwealth of Australia, Canberra. https://data.gov.au/data/dataset/national-
forest-and-sparse-woody-vegetation-data-version-3-2018-release/resource/bf7420cc-2ec7-470d-
87ba-f0a2c0ea1b60
Eby, P. (1998) An analysis of diet specialization in frugivorous Pteropus poliocephalus
(Megachiroptera) in Australian subtropical rainforest. Australian Journal of Ecology, 23, p.443–456.
Eby, P. and Law, B. S. (2008) Ranking the feeding habitats of Grey-headed flying foxes for
conservation management. Department of Environment and Climate Change (NSW), Sydney South.
Giles, J. R., Plowright, R. K., Eby, P., Peel, A. J., and McCallum, H. (2016). Models of Eucalypt
phenology predict bat population flux. Ecology and Evolution, 6, p.7230-7245.
Lentini, P.E. and Soanes, K. (2020) The effectiveness of approaches to urban flying-fox roost
management: Research findings factsheet. Threatened Species Recovery Hub, National
Environmental Science Program. https://www.nespthreatenedspecies.edu.au/media/i23lzhnu/6-3-
3-urban-flying-foxes-findings-factsheet-web.pdf
Markus, N., Hall, L. (2004) Foraging behaviour of the black flying-fox (Pteropus alecto) in the urban
landscape of Brisbane, Queensland. Wildlife Research, 31, p.345–355.
McDonald-Madden, E., Schreiber, E. S. G., Forsyth, D. M., Choquenot, D., and Clancy, T. F. (2005).
Factors affecting Grey-headed Flying-fox (Pteropus poliocephalus: Pteropodidae) foraging in the
Melbourne metropolitan area, Australia. Austral Ecology, 30, p.600-608.
Parry-Jones, K. A., Augee, M. L. (1991) The diet of Flying-foxes in the Sydney and Gosford areas of
New South Wales, based on sighting reports 1986-1990. Australian Zoologist.
Page 19Parsons, J. G., Cairns, A., Johnson, C. N., Robson, S. K. A., Shilton, L. A., Westcott, D. A. (2006) Dietary
variation in spectacled flying foxes (Pteropus conspicillatus) of the Australian Wet Tropics. Australian
Journal of Zoology, 54, p.417.
Palmer, C., Price, O., Bach, C. (2000) Foraging ecology of the black flying fox (Pteropus alecto) in the
seasonal tropics of the Northern Territory, Australia. Wildlife Research, 27, p.169.
Richards, G. C. (1990) The spectacled flying fox, Pteropus conspicillatus (Chiroptera: Pteropodidae),
in north Queensland. 2. Diet, seed dispersal and feeding ecology. Australian Mammalogy, 13, p.25–
32.
Timmiss, L.A., Martin, J.M., Murray, N.J., Welbergen, J.A., Westcott, D., McKeown, A. and Kingsford,
R.T. (2021). Threatened but not conserved: flying-fox roosting and foraging habitat in
Australia. Australian Journal of Zoology.
Welbergen, J.A., Meade, J., Field, H.E., Edson, D., McMichael, L., Shoo, L.P., Praszczalek, J., Smith, C.
and Martin, J.M. (2020). Extreme mobility of the world’s largest flying mammals creates key
challenges for management and conservation. BMC biology, 18, p.1-13.
Westcott, D. A., McKeown, A., Murphy, H. T., & Fletcher, C. S. (2011). A monitoring method for the
grey-headed flying-fox, Pteropus poliocephalus. Atherton: CSIRO published Guidelines.
Williams, N. D. G., Mcdonnell, M. J., Phelan, G. K., Keim, L. D., Van der Ree, R. (2006) Range
expansion due to urbanization: Increased food resources attract Grey-headed Flying-foxes (Pteropus
poliocephalus) to Melbourne. Austral Ecology, 31, p.190–198.
Page 20Appendix
Table A1. Summary of all 241 camps from the National Flying Fox Survey that conducted ten or more surveys
and were included in our analysis. The minimum, median and maximum count numbers provided reflect pooled
values for all species observed at a given camp. Camp ID is the unique number assigned to each camp.
Camp No. No. Min. Median Max. KPN
LGA
ID surveys influx count count count class
1 Adelaide (C) 20 2 470 2803 10075 Temperate
650 Albury (C) 16 0 0 0 1700 Temperate
33 Auburn (C) 17 0 450 3030 6360 Temperate
55 Ballina (A) 20 2 32 1095 7250 Subtropical
246 Ballina (A) 19 3 0 543 5800 Subtropical
11 Bega Valley (A) 12 0 1590 12452 29662 Temperate
10 Bellingen (A) 20 0 0 15018.5 42932 Temperate
126 Bellingen (A) 19 0 0 0 105 Temperate
623 Bellingen (A) 15 0 0 0 1650 Temperate
624 Bellingen (A) 17 0 0 0 50 Temperate
629 Bellingen (A) 18 2 0 675 3655 Temperate
783 Bellingen (A) 14 3 0 0 53364 Temperate
626 Blacktown (C) 17 3 0 800 6800 Temperate
106 Boroondara (C) 20 0 7050 15330 34795 Temperate
151 Brisbane (C) 15 3 0 1150 6000 Subtropical
159 Brisbane (C) 15 3 0 1077 32000 Subtropical
339 Brisbane (C) 11 5 410 1000 30000 Subtropical
341 Brisbane (C) 10 0 350 5000 9000 Subtropical
384 Brisbane (C) 10 0 0 100 200 Subtropical
400 Brisbane (C) 16 2 1000 3575 21100 Subtropical
531 Brisbane (C) 12 0 0 120 350 Subtropical
575 Brisbane (C) 15 2 0 600 8450 Subtropical
584 Brisbane (C) 12 0 400 1500 2300 Subtropical
744 Brisbane (C) 13 2 0 300 30400 Subtropical
279 Bundaberg (R) 14 3 0 0 63200 Subtropical
293 Bundaberg (R) 10 0 0 6500 15640 Subtropical
299 Bundaberg (R) 20 3 0 0 15000 Subtropical
359 Bundaberg (R) 14 6 0 0 7200 Subtropical
585 Bundaberg (R) 15 2 0 0 229000 Subtropical
712 Bundaberg (R) 14 5 0 0 8000 Subtropical
746 Bundaberg (R) 12 0 0 0 1100 Subtropical
59 Byron (A) 12 2 0 187.5 6000 Subtropical
77 Byron (A) 13 0 0 0 160 Subtropical
494 Byron (A) 12 0 0 242.5 1350 Subtropical
524 Byron (A) 16 0 0 798 2088 Subtropical
Page 21Camp No. No. Min. Median Max. KPN
LGA
ID surveys influx count count count class
525 Byron (A) 16 0 0 104.5 480 Subtropical
527 Byron (A) 17 2 0 2010 12899 Subtropical
653 Cairns (R) 18 0 0 0 1000 Tropical
658 Cairns (R) 20 0 1600 5970 16000 Tropical
661 Cairns (R) 16 0 0 0 390 Tropical
662 Cairns (R) 15 2 0 0 20000 Tropical
663 Cairns (R) 12 3 0 0 5000 Tropical
666 Cairns (R) 19 3 0 0 13000 Subtropical
674 Cairns (R) 19 3 0 3800 16000 Subtropical
675 Cairns (R) 13 2 0 0 26173 Tropical
693 Cairns (R) 19 4 0 10800 74533 Tropical
694 Cairns (R) 14 3 0 0 21600 Tropical
695 Cairns (R) 12 0 0 0 1000 Tropical
702 Cairns (R) 17 4 0 0 34000 Tropical
792 Cairns (R) 12 0 0 0 250 Tropical
793 Cairns (R) 14 1 1000 5075 108000 Tropical
811 Cairns (R) 13 4 0 0 12200 Tropical
812 Cairns (R) 12 0 0 190 700 Tropical
813 Cairns (R) 12 1 0 13050 51000 Subtropical
821 Cairns (R) 11 1 0 0 6300 Tropical
822 Cairns (R) 14 4 0 1400 8700 Subtropical
28 Campbelltown (C) 14 0 444 1360.5 3299 Temperate
60 Campbelltown (C) 20 1 550 3910 17000 Temperate
34 Casey (C) 13 0 1200 3000 9000 Temperate
660 Cassowary Coast (R) 15 0 0 0 1460 Tropical
677 Cassowary Coast (R) 19 3 0 0 15000 Tropical
679 Cassowary Coast (R) 12 4 0 0 6000 Tropical
692 Cassowary Coast (R) 16 2 0 88 9400 Subtropical
334 Cessnock (C) 19 4 0 2600 47000 Temperate
56 Clarence Valley (A) 20 4 1551 13326.5 96472 Subtropical
87 Clarence Valley (A) 18 6 0 652.5 187798 Subtropical
243 Clarence Valley (A) 16 3 0 0 8000 Subtropical
501 Clarence Valley (A) 17 6 0 825 140000 Subtropical
519 Clarence Valley (A) 18 1 0 303 5000 Subtropical
637 Clarence Valley (A) 13 0 0 0 200 Subtropical
29 Coffs Harbour (C) 10 2 0 569.5 5611 Temperate
127 Coffs Harbour (C) 18 1 0 8837.5 26835 Subtropical
631 Coffs Harbour (C) 16 4 0 3252.5 16400 Temperate
224 Dubbo (C) 10 3 0 0 20000 Temperate
521 Dungog (A) 20 5 0 375 15000 Temperate
Page 22Camp No. No. Min. Median Max. KPN
LGA
ID surveys influx count count count class
613 Dungog (A) 18 1 0 0 3600 Temperate
5 East Gippsland (S) 13 1 48 5000 60000 Temperate
24 East Gippsland (S) 12 1 900 6400 32100 Subtropical
8 Eurobodalla (A) 13 3 442 4576 40222 Temperate
190 Fraser Coast (R) 20 7 0 15500 100000 Subtropical
330 Fraser Coast (R) 19 1 0 0 5000 Subtropical
349 Fraser Coast (R) 15 3 0 2500 25000 Subtropical
391 Fraser Coast (R) 20 3 0 0 186000 Subtropical
533 Fraser Coast (R) 20 3 0 0 25000 Subtropical
534 Fraser Coast (R) 19 1 0 0 6000 Subtropical
535 Fraser Coast (R) 20 1 0 3750 33000 Subtropical
537 Fraser Coast (R) 20 0 0 0 200 Subtropical
539 Fraser Coast (R) 20 3 0 0 30000 Subtropical
580 Fraser Coast (R) 19 6 0 3000 200500 Subtropical
589 Fraser Coast (R) 18 0 0 0 1500 Subtropical
760 Fraser Coast (R) 15 1 0 0 6000 Subtropical
538 Fraser Coast (R) 20 4 0 9000 163500 Subtropical
137 Gold Coast (C) 14 1 27 305 2500 Subtropical
147 Gold Coast (C) 15 1 113 450 2070 Subtropical
296 Gold Coast (C) 13 0 0 100 1000 Subtropical
306 Gold Coast (C) 17 3 550 2600 19600 Subtropical
307 Gold Coast (C) 16 0 55 400 1000 Subtropical
325 Gold Coast (C) 16 0 1380 6250 11766 Subtropical
402 Gold Coast (C) 15 2 0 2500 12000 Subtropical
406 Gold Coast (C) 17 3 0 500 4000 Subtropical
436 Gold Coast (C) 14 1 0 257.5 7500 Subtropical
445 Gold Coast (C) 15 4 0 600 14700 Subtropical
541 Gold Coast (C) 12 0 0 0 80 Subtropical
543 Gold Coast (C) 12 1 0 15 6300 Subtropical
544 Gold Coast (C) 12 0 15 23.5 49 Subtropical
545 Gold Coast (C) 11 0 10 30 60 Subtropical
546 Gold Coast (C) 16 0 0 0 600 Subtropical
590 Gold Coast (C) 11 0 0 20 120 Subtropical
591 Gold Coast (C) 14 1 0 400 3000 Subtropical
592 Gold Coast (C) 11 1 38 150 5000 Subtropical
593 Gold Coast (C) 14 3 0 3000 14200 Subtropical
713 Gold Coast (C) 13 0 20 300 700 Subtropical
714 Gold Coast (C) 12 4 0 850 18400 Subtropical
715 Gold Coast (C) 12 0 0 220 600 Subtropical
Page 23Camp No. No. Min. Median Max. KPN
LGA
ID surveys influx count count count class
779 Gold Coast (C) 11 0 12 29 70 Subtropical
453 Gold Coast (C) 12 0 8 48.5 150 Subtropical
520 Gosford (C) 13 4 0 0 30000 Temperate
132 Great Lakes (A) 17 5 0 2600 28444 Temperate
12 Greater Bendigo (C) 18 5 253 950 12000 Temperate
36 Greater Geelong (C) 16 2 220 5650 33000 Temperate
798 Greater Shepparton (C) 12 0 0 10 2000 Temperate
31 Greater Taree (C) 17 1 0 0 3588 Temperate
93 Greater Taree (C) 19 1 0 30874 99769 Temperate
251 Greater Taree (C) 16 0 0 0 137 Temperate
617 Greater Taree (C) 17 5 0 1142 12799 Temperate
161 Gympie (R) 18 5 0 20000 200000 Subtropical
164 Gympie (R) 17 2 0 22378 268077 Subtropical
350 Gympie (R) 13 4 0 500 50000 Subtropical
558 Hinchinbrook (S) 18 2 0 6820 38440 Subtropical
481 Hunters Hill (A) 20 4 0 1110 8000 Temperate
140 Ipswich (C) 16 4 0 625 20000 Subtropical
191 Ipswich (C) 15 4 0 0 11000 Subtropical
428 Ipswich (C) 13 0 0 0 1100 Subtropical
479 Ipswich (C) 15 2 0 1000 3200 Subtropical
574 Ipswich (C) 15 1 0 350 6000 Subtropical
7 Kempsey (A) 17 1 0 1400 8000 Subtropical
528 Kempsey (A) 17 0 0 2242 5736 Subtropical
38 Ku-ring-gai (A) 15 1 3368 10230 32115 Temperate
53 Kyogle (A) 17 5 0 450 33500 Subtropical
66 Kyogle (A) 20 3 0 6000 41264 Subtropical
647 Kyogle (A) 12 0 0 0 2000 Subtropical
17 Lake Macquarie (C) 10 1 137 1705.5 30612 Temperate
255 Lismore (C) 19 3 2740 13880 95441 Subtropical
492 Lismore (C) 18 1 0 597.5 4950 Subtropical
502 Lismore (C) 13 0 0 0 1020 Subtropical
620 Lismore (C) 10 2 0 0 19256 Subtropical
622 Lismore (C) 18 7 0 695 67742 Subtropical
748 Lismore (C) 12 0 0 2475 7200 Subtropical
25 Liverpool (C) 16 1 900 3820 14130 Temperate
347 Lockyer Valley (R) 19 0 0 3000 6450 Subtropical
372 Lockyer Valley (R) 13 4 370 1110 30000 Subtropical
148 Logan (C) 14 1 0 170 6000 Subtropical
281 Logan (C) 17 1 0 1400 6200 Subtropical
310 Logan (C) 13 3 0 1200 8500 Subtropical
Page 24Camp No. No. Min. Median Max. KPN
LGA
ID surveys influx count count count class
377 Logan (C) 15 1 0 1500 5000 Subtropical
401 Logan (C) 17 1 0 1200 5050 Subtropical
433 Logan (C) 15 4 0 6000 53100 Subtropical
340 Mackay (R) 11 4 0 3000 24000 Subtropical
380 Maitland (C) 20 0 0 0 1800 Temperate
810 Maitland (C) 13 3 0 800 5600 Temperate
529 Manly (A) 18 0 496 3280 6200 Temperate
559 Moira (S) 18 0 155 1215 3200 Temperate
152 Moreton Bay (R) 10 1 0 0 3000 Subtropical
180 Moreton Bay (R) 10 2 0 0 7000 Subtropical
186 Moreton Bay (R) 17 1 100 4000 50000 Subtropical
192 Moreton Bay (R) 16 3 0 8500 50000 Subtropical
298 Moreton Bay (R) 18 1 0 0 2300 Subtropical
328 Moreton Bay (R) 10 2 0 3000 15996 Subtropical
429 Moreton Bay (R) 16 0 1000 2485 3500 Subtropical
582 Moreton Bay (R) 17 0 0 20 200 Subtropical
503 Nambucca (A) 18 5 0 0 40000 Subtropical
523 Nambucca (A) 18 4 396 2110 19800 Subtropical
70 Newcastle (C) 15 5 250 1948 13658 Temperate
608 Newcastle (C) 19 3 0 2500 15413 Temperate
315 North Burnett (R) 20 5 0 3800 208000 Subtropical
348 North Burnett (R) 20 5 0 3250 107000 Subtropical
549 North Burnett (R) 20 1 0 0 151000 Subtropical
134 Parramatta (C) 20 0 3750 12830 17640 Temperate
237 Penrith (C) 19 3 0 1150 20000 Temperate
4 Pittwater (A) 19 0 270 620 1300 Temperate
97 Pittwater (A) 11 1 88 740 5000 Temperate
Port Macquarie-
21 17 3 0 0 9667 Temperate
Hastings (A)
Port Macquarie-
115 20 2 0 16007.5 164261 Temperate
Hastings (A)
625 Port Stephens (A) 18 0 1211 4725.5 12612 Temperate
487 Randwick (C) 20 0 5700 11960 32450 Temperate
270 Redland (C) 11 0 400 3000 7000 Subtropical
319 Redland (C) 15 0 0 20 800 Subtropical
26 Richmond Valley (A) 20 5 0 2675 101700 Subtropical
128 Richmond Valley (A) 12 1 0 0 3800 Subtropical
239 Richmond Valley (A) 20 1 0 104 4000 Subtropical
488 Rockdale (C) 20 0 0 11250 26410 Temperate
362 Rockhampton (R) 12 0 0 5000 9500 Subtropical
Page 25Camp No. No. Min. Median Max. KPN
LGA
ID surveys influx count count count class
754 Rockhampton (R) 12 0 0 0 600 Subtropical
141 Scenic Rim (R) 18 2 0 6750 23473 Subtropical
86 Shellharbour (C) 17 2 140 1898 9205 Temperate
51 Shoalhaven (C) 10 2 1 8120.5 108818 Temperate
109 Singleton (A) 14 3 0 1503 42200 Temperate
156 Somerset (R) 15 4 0 4550 125000 Subtropical
368 Somerset (R) 16 3 0 1250 45000 Subtropical
383 Somerset (R) 11 2 105 2500 21000 Subtropical
271 Southern Downs (R) 10 0 0 425 1300 Temperate
187 Sunshine Coast (R) 12 1 0 0 6340 Subtropical
317 Sunshine Coast (R) 15 2 0 0 7000 Subtropical
324 Sunshine Coast (R) 15 4 0 6 10000 Subtropical
374 Sunshine Coast (R) 16 2 0 1203.5 5550 Subtropical
395 Sunshine Coast (R) 16 1 0 85 3000 Subtropical
418 Sunshine Coast (R) 13 2 0 0 10000 Subtropical
460 Sunshine Coast (R) 17 3 0 311 20000 Subtropical
781 Sunshine Coast (R) 12 3 278 6775 506000 Subtropical
789 Sunshine Coast (R) 17 6 0 450 19000 Subtropical
45 Sutherland Shire (A) 14 3 150 4280 20690 Temperate
672 Tablelands (R) 11 0 0 0 1000 Subtropical
683 Tablelands (R) 17 5 0 0 3600 Tropical
684 Tablelands (R) 18 3 0 0 24156 Subtropical
685 Tablelands (R) 16 4 0 500 14000 Subtropical
686 Tablelands (R) 14 1 0 0 3288 Subtropical
687 Tablelands (R) 15 4 0 0 16750 Subtropical
697 Tablelands (R) 18 1 0 0 2400 Subtropical
698 Tablelands (R) 19 6 2000 12000 120000 Subtropical
890 Tablelands (R) 20 5 0 1530 28899 Subtropical
530 Tamworth Regional (A) 20 6 0 3858.5 127500 Temperate
462 Toowoomba (R) 11 0 750 2000 6000 Temperate
556 Toowoomba (R) 11 3 38 600 8000 Temperate
92 Tumut Shire (A) 11 0 18 475 2000 Temperate
79 Tweed (A) 13 0 0 0 850 Subtropical
111 Tweed (A) 14 4 0 90 4609 Subtropical
118 Tweed (A) 18 2 0 789.5 3959 Subtropical
130 Tweed (A) 19 2 0 955 6203 Subtropical
133 Tweed (A) 12 0 0 20 460 Subtropical
491 Tweed (A) 20 5 0 4034.5 29482 Subtropical
512 Tweed (A) 15 2 0 0 4616 Subtropical
749 Tweed (A) 10 0 0 61 1381 Subtropical
Page 26Camp No. No. Min. Median Max. KPN
LGA
ID surveys influx count count count class
30 Unincorporated ACT 10 1 180 1022 6580 Temperate
641 Wagga Wagga (C) 11 0 0 50 1800 Temperate
225 Wellington (A) 14 0 0 0 1120 Temperate
634 Wellington (A) 18 3 0 115 7500 Temperate
353 Whitsunday (R) 12 0 0 3315 5200 Subtropical
3 Wodonga (RC) 10 2 475 750 3600 Temperate
27 Wollondilly (A) 11 3 100 1550 6300 Temperate
81 Wollondilly (A) 10 1 190 2670 8760 Temperate
103 Wollongong (C) 20 5 154 980.5 10620 Temperate
Page 27You can also read


