Investigation on Physical Air Pollution Variables in Tropical Spice Garden, Pulau Pinang, Malaysia
←
→
Page content transcription
If your browser does not render page correctly, please read the page content below
Journal of Emerging Trends in Engineering and Applied Sciences (JETEAS) 5(4): 256-261
© Scholarlink Research Institute Journals, 2014 (ISSN: 2141-7016)
jeteas.scholarlinkresearch.com
Journal of Emerging Trends in Engineering and Applied Sciences (JETEAS) 5(4):256-261 (ISSN: 2141-7016)

 Investigation on Physical Air Pollution Variables in Tropical Spice
                  Garden, Pulau Pinang, Malaysia
                Nur-Aqidah A.A.1, Mardiana A.1, Naim D.M.2, Ibrahim M.H.1
                                    1
                           School of Industrial Technology,
                 Universiti Sains Malaysia, 11800 Penang, Malaysia
                             2
                              School of Biological Sciences,
                   Universiti Sains Malaysia, 11800 Penang, Malaysia
Corresponding Author: Mardiana A.
_________________________________________________________________________________________
Abstract
Extensive research has been conducted concerning outdoor environment and it was proven that physical air
pollution variables are very connected to living organisms including human health, plants and animals. Due to
its significant impact on determinants of health and environmental pollutions, thus it deserves special attention.
Hence, this study was conducted to evaluate and characterise the physical air pollution variables in tropical
region of Northern Peninsular Malaysia, based on a case study at Tropical Spice Garden (TSG), Pulau Pinang,
Malaysia. This garden set out eight acres of secondary jungle and has lots of plant species valued for healing
and medicinal as well as culinary uses such as spices and herbs. Measurements were carried out at two different
locations, outside (Point A) and inside of TSG (Point B) in order to compare and analyse the air conditions at
these two locations. The physical air pollution variables in terms of temperature, relative humidity (RH), dew
point, level of carbon monoxide (CO), carbon dioxide (CO2), photoionisation detector (PID) and dust
concentration were determined simultaneously by using an Environmental Monitor EVM-7, while hot wire
anemometer was used to measure air movement. From the study, it was found that the environmental air quality
in terms of CO, CO2, and dust concentration at Point B of TSG was better (lower values) as compared to Point
A. This is due to the fact that Point B was located away from the roadside which indirectly affected the air
conditions at this point. As a conclusion, there were many factors contribute for the high or low values of air
pollution variables such as distance from the roadside, topography area as well as the surroundings and further
study should be conducted in this field to investigate the effects of various factors on air pollution variables or
air conditions in TSG.
__________________________________________________________________________________________
Keywords: physical air pollution, variable, tropical region, air pollution.

INTRODUCTION                                                    pollution in developing countries are mobile sources
The environmental concern for air pollution has                 (70-75% of total air pollution), stationary sources
largely been focused on the question of pollution               (20-25%), and open burning sources (3-5%).
outdoors and now has become as one of the serious               Nowadays, the situation becomes more worse
crisis to which we are facing today. Air pollution is a         because it affects not only the population in that
very complex mixture consisting of hundreds of                  particular area but also give a major impact to the
different inorganic and organic compounds                       whole ecosystem and the climate (Radojevic and
(Koistinen et al., 2004) which has a great influence            Bashkin, 2006). The increased risks of air pollution
on human races. This pollution can be caused by                 were affected predominantly by traffic emissions,
various sources such as factories, vehicles, power              emissions from household heating and industries
plants, dry cleaners and so on. Besides,                        (Koistinen et al., 2004).
meteorological aspects in terms of temperature, wind
profile, relative humidity and atmospheric pressure             With the growth of the atmospheric pollutants, lots of
also contribute to air pollution. It was reported by            researches have been carried out in relation to air
Vanos et al., (2014) that rapid growth of population,           pollution variables (Koistinen et al., 2004;
urbanisation, industrialisation, commercialisation and          Rodopoulou et. al. 2014; Li, et. al., 2014; Mues, et.
the increasing development of human activities has              al., 2013; Ali et al., 2008; Stegelmeier et al., 2013;
given rise to a significant increase in atmospheric             Makhdum et al., 2001). There are also numerous
pollutants over the last three decades. With this               cases can be found in the literature related to air
regard, the levels of air pollutants are increasing             pollution and have resulted not only causing illness
rapidly in urban areas in many mega cities of the               but even death (Black, 2003; Qiu et. al., 2013;
developing world (Agrawal et al., 2003). Afroz et al.           Medina et al., 2013). However, only few studies have
(2003) reported that the three major sources of air             published on air pollution variables in Malaysia and
                                                          256
Journal of Emerging Trends in Engineering and Applied Sciences (JETEAS) 5(4):256-261 (ISSN: 2141-7016)
most of these studies have typically focus on air possess seven environmental variables sensor which
pollution study of vehicle emissions (Shuhaili et al., are temperature level, relative humidity, carbon
2013) and air pollution trends in urban area or dioxide (CO2), carbon monoxide (CO),
industrial area (Abdullah et al., 2012). From these photoionisation detector (PID) level, dust level and
evidences, so far there is no published work on dew point level. While air velocity was measured
physical air pollution variables conducted in using Testo hot wire anemometer (Model: 405 – V1).
secondary jungle or garden or a location that is far The accuracy of each sensor is shown in Table 1.
away from industrial area in Malaysia. To close the
above research gaps, thus the objective of this study Table 1: The accuracy of six sensors in the EVM-7
is to evaluate and characterise the physical air and hot wire anemometer
pollution variables in tropical region of Northern No Sensor Accuracy
Peninsular Malaysia based on a case study at a 1 Temperature ± 1.1 deg C
2 Relative Humidity ± 5% RH of signal between
secondary jungle in Malaysia namely Tropical Spice 10 and 90%
Garden (TSG). The limitation of this study are it only 3 Carbon Monoxide (CO) ± 5%/2% of signal
focuses on several air pollution varibles and duration 4 Carbon Dioxide (CO2) ± 2% of signal, ± 50 ppm
of sampling. between 0 and 2500
5 Dust The photometer can detect
particles up to 100 µm;
Some of the limitations of this study include external however, accuracy is reduced
validity, or the generalizability of the study. T for sizes greater than 10 µm.
6 Photoionisation Detector ± 5%/2% (rel to Isobutylene)
(PID) at calibration level
METHODOLOGY 7 Air Velocity 0 to 2 m/s: ± 0.1m/s ± 5% of
This study was carried out in June 2013 in Tropical rdg.
Spice Garden (TSG), Pulau Pinang, Malaysia. This 2.1 to 10 m/s: ± 0.3m/s ±5%
tropical garden known as the first Tropical Climate of rdg.
Spice Garden which is located on the latitude of
5.46352 N and longitude of 100.229087 E. The The measurements were carried out at two different
garden set out eight acres of secondary jungle with locations, outside and inside of TSG which represent
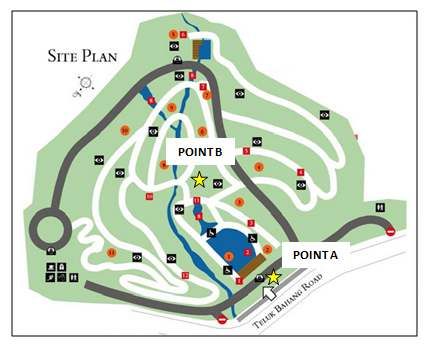
contour topography and far from industrial area. Point A and B, respectively as can be seen in Fig. 2.
Also, it has lots of plant species valued for healing The sensors were placed 1 m above the ground level
and medicinal and culinary uses such as spices and and were run simultaneously with 5 minutes interval
herbs. Fig. 1 illustrates the location of the study area. time for two hours with four replications. Outdoor
During the study, the mean annual wind speed of this climate data in Pulau Pinang in terms of temperature,
area was found to be 1.8 m/s with relative humidity relative humidity, total rainfall, wind speed and
of over 80.2%, mean temperature more than 27 °C, PM10 were also collected in this study as illustrated
annual rainfall amount was 2,294 mm and PM10 level in Table 2
was 29.8 µg/m³.
Fig. 1: The location of study area, Tropical Spice
Garden, Pulau Pinang, Malaysia
Fig. 2: Location of Point A and B at TSG
The physical air pollution variables were recorded by
a set of calibrated digital hand held instrument which
is Environmental Monitor EVM-7. This device
257Journal of Emerging Trends in Engineering and Applied Sciences (JETEAS) 5(4):256-261 (ISSN: 2141-7016)
Table 2: Meteorological data and PM10 (particulate matter/dust) in Pulau Pinang
Mean Mean Max Wind
Month / Relative Rainfall No of Rainy PM10
Year Wind Temperature [degree direction /
Parameters Humidity (%) Amount(mm) Days (µg/m3)
(m/s) (°C) (m/s)]
Jan 2.2 75.8 27.8 21.4 10 N.A 29.4
Feb 2 80.8 27.9 250.4 15 220/13.5 33.8
Mar 1.6 82.3 27.6 308.8 18 020/11.7 31
Apr 1.7 82.9 28 166.6 22 070/12.7 20.5
May 1.4 82.7 28.1 241 20 330/14.2 28.3
Jun 1.7 80.8 28.6 44.6 6 200/11.7 49.4
2012
Jul 2.0 80.8 27.8 140.8 11 230/15.9 28.9
Aug 2.0 77.4 28.1 203.2 10 300/13.5 28.9
Sep 1.7 79.8 27.4 376.6 16 310/15.3 28.9
Oct 1.7 81.3 27.4 193.8 22 320/12.6 28.9
Nov 1.7 80.1 27.5 252.4 24 050/12.4 28.9
Dec 2.2 77.7 27.5 95.0 17 060/12.4 28.9
Jan 2.2 75.9 28.1 152 11 040/11.8 29.7
Feb 2.3 78.7 27.7 154.4 18 060/11.8 27.2
2013 Mar 2.1 78.7 29.3 55.6 8 010/14.1 31.6
Apr 1.7 80.6 28.8 148.6 19 230/14.9 25.8
May 1.9 78.2 29.2 96.4 11 170/13.9 23.9
Jun 1.6 78.5 28.7 150.6 12 300/15.9 35.7
can be seen that the statistical data for dust, CO2, CO,
RESULTS AND DISCUSSION relative humidity and dew point level at Point B were
Statistical summary of air pollution variables at point considerably lower than Point A. These disparities
A and B were reported in Table 3 and Table 4, indicated that air quality inside TSG was
respectively. The statistical data includes mean, exceptionally better and cleaner than outside TSG
median and mode values as well as range values of
all measured data. As illustrated in Table 3 and 4, it
Table 3: Statistical summary of physical air pollution variables at point A
Air
Parameters Dust Level CO2 Level CO Level PID Level Temp Level Humidity Dew Point
Velocity (
/ Data (µg/m³) (PPM) (PPM) (PPM) (°C) Level ( %) Level (°C)
m/s)
Mean 50.12 411 1.64 0 29.84 77.68 25.51 0.20
Median 45 408 2 0 29.9 77.3 25.6 0.19
Mode 52 406 2 0 30 74.1 25.3 0.10
Range 48 96 1 0 1.9 14.1 1.9 0.55
Table 4: Statistical summary of physical pollution variables at point B
Parameters Dust Level CO2 Level CO Level PID Level Temp Level Humidity Dew Point Air Velocity (
/ Data (µg/m³) (PPM) (PPM) (PPM) (°C) Level ( %) Level (°C) m/s)
Mean 15.08 393.57 1.46 0 31.03 66.07 23.95 0.26
Median 14.50 395.00 1.00 0 31.00 65.20 23.90 0.22
Mode 13.00 397.00 1.00 0 30.80 68.30 23.90 0.17
Range 12.00 24.00 2.00 0 2.80 11.00 1.50 1.05
Overall, it was recorded that the temperature range at A was found to be 50.12 µg/m³ with 0.2 m/s of air
Point B was 1.19 °C higher than Point A while the velocity which was 35% higher than the dust level at
relative humidity at Point B was 11.6% lower than Point B (Fig. 4.). During the study, it was also
the humidity level at Point A. The variation of observed that the road traffic was busy which
temperature and relative humidity at Point A and B is indirectly contributes to higher value of CO2 level at
shown in Fig. 3. The mean value of dust level at point Point A. The busy road traffic exacerbated by low air
258Journal of Emerging Trends in Engineering and Applied Sciences (JETEAS) 5(4):256-261 (ISSN: 2141-7016)
velocity had resulted low dispersion of dust. While barrier for traffic pollutants and this could possibly
different situation observed at Point B where CO2 lower the reading of air pollution variables at Point B
level was lower than Point A (high level of air recorded in this study. In this study, it was also
velocity had resulted of more dispersion of dust). The observed that, there were a number of motor vehicles
relation between air velocity and dispersion of dust parked near the entrance of TSG at Point A with the
was pointed by many researchers (Zhang, 2004; engine running on which could also possibly
Abdullah et al., 2007; Schneidar, 2008; Sneha contributes to the high levels of dust, CO2, CO and
Gautam et at., 2012) humidity level recorded at this point (Radojevic and
Bashkin, 2006). Further and thorough investigation
should be conducted in this area to study the effects
of various factors on air pollution variables in TSG
Fig. 3: Variation of temperature and relative humidity
at Point A (P.A) and B (P.B)
Fig. 4: Variation of dust level and air velocity at
Point A (P.A) and B (P.B)
Fig. 6: Variation of CO and air velocity at Point A
(P.A) and B (P.B)
Fig. 5 indicates the variation of CO2 and air velocity
levels at point A and B. From the figure, it can been
CONCLUSION
observed that the CO2 level at Point A was 17.4%
This study was carried out as a preliminary work to
higher than Point B with the air velocity mean value
evaluate and characterise the physical air pollution
of 0.2 m/s. This is due to the fact that location of
variables in tropical region of Northern Peninsular
Point A was near the roadside area and gases emitted
Malaysia based on a case study at TSG, Pulau
from motor vehicles were the main source of CO2
Pinang, Malaysia. Measurements were conducted out
production (USEPA, 2014). During the study, it was
at two different locations, outside (Point A) and
also observed that the road traffic was busy which
inside (Point B) of TSG in order to compare and
indirectly contributes to higher value of CO2 level at
analyse the air conditions at these two locations using
Point B. On the other hand, the variation of air
portable multi-sensor Environmental Monitor EVM-7
velocity and CO level is presented in Fig. 6. From the
and hot wire anemometer. From this study it was
figure, it can be seen that the CO level at Point A was
found that the levels of physical air pollution
higher than Point B. The fact that Point B was located
variables in terms of temperature, relative humidity
away from the road side where this situation was
(RH), (CO) (CO2), (PID) and dust at Point A were
proven by several studies (Al-Chalabi and Hawker,
higher than Point B. These disparities indicated that
2000, Li et al., 2007, Naveed et al., 2011, Yan et al.,
air quality inside TSG (Point B) was exceptionally
2013). The more distance from the roadside, the less
better and cleaner than outside TSG (Point A). This is
pollution occurs. In addition, 2 m high of wall
due to the fact that Point B was located away from
surrounded at the front location of TSG serves as a
259Journal of Emerging Trends in Engineering and Applied Sciences (JETEAS) 5(4):256-261 (ISSN: 2141-7016)
the roadside which indirectly affected the air EPA.(b) 2014. Overview of Greenhouse Gases
conditions at this point. In addition, there were many [Online]. Available: http://www.epa.gov/
factors contribute for the high or low values of air climatechange/ghgemissions/gases/co2.html
pollution variables such as distance from the [Accessed 19 February 2014.
roadside, topography area as well as the
surroundings (wall barrier, trees at the edge of the JOHNSON, D. & PARKER, J. D. 2009. Air pollution
roadside, vehicles etc). The limitations of this study exposure and self-reported cardiovascular disease.
are it only focuses on several air pollution variables Environ Res, 109, 582-589.
and duration of measurement. Thus, as a
recommendation further and thorough investigation KOISTINEN, K. J., EDWARDS, R. D., MATHYS,
should be carried out in this area to study the effects P., RUUSKANEN, J., KUNZLI, N. & JANTUNEN,
of various factors on air pollution variables or air M. J. 2004. Sources of fine particulate matter in
conditions in TSG. In addition, evaluation with personal exposures and residential indoor, residential
existing standards on air conditions should also be outdoor and workplace microenvironments in the
conducted by taking into account the duration of Helsinki phase of the EXPOLIS study. Scand J Work
measurement. Environ Health, 30 Suppl 2, 36-46.
ACKNOWLEDGEMENTS LI, F.-R., KANG, L.-F., GAO, X.-Q., HUA, W.,
This study is fully supported by Long Term Grant YANG, F.-W. & HEI, W.-L. 2007. Traffic-Related
Scheme, Ministry of Education of Malaysia Heavy Metal Accumulation in Soils and Plants in
(R/LRGS/A02.00/00559A/004/2012/000089), Northwest China. Soil and Sediment Contamination:
(203/PTS/6727003). It is technically supported by An International Journal, 16, 473-484.
tropical Spice Garden, Pulau Pinang Malaysia. The
authors also would like to thank Mr Kenneth Khoo LI, W., WANG, C., WANG, H., CHEN, J., YUAN,
and all staff of Tropical Spice Garden. C., LI, T., WANG, W., SHEN, H., HUANG, Y.,
WANG, R., WANG, B., ZHANG, Y., CHEN, H.,
REFERENCES CHEN, Y., TANG, J., WANG, X., LIU, J.,
AGRAWAL, M., SINGH, B., RAJPUT, M., COVENEY JR, R. M. & TAO, S. 2014. Distribution
MARSHALL, F. & BELL, J. N. B. 2003. Effect of of atmospheric particulate matter (PM) in rural field,
air pollution on peri-urban agriculture: a case study. rural village and urban areas of northern China.
Environmental Pollution, 126, 323-329. Environmental Pollution, 185, 134-140.
ABDULLAH, L. C., WONG, L. I., SARRI, M., MAKHDUM, M. I., MALIK, M. N., FIAZ AHMAD,
SALMIATON, A. & RASHID, M. S. A. 2007. CHAUDHRY, F. I. & SHABAB-UD-DIN 2001.
Particulate matter dispersion and haze occurrence Investigation on the physical parameters of
potential studies at a local palm oil mill. International environment and their impact on cotton crop
Journal of Environmental Science and Technology, 4, production in the southern Punjab, Pakistan. Journal
271-278. of Research (Science), Bahauddin Zakariya
University, Multan Pakistan., 12, 147-154.
AFROZ R., HASSAN M.N., IBRAHIM N.A.
Review of air pollution and health impacts in MEDINA, S., DOMÍNGUEZ-PERLES, R.,
Malaysia. Environ Res 2003; 92: 71-7. FERRERES, F., TOMÁS-BARBERÁN, F. A. &
GIL-IZQUIERDO, Á. 2013. The effects of the intake
AL-CHALABI, A. S. & HAWKER, D. 2000. of plant foods on the human metabolome. TrAC
Distribution of vehicular lead in roadside soils of Trends in Analytical Chemistry, 52, 88-99.
major roads of Brisbane, Australia. Water Air and
Soil Pollution, 118, 299-310. MUES, A., MANDERS, A., SCHAAP, M., VAN
ULFT, L. H., VAN MEIJGAARD, E. & BUILTJES,
ALI, K. S., LAJBAR, K., HUSSAIN, I., MARWAT, P. 2013. Differences in particulate matter
K. B. & AKHTAR, N. 2008. Profile of Heavy Metals concentrations between urban and rural regions under
in Selected Medicinal Plants. Pak. J. Weed Sci. Res, current and changing climate conditions. Atmospheric
14, 101-110. Environment, 80, 232-247.
BLACK, J. 2003. Intussusception and the great smog NAVEED, N. H., BATOOL, A. I., REHMAN, F. U.
of London, December 1952. Archives of Disease in & HAMEED, U. 2011. Leaves of roadside plants as
Childhood, 88, 1040-1042. bioindicator of traffic related lead pollution during
difference seasons in Sargodha, Pakistan. Afr Journal
Environmental Sciene Technology, 770-774.
260Journal of Emerging Trends in Engineering and Applied Sciences (JETEAS) 5(4):256-261 (ISSN: 2141-7016)
QIU, H., YU, I. T.-S., WANG, X., TIAN, L., TSE, L.
A. & WONG, T. W. 2013. Cool and dry weather
enhances the effects of air pollution on emergency
IHD hospital admissions. International Journal of
Cardiology, 168, 500-505.
RADOJEVIC, M. & BASHKIN, V. N. 2006.
Practical Environmental Analysis Cambridge, UK,
The Royal Society of Chemistry.
RODOPOULOU, S., CHALBOT, M.-C., SAMOLI,
E., DUBOIS, D. W., SAN FILIPPO, B. D. &
KAVOURAS, I. G. 2014. Air pollution and hospital
emergency room and admissions for cardiovascular
and respiratory diseases in Doña Ana County, New
Mexico. Environ Res, 129, 39-46.
SCHNEIDER, T. 2008. Dust and fibers as a cause of
indoor environment pollution. SJWEH Suppl, 4, 10-
17.
SNEHA GAUTAM, BASANTA KUMAR PRUSTY
& PATRA, A. K. 2012. Pollution Due To Particulate
Matter From Mining Activities. Reciklaža i održivi
razvoj, 5, 53-58.
STEGELMEIER, B. L., FIELD, R., PANTER, K. E.,
HALL, J. O., WELCH, K. D., PFISTER, J. A.,
GARDNER, D. R., LEE, S. T., COLEGATE, S.,
DAVIS, T. Z., GREEN, B. T. & COOK, D. 2013.
Chapter 40 - Selected Poisonous Plants Affecting
Animal and Human Health. In: HASCHEK, W. M.,
ROUSSEAUX, C. G. & WALLIG, M. A. (eds.)
Haschek and Rousseaux's Handbook of Toxicologic
Pathology (Third Edition). Boston: Academic Press.
VANOS, J. K., HEBBERN, C. & CAKMAK, S.
2014. Risk assessment for cardiovascular and
respiratory mortality due to air pollution and synoptic
meteorology in 10 Canadian cities. Environmental
Pollution, 185, 322-332.
YAN, X., GAO, D., ZHANG, F., ZENG, C.,
XIANG, W. & ZHANG, M. 2013. Relationships
between Heavy Metal Concentrations in Roadside
Topsoil and Distance to Road Edge Based on Field
Observations in the Qinghai-Tibet Plateau, China.
International Journal of Environmental Research and
Public Health, 10, 762-775.
ZHANG, Y. 2004. Indoor Air Quality Engineering,
CRC Press, 2004.
261You can also read