Investor Overview March 2021
←
→
Page content transcription
If your browser does not render page correctly, please read the page content below

Investor Overview

    March 2021

                    1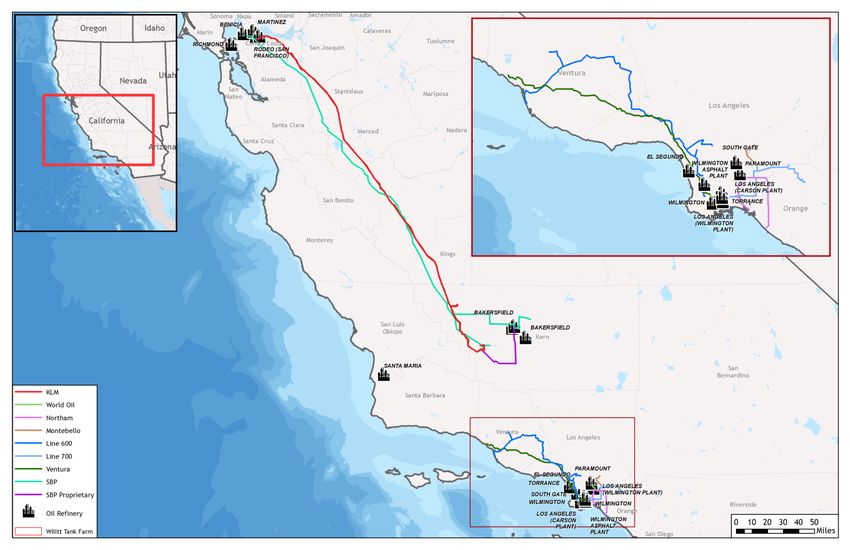
Disclaimer

Forward Looking Statements

This presentation contains certain statements that may include "forward-looking statements" within the meaning of Section 27A of the Securities Act of 1933 and
Section 21E of the Securities Exchange Act of 1934. All statements, other than statements of historical fact, included herein are "forward-looking statements."
Although CorEnergy believes that the expectations reflected in these forward-looking statements are reasonable, they do involve assumptions, risks and uncertainties,
and these expectations may prove to be incorrect. Actual results could differ materially from those anticipated in these forward-looking statements as a result of a
variety of factors, including, among others, failure to realize the anticipated benefits of the Transaction or Internalization (as further described in this presentation); the
risk that CPUC approval is not obtained, is delayed or is subject to unanticipated conditions that could adversely affect CorEnergy or the expected benefits of the
Crimson Transaction, risks related to the uncertainty of the projected financial information with respect to Crimson, the failure to receive the required approvals by
existing CorEnergy stockholders; the risk that a condition to the closing of the Internalization may not be satisfied, CorEnergy’s ability to consummate the
Internalization, and those factors discussed in CorEnergy’s reports that are filed with the Securities and Exchange Commission. You should not place undue reliance
on these forward-looking statements, which speak only as of the date of this presentation. Other than as required by law, CorEnergy does not assume a duty to
update any forward-looking statement. In particular, any distribution paid in the future to our stockholders will depend on the actual performance of CorEnergy, its
costs of leverage and other operating expenses and will be subject to the approval of CorEnergy’s Board of Directors and compliance with leverage covenants.

Non-GAAP Financial Measures

This document includes certain non-GAAP financial measures that are not prepared in accordance with accounting principles generally accepted in the United States
(“GAAP”) and that may be different from non-GAAP financial measures used by other companies. CorEnergy believes that the use of these non-GAAP financial
measures provides an additional tool for investors to use in evaluating the Crimson Transaction. These non-GAAP measures should not be considered in isolation
from, or as an alternative to, financial measures determined in accordance with GAAP. Additionally, to the extent that forward-looking non-GAAP financial measures
are provided, including EBITDA, they are presented on a non-GAAP basis without reconciliations of such forward-looking non-GAAP measures due to the inherent
difficulty in forecasting and quantifying certain amounts that are necessary for such reconciliation.

                                                                                                                                                                                  2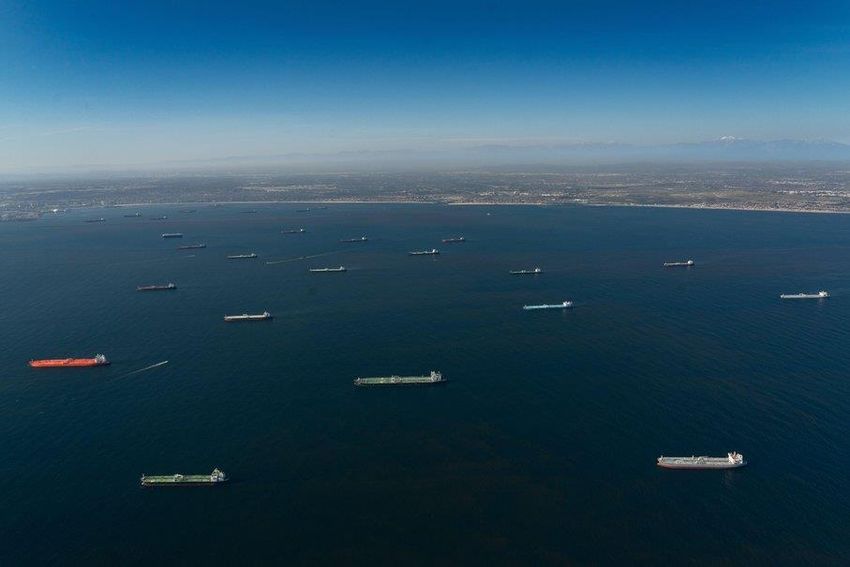
Disclaimer

Additional Information and Where to Find It

The issuance of CorEnergy common stock upon conversion of CorEnergy preferred stock in connection with the Transaction as described in this presentation (the
“Stock Issuance”) and the Internalization will be submitted to the stockholders of CorEnergy for their consideration. In connection with the Stock Issuance and
Internalization, CorEnergy intends to file a proxy statement and other documents with the SEC. INVESTORS AND CORENERGY STOCKHOLDERS ARE URGED TO
READ THE PROXY STATEMENT (INCLUDING ALL AMENDMENTS AND SUPPLEMENTS THERETO) REGARDING THE STOCK ISSUANCE AND
INTERNALIZATION AND OTHER DOCUMENTS RELATING TO THE TRANSACTIONS THAT WILL BE FILED WITH THE SEC CAREFULLY AND IN THEIR
ENTIRETY WHEN THEY BECOME AVAILABLE BECAUSE THEY WILL CONTAIN IMPORTANT INFORMATION ABOUT THE STOCK ISSUANCE AND
INTERNALIZATION. The proxy statement and other relevant documents (when they become available), and any other documents filed by CorEnergy with the SEC
may be obtained free of charge at the SEC’s website at www.sec.gov. In addition, stockholders may obtain free copies of the documents filed with the SEC by
CorEnergy through its website at corenergy.reit. The information on CorEnergy’s website is not, and shall not be deemed to be a part hereof or incorporated into this
or any other filings with the SEC.

You may also request them in writing, by telephone or via the Internet at: CorEnergy Infrastructure Trust, Inc., Investor Relations, 877-699-CORR (2677),
info@corenergy.reit.

Participants in the Solicitation

CorEnergy, the Manager and their respective directors and executive officers and other persons may be deemed to be participants in the solicitation of proxies from
CorEnergy’s stockholders in respect of the Stock Issuance and Internalization. Information about CorEnergy’s directors and executive officers is available in
CorEnergy’s definitive proxy statement, prepared in connection with CorEnergy’s 2020 annual meeting of stockholders and will be set forth in the proxy statement in
respect of the Stock Issuance and Internalization when it is filed with the SEC. Other information regarding the persons who may, under the rules of the SEC, be
deemed participants in the solicitation of proxies from CorEnergy’s stockholders in connection with the Stock Issuance and Internalization, including a description of
their direct or indirect interests, by security holdings or otherwise, in CorEnergy will be set forth in the proxy statement in respect of the Stock Issuance and
Internalization when it is filed with the SEC. You can obtain free copies of these documents, which are filed with the SEC, from CorEnergy using the contact
information above.

                                                                                                                                                                         3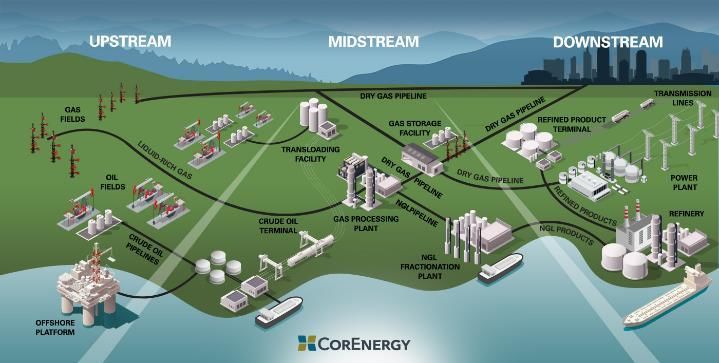
CorEnergy: The first REIT operator of critical infrastructure assets

 Long-lived assets                                                        Unique REIT + PLR Structure                                                        Energy Transition Ready
 Owns and operates physical                                               Tax efficient REIT gives investors                                                 Assets capable of multiple refined
 infrastructure serving utility-like                                      direct access to tax-efficient                                                     product and other use cases
 functions for producers and                                              infrastructure cash flows                                                          ~2,000 miles of rights of way
 consumers of energy                                                      Industry-first PLR provides ability                                                provide additional opportunities in
 Majority of assets operated under                                        to both own and operate select                                                     critical corridors
 regulated rate making authorities                                        assets

 Stable cash flows                                                        Outlook                                                                            Common Dividend Upside
 Long term, credit-worthy users, low                                      EBITDA of $50-$52 million                                                          Initial annualized dividend of $0.20
 direct commodity exposure drive                                          annualized from Q2 20211                                                           Targeting $0.35-$0.40 upon a
 predictable cash flow                                                    Targeted debt-to-EBITDA ratio of                                                   return to pre-COVID market
 Additional opportunities utilizing
2020 Challenges and Resiliency

Global COVID-19 Pandemic
• Unprecedented simultaneous supply and demand shocks to the energy industry
• Extraordinary reductions in energy demand and pricing pressured CORR tenants

Exited Troubled Single-Tenant Assets
• Pinedale LGS – July 2020 – Tenant entered bankruptcy reorganization, significantly
  reduced reserves valuation.
  Sold to bankruptcy estate and fully discharged associated subsidiary secured debt
• Grand Isle Gathering System – February 2021 – Tenant unable to pay rent due to
  shut-ins resulting from declines in Gulf oil pricing and record hurricane season
  Sold as part of Crimson transaction funding acquisition of 4 critical infrastructure
  pipelines suitable for multiple uses

Balance Sheet Resiliency
• CORR’s judicious debt levels and high liquidity allowed it to navigate difficult markets
• Positioned the Company to acquire new, high-quality dividend producing assets
• Commenced significant business development engagement in June 2020, leading to
  successful transaction

                                                                                             5
2021 Strategic Transactions with Crimson Midstream
• Long-live assets critical to producer and refiner operations with
limited direct commodity price sensitivity.
• CPUC regulated owner/operator of ~2,000 miles of critical
infrastructure pipeline systems across northern, central and
southern California
• Connecting desirable native California crude production to in-
state refineries producing state-mandated specialized fuel blends
• Long-standing customer relationships with diversified, credit-
worthy shippers
• REIT qualifying under CORR’s PLR
• Ability to participate in the energy transition via existing assets,
acquisitions and rights of way
• Experienced management team with history of of operating
assets safely in highly regulated environments
62021 Portfolio Review - Midwest
Legacy MoGas and Omega pipeline systems transport and deliver natural gas Linn
to LDCs and end-users
Macon
Macon Marion
Livingston Shelby
Sangamon
Morgan
Scott
Pike
Christian
MoGas is a 263-mile FERC-regulated natural gas pipeline near St. Ralls
Monroe S
Louis, MO Carroll Chariton Randolph
PEPL Connect Missouri Illinois
Pike Greene
Audrain REX Connect
Montgomery
•
Macoupin
Operated by CORR since 2014 Saline Howard Curryville Compressor Calhoun
Jersey
• 94% of revenue is from take-or-pay transportation contracts with Boone
Lincoln
Fayette
Montgomery MRT Connect
investment-grade customers with on average 10 years remaining Cooper
Callaway
Bond
Warren Madison
on contracts Pettis Saint Charles Saint
Mari
Moniteau Saint Louis Louis
CitySt. Louis Clinton
Omega is a natural gas distribution system serving a strategically Cole
Osage
Morgan Gasconade Franklin Saint Clair
important US military base with growing demand Washington
Benton Monroe Jeffers
•
Jefferson
Operated by CORR since 2006 Miller
Maries
Perry
• In third 10-year contract with 5 years remaining Hickory Omega
Camden
Crawford Washington
Randolph Frankl
Pulaski Sainte Genevieve
Phelps
Saint Francois Perry Jackson
William
Dallas Laclede Iron
Polk Dent
2021 Outlook: Texas
Reynolds Madison
Bollinger
Cape Girardeau
Union
600188_1.wor (NY00813G)
• New interconnect and system enhancements enable expanded service Greene
to long-term
Webster
MoGas
Wright
customers under multi-year contracts
Pulaski
Shannon Alexander
• Omega serving increasing natural gas demand to growing military base Wayne
• Weather related utilization and new interconnect resulted in record throughputs in February 2021
72021 Portfolio Review - California
Crimson California ~2,000 miles of pipelines, storage facilities and rights of way linking in-state crude oil production and refiners
Northbound system transports crude from the San Joaquin Basin to the SF Bay Area refineries using both heated and unheated service
Southern system transports crude from LA and Ventura basins to LA refineries
Critical infrastructure
• Most economical connection between conventional
low-decline-rate crude basins and large refinery
demand centers
• 10B+ BOE of recoverable resource feeding refiners
designed to run native production
• Stable California refined product demand for
foreseeable future
• In-state crude production is refiners’ baseload
supply
Stable fee driven cash flows
• 90%+ of revenue generated from fee-based tariffs or
long-term, fixed-rate contracts
• CPUC regulated assets with cost-of-service rate
making authority
Primarily investment-grade rated customer base
with long operating histories in the state
8California Represents a Captive Market
California is the 5th largest crude oil producing state in the US
California fuel demand requires California refineries Price-driven California crude production is ~25% of total
California crude runs. In-state refiners take 100% of California
• State regulations require the sale of unique CARB (California Air
production. Demand-driven imports act as a large shock
Resources Board) gasoline and diesel
absorber before California crude is impacted
• As a result, California is dependent on California refiners for refined
product supply. CA Production vs. PADD 5 Imports – bpd
• California is the largest consumer of motor gasoline and jet fuel in the 1,800,000
nation 1,600,000
1,400,000
1,200,000
1,000,000
800,000
600,000
400,000
200,000
-
Jul-18
Jul-19
Jul-20
Jan-18
Jan-19
Jan-20
Mar-18
Mar-19
Mar-20
Sep-20
May-18
Sep-18
Nov-18
Sep-19
Nov-19
May-19
May-20
SJV/LA/Ventura Production Total Imports - PADD 5
Dozens of oil tankers idle near Los Angeles in April 2020
Sources: RS Energy Group (CA Basin Production); EIA (PADD 5 Data). The United States is divided into five Petroleum Administration for Defense Districts, or PADDs.PADD-5 is the West Coast.
9CORR Platform Growth Outlook
California
Crimson California Oil & Refining
500,000 $90.00 2021 Near-Term Drivers:
450,000 $80.00 • Return to pre-COVID market conditions
400,000 $70.00
• Operating synergies resulting from integration
350,000
Brent Price ($/bbl)
Production (bpd)
$60.00
300,000
• Commercial projects within Crimson’s footprint
$50.00
250,000
$40.00
200,000 Longer-Term Opportunities:
$30.00
150,000
• Acquisition of complementary or diversified
100,000 $20.00
pipelines
50,000 $10.00
• Increased volumes from closures/repurposing
- $-
of other pipelines
Jan-19
Jul-19
Mar-19
Jun-19
Jan-20
Mar-20
Jun-20
Jul-20
Jan-21
Feb-19
Feb-20
Sep-20
Feb-21
Nov-18
Dec-18
Aug-19
Sep-19
Nov-19
Dec-19
Apr-20
Aug-20
Nov-20
Dec-20
Oct-18
Apr-19
May-19
Oct-19
May-20
Oct-20
• Participation in California’s energy transition
SJV + SoCal Brent Price ($/bbl)
In their 9/25/2020 report, IHS (after internal combustion engine vehicle ban announcement), forecasted PADD 5 demand to remain flat from
2021 – 2025, then decline 1.6% annually between 2025 and 2050; primarily due to a reduction in gasoline demand. According to the EIA,
California is responsible for approximately 2/3 of PADD 5 demand.
Data sourced from https://www.conservation.ca.gov/calgem 10Transaction Process and Governance Updates
The Crimson and manager internalization transactions result in increased alignment of management and stockholders
Crimson acquisition will occur in two parts Internalization of the REIT manager
• CORR closed on the initial 49.5% of Crimson on February 4th • Also on February 4th, CORR reached agreement to
• CORR has the right to acquire the remaining 50.5% interest, internalize its external manager
owned by John Grier, subject to CPUC approval
‒ CORR stockholder vote required1
‒ Approval is anticipated Q3 2021
• Proposed structure would replace external
• The remaining 50.5% interest receives payment as though it management fee with internal SG&A expenses
holds the following securities:
‒ Estimated expense reduction of $2.0 million
‒ $17.2 million of CORR Class B common shares
annualized
‒ $60.9 million of 4.0% Series B convertible preferred equity
• Consideration consists of common, Class B
‒ $41.3 million of 9.0% Series C exchangeable preferred equity common and preferred equity1
• CORR stockholders will vote on approval of issuance of Class B
common stock underlying Series B Convertible Preferred 1
1. Investors and CorEnergy stockholders are urged to read the proxy statement (including all amendments and supplements thereto) regarding the stock issuance and internalization and other documents relating to the transactions that will be filed
with the SEC carefully and in their entirety when they become available because they will contain important information about the stock issuance and internalization.
11Liquidity and Capitalization
Liquidity and Capitalization (12/31/2020) Capitalization Details
($000's) Actual Pro Forma • Credit facility matures February 2024
Cash and Cash Equivilents $99,597 $19,997 • ~$45 million total available liquidity (cash and undrawn revolver)
• Term Loan amortizes $8.0 million per year starting June 30, 2021
Debt (excluding discounts)
Senior Secured Debt $0 $105,000 • 5.875% Unsecured Convertible Senior Notes due 2025
Convertible Notes 118,050 118,050 • 7.735% Cumulative Redeemable Series A Preferred
Total Debt $118,050 $223,050 • Noncontrolling Interest includes all of Grier’s owned equity securities
‒ 9.0% Series C Exchangeable Preferred
Stockholders' Equity
Series A Preferred $125,270 $129,526 • Converts into Series A Preferred at a 1.06x ratio
Capital Stock 14 15 ‒ 4.0% Series B Convertible Preferred
Class B Common Stock 0 1
• Converts into Class B Common Stock at a 3.56x ratio, subject to
Additional Paid in Capital 339,742 353,847
stockholder approval
Retained Deficit (315,627) (328,039)
Noncontrolling Interest 0 115,323 ‒ Class B Common Stock
Total Stockholders' Equity $149,400 $270,672 • Exchangeable into Common Stock at a 1:1 ratio subject to meeting
conversion tests
Total CorEnergy Capitalization $267,450 $493,722 • Dividends subordinated to Common Stock dividends
Pro forma liquidity and capitalization reflecting the impact of the acquisition of our 49.50% interest in Crimson and Internalization agreement with Corridor entered into on February 4, 2021. The Series C Exchangeable Preferred Stock, Series B
Convertible Preferred Stock and Class B Common Stock represent the equity consideration of the Grier members in Crimson Midstream Holdings LLC, which will be reflected as a noncontrolling interest in CorEnergy’s consolidated financial
statements. Pro forma column is for illustration purposes only. Investors and CorEnergy stockholders are urged to read the proxy statement (including all amendments and supplements thereto) regarding the stock issuance and internalization and
other documents relating to the transactions that will be filed with the SEC carefully and in their entirety when they become available because they will contain important information about the stock issuance and internalization. Values assume credit
facility, term loan, and convertible debt and Series A at face value.
12Fully Converted Capitalization Illustration
Pro Forma Pro Forma Pro Forma
@ Mrkt/Par Grier Conv. Internalization • The majority of Grier’s consideration, for his 50.5% interest in
($000's) 12/31/2020 12/31/2020 12/31/2020 Crimson, is in the form of subordinated common equity if the
Debt (Excluding Discounts) Series B is converted
Senior Secured Debt $105,000 $105,000 $105,000 • At current market prices the common equity is ~$200 million,
Convertible Notes 118,050 118,050 118,050
assuming full conversion of all securities
Total Debt $223,050 $223,050 $223,050
Preferred Stock
‒ Provides significant support for the preferred stock
Series A $125,270 $168,175 $172,430 • The 20-cent initial dividend to the common stock and Class B
Series C 40,330 0 0 common, assuming full conversion, is 1.75x covered at
Total Preferred Stock $165,600 $168,175 $172,430
midpoint of outlook
Series B Preferred Stock $60,900 $0 $0
‒ Calculated using EBITDA outlook midpoint and
Common Stock
Common Stock $104,844 $104,844 $113,705
maintenance capital guidance and subtracting interest,
Class B Common Stock 18,817 85,443 90,694 preferred dividends and mandatory debt amortization
Total Common Stock $123,661 $190,286 $204,399 which equates to AFFO less mandatory amortization
Number of Shares (000's)
Common Stock 13,652 13,652 14,805
Class B Common Stock 2,450 11,125 11,809
Total Number of Shares 16,102 24,777 26,614
The Series C Exchangeable Preferred Stock, Series B Convertible Preferred Stock and Class B Common Stock represent the equity consideration of the Grier members in Crimson Midstream Holdings LLC, which will be reflected as a noncontrolling
interest in CorEnergy’s consolidated financial statements. Pro forma converted column is for illustration purposes only. Investors and CorEnergy stockholders are urged to read the proxy statement (including all amendments and supplements thereto)
regarding the stock issuance and internalization and other documents relating to the transactions that will be filed with the SEC carefully and in their entirety when they become available because they will contain important information about the stock
issuance and internalization. Values assume credit facility, term loan, convertible debt and Series A and C Preferred at face value, common equity at $7.68 per share (closing price 3/2), and EBITDA at the midpoint of CORR’s FY2021 outlook of $50-
$52 million annualized beginning Q2 2021.
13CORR Outlook
Operating Outlook – Annualized 2021
• Revenue expected to be $130-$135 million
• Approximately $2.0 million of pro forma SG&A savings from estimated management fee of $5.5 million 1
• Expected run rate combined EBITDA of $50-$52 million beginning in Q2 20212 assuming no rebound in California
• Maintenance capital expenditures expected to be in the range of $10-$11 million
• Initial annual dividend of $0.20, targeting $0.35-$0.40 upon a return to pre-COVID market conditions in California, with
near term commercial opportunities providing upside3
Leverage and Balance Sheet Metrics
• Total leverage at closing of 4.4x expected EBITDA; senior secured leverage of 2.1x
• Term Loan amortization scheduled at $8.0 million per year facilitates deleveraging to a target of < 4.0x by FYE 20221 to
create financial flexibility and reduce risk
1. Investors and CorEnergy stockholders are urged to read the proxy statement (including all amendments and supplements thereto) regarding the stock issuance and internalization and other documents relating to the transactions that will
be filed with the SEC carefully and in their entirety when they become available because they will contain important information about the stock issuance and internalization. 2. 2021 EBITDA will be reconciled to GAAP metrics in periodic
reports 3. Common stock dividends are subject to approval by the board of directors
14ESG Considerations
Environmental Safety Social Responsibility Corporate Governance
Stewardship through safety of oil Mission #1: No one gets hurt Proposed shift to internal manager
& gas storage and supply
Annual investment to maintain Job creation at competitive All committees follow NYSE
integrity of assets pay in multiple states governance requirements for
independence
Operate and monitor assets using Build and maintain local, state, &
the latest technology federal regulatory relationships Board committees engage outside
advisors at company’s expense
Detailed and regularly practiced Community volunteerism
emergency response plans encouraged and prioritized Policies in place to identify and
avoid conflicts of interest
Audit performance and adjust for Culture of integrity, respect and
optimal safeguarding inclusivity internally & externally Director share ownership required
Regular communications with all Outreach and community aware-
governmental responders ness programs Risks and mitigant matrixing
prior to each investment
Work only with top-tier, proven Sponsor of multiple local charitable
contractors organizations Compensation & succession
planning
Track asset inspection Sponsor multiple school activities,
performance using benchmarking including sports team and outings
15CorEnergy: Long-Term Opportunities in the Energy Infrastructure Value Chain
• Vast opportunity set for an infrastructure
3 REIT in the current and emerging energy
2
value chain
• Asset footprint and rights of way are
difficult to replicate, and corridors can be
used for distribution of alternative energy
1 as the production and demand markets
evolve
• As the first energy infrastructure REIT with
operating assets, CORR is positioned to
lead potential consolidation of assets
16For additional information:
CorEnergy Infrastructure Trust, Inc.
Investor Relations
Debbie Hagen or Matt Kreps
877-699-CORR (2677)
info@corenergy.reit
172020 Financial Results
• 2020 resulted in setbacks at GIGS and Pinedale
• Those assets are no longer part of the portfolio
• MoGas and Omega performed steadily and executed expansion projects
For the Three Months Ended For the Year Ended
December 31, 2020 December 31, 2020
Per Share Per Share
Total Basic Diluted Total Basic Diluted
Net Income (Loss) (Attributable to Common Stockholders) 1 $ (4,981,352) $ (0.36) $ (0.36) $ (315,257,388) $ (23.09) $ (23.09)
NAREIT Funds from Operations (NAREIT FFO) 1 $ (2,923,236) $ (0.21) $ (0.21) $ (14,800,449) $ (1.08) $ (1.08)
1
Funds From Operations (FFO) $ (2,912,869) $ (0.21) $ (0.21) $ (14,939,667) $ (1.09) $ (1.09)
1
Adjusted Funds From Operations (AFFO) $ (1,881,530) $ (0.14) $ (0.14) $ 7,076,213 $ 0.52 $ 0.52
Dividends Declared to Common Stockholders $ 0.05 $ 0.90
1 The Company provides non-GAAP performance measures utilized by REITs, including NAREIT Funds From Operations (“NAREIT FFO”), Funds from Operations (“FFO”)
and Adjusted Funds from Operations (“AFFO”). Management uses AFFO as a measure of long-term sustainable operational performance. See slide 19 for a reconciliation of
NAREIT FFO, FFO and AFFO, as presented, to Net income (loss) attributable to CORR common stockholders.
18NAREIT FFO, FFO Adjusted for Securities Investment and AFFO Reconciliation (Unaudited)
For the Three Months Ended For the Years Ended
December 31, December 31,
2020 2019 2020 2019
Net Income (Loss) attributable to CorEnergy Stockholders $ (2,671,680) $ 9,807,728 $ (306,067,579) $ 4,079,495(1) For the three months ended December 31, 2020 and the years ended December
Less:
............................................................................................................................. 31, 2020 and 2019, diluted per share calculations exclude dilutive adjustments for
Preferred Dividend Requirements 2,309,672 2,313,780 9,189,809 9,255,468 convertible note interest expense, discount amortization and deferred debt
Net........................................................................................................................
Income (Loss) attributable to Common Stockholders $ (4,981,352) $ 7,493,948 $ (315,257,388) $ (5,175,973) issuance amortization because such impact is antidilutive. The three months
Add:
............................................................................................................................. ended December 31, 2019 includes these dilutive adjustments. For periods
Depreciation 2,050,475 5,512,279 13,131,468 22,046,041 presented without per share dilution, the number of weighted average diluted
Amortization of deferred lease costs
........................................................................................................................ 7,641 22,983 61,248 91,932 shares is equal to the number of weighted average basic shares presented.
Loss on impairment of leased property
....................................................................................................................... — — 140,268,379 —
Loss on impairment and disposal of leased property
....................................................................................................................... — — 146,537,547 — (2) For the three months and year ended December 31, 2019, diluted per share
Loss on termination of lease
....................................................................................................................... — — 458,297 — calculations include a dilutive adjustment for convertible note interest expense.
NAREIT.......................................................................................................................
funds from operations (NAREIT FFO) $ (2,923,236) $ 13,029,210 $ (14,800,449) $ 16,962,000
Less:
.............................................................................................................................
Income tax (expense) benefit from investment securities (10,367) 216,494 139,218 12,584
Funds........................................................................................................................
from operations adjusted for securities investments (FFO) $ (2,912,869) $ 12,812,716 $ (14,939,667) $ 16,949,416
Add:
.............................................................................................................................
Deferred rent receivable write-off — — 30,105,820 —
(Gain) loss of extinguishment of debt
........................................................................................................................ — — (11,549,968) 33,960,565
Transaction costs
........................................................................................................................ 528,113 28,115 1,673,920 185,495
Amortization of debt issuance costs
........................................................................................................................ 308,060 333,055 1,270,035 1,226,139
Accretion of asset retirement obligation
........................................................................................................................ 116,514 110,992 461,713 443,969
Income tax expense
........................................................................................................................ 78,652 33,784 54,360 247,202
........................................................................................................................
Adjusted funds from operations (AFFO) $ (1,881,530) $ 13,318,662 $ 7,076,213 $ 53,012,786
.............................................................................................................................
Weighted Average Shares of Common Stock Outstanding:
Basic 13,651,521 13,549,797 13,650,718 13,041,613
Diluted
................................................................................................................. 13,651,521 16,102,310 13,650,718 15,425,747
NAREIT.................................................................................................................
FFO attributable to Common Stockholders
Basic $ (0.21) $ 0.96 $ (1.08) $ 1.30
(1)
Diluted
................................................................................................................. $ (0.21) $ 0.94 $ (1.08) $ 1.30
.................................................................................................................
FFO attributable to Common Stockholders
Basic $ (0.21) $ 0.95 $ (1.09) $ 1.30
(1)
Diluted
................................................................................................................. $ (0.21) $ 0.92 $ (1.09) $ 1.30
.................................................................................................................
AFFO attributable to Common Stockholders
Basic $ (0.14) $ 0.98 $ 0.52 $ 4.06 19
(2)
Diluted
................................................................................................................. $ (0.14) $ 0.94 $ 0.52 $ 3.83
.................................................................................................................Crimson Midstream Transaction Terms
Crimson Acquisition - $350 million acquisition funded with: New Class B Common features:
• $75.6 million of cash on hand 1 • Dividend subordinated to common stock for
up to 3 years
• $105.0 million in new term loan and revolver borrowings
• Only receives dividends to the extent
• Contribution of the Grand Isle Gathering System (GIGS) to the sellers
common dividend coverage is equal to or
• $119.4 million of commitments to issue common and preferred equity, 2 comprised of: greater than 1.25x
• $17.2 million of new CORR Class B common shares at a share price of $7.02 • Maximum dividend equals common dividend
(90% of 30-day VWAP)
• Exchangeable 1:1 for common equity
• $60.9 million of new 4.0% Series B convertible preferred equity, $25.00 per share
• If not fully converted by year 3, conversion
(Converts into Class B common at 3.56x ratio upon stockholder approval)
adjusted downward with a minimum ratio of
• $41.3 million of new 9.0% Series C exchangeable preferred equity, $25.00 per share 0.68:1.0
(Exchanges into Series A Preferred at $23.50 under certain conditions)
Class B converts to Common upon:
• An increase in the common share dividend
Internalization of the REIT manager 2 - $16.9 million funded with: above a threshold
• $8.1 million of common shares at a share price of $7.02 • An issuance of additional common shares
(90% of 30-day VWAP) other than for management compensation
• $4.8 million of new CORR Class B common shares at a share price of $7.02 • Payment of Class B common dividend equal
(90% of 30-day VWAP) to common share dividend for four
• $4.0 million of Series A preferred equity at $23.50 per share consecutive quarters following the first
anniversary of the transaction
1. Cash on hand also used to fund $7.2 million in closing expenses and adjustments. 2. Investors and CorEnergy stockholders are urged to read the proxy statement (including all amendments and supplements thereto) regarding the stock issuance
and internalization and other documents relating to the transactions that will be filed with the SEC carefully and in their entirety when they become available because they will contain important information about the stock issuance and internalization.
20CorEnergy Senior Management
Dave Schulte John Grier
Chairman, Chief Executive Officer & President Chief Operating Officer
Mr. Grier has more than 35 years of experience in the oil and gas industry. He was
Mr. Schulte has over 25 years of investment experience, including nearly 20
Founder and President of Crimson Resource Management, Crimson Pipeline’s
years in the energy industry. Mr. Schulte was a co-founder and Managing
predecessor, and oversaw its acquisition strategy, including more than 20
Director of Tortoise Capital Advisors, an investment advisor with $16 billion
acquisitions from major oil companies. Before founding Crimson, he spent five
under management. and a Managing Director at Kansas City Equity Partners
years at Mobil Oil, where he held a number of engineering and management
(KCEP). Before joining KCEP, he spent five years in investment banking at
positions.
the predecessor of Oppenheimer & Co.
Robert Waldron Becky Sandring
Chief Financial Officer Executive Vice President, Secretary & Treasurer
Mr. Waldron has more than 15 years of experience in finance, accounting Ms. Sandring has over 20 years of experience in the energy industry with expertise
and capital markets. Prior to joining Crimson, he spent eight years in in business valuations, project and corporate finance, process efficiency and
investment banking at Citigroup and UBS, focused on midstream client implementation of complex REIT and GAAP structures. Prior to CorEnergy, Ms.
merger & acquisition activities, banking, and finance. Previously, Mr. Sandring was a Vice President with The Calvin Group. Ms. Sandring held various
Waldron worked 6 years at Dow Chemical in corporate R&D. roles at Aquila Inc, and its predecessors.
Rick Kreul Larry Alexander
President, MoGas, LLC & MoWood, LLC President, Crimson California
Mr. Kreul, a mechanical engineer with more than 35 years of energy industry Mr. Alexander, a mechanical engineer with more than 35 years of midstream
experience, serves as President of CorEnergy’s wholly-owned subsidiaries, experience, serves as President of Crimson Pipeline. Prior to joining Crimson,
MoWood, LLC and MoGas Pipeline, LLC. Previously, Mr. Kreul served as Mr. Alexander spent 25 years at Shell Pipeline in various senior positions including
Vice President of Energy Delivery for Aquila, Inc., Vice President for Inergy, construction and project management, joint ventures, operations management,
L.P., and various engineering and management roles with Mobil Oil. inspection, budget development, EH&S, business development, and tariff policy
Kristin Leitze
Chief Accounting Officer
Ms. Leitze has nearly 15 years of experience in the accounting profession.
Previously, Ms. Leitze was Director and Manager of SEC Reporting and
Compliance at CVR Energy, a diversified holding company engaged in the
petroleum refining and nitrogen fertilizer manufacturing industries. She is a
C.P.A. and has served as an auditor with PricewaterhouseCoopers, LLP.
21Crimson Has Been Built Primarily Through Relationships with the Supermajors
• John Grier, formed Crimson Resource Management (“CRM”), an upstream company, in 1986, began investing in midstream assets in
2004
• In 2010, CRM was separated into upstream and midstream companies with Grier owning the midstream assets, now known as Crimson
Midstream
• In January of 2020, Crimson was effectively split into two business segments, Gulf and California. The entities functioned as two separate
companies with different management teams and minimal employee overlap.
• In February 2021 CorEnergy announced the acquisition of Crimson California
John Grier formed Crimson Acquisition of two crude Acquisition of crude Acquisition of Delta Acquisition of KLM Crimson separates
Resource Management, an gathering systems from gathering system in North pipeline (Gulf), a pipeline (California) the company into two
upstream company Conoco in Southern Southern California legacy Chevron asset, from Chevron for businesses; New Gulf
California from Chevron for $19mm $120mm CEO hired
1986 2004 2008 2010 2011 2012 2014 2015 2016 2019 2020
CRM acquires first CRM separates into Acquisition of 9 key Gulf Acquisition of SMIGS & Acquisition of Bonefish Acquisition of San Pablo Bay
midstream business; three upstream pipelines from Shell for SLOPS pipelines (Gulf) pipelines (Gulf) from pipeline and associated assets
gathering systems in and midstream $108mm; NGP makes equity from ExxonMobil for ExxonMobil for (California) from Shell for $112mm
California from Shell businesses investment (24% interest) $15mm $175mm
22You can also read