Review of Sustainability Measures for Red gurnard (GUR 1) for 2021/22
←
→
Page content transcription
If your browser does not render page correctly, please read the page content below
Review of Sustainability Measures
for Red gurnard (GUR 1) for 2021/22

Fisheries NZ Discussion Paper No: 2021/11

ISBN No: 978-1-99-100900-5 (online)
ISSN No: 2624-0165 (online)

June 2021
Disclaimer
While every effort has been made to ensure the information in this publication is accurate, Fisheries
New Zealand does not accept any responsibility or liability for error of fact, omission, interpretation or
opinion that may be present, nor for the consequences of any decisions based on this information.

© Crown Copyright – Fisheries New Zealand
Contents                                                                            Page

1      Stock being reviewed                                                            1

2      Summary                                                                         1

3      About the stock                                                                 2
3.1    Biology                                                                         2
3.2    Fishery characteristics                                                         2

4      Quota Management System                                                         3

5      Legal basis for managing fisheries in New Zealand                               3

6      Treaty of Waitangi obligations                                                  3
6.1    Input and participation of tangata whenua                                       3
6.2    Kaitiakitanga                                                                   3

7      Relevant plans, strategies, statements and context                              4
7.1    Draft National Inshore Finfish Fisheries Plan                                   4
7.2    Hauraki Gulf Marine Park Act                                                    5
7.3    Te Mana o te Taiao (Aotearoa New Zealand Biodiversity Strategy)                 5

8      Recent catch levels and trends                                                  5
8.1    Commercial                                                                      5
8.2    Customary Māori                                                                 6
8.3    Recreational                                                                    6

9      Status of the stock                                                             7

10     Current and proposed TAC, TACC and allowance settings                          11
10.1   Option 1                                                                       11
10.2   Option 2                                                                       12
10.3   Option 3                                                                       12

11     Environmental interactions                                                     13
11.1   Marine Mammals                                                                 13
11.2   Seabirds                                                                       14
11.3   Fish Bycatch                                                                   14
11.4   Benthic Impacts                                                                15
11.5   Habitats of particular significance                                            15

12     Uncertainties and risks                                                        16

13     Deemed values                                                                  17

14     Preferential allocation rights (28 N Rights)                                   18

15     Questions for submitters on options for varying TACs, TACCs and allowances     18

16     How to get more information and have your say                                  18

17     Referenced reports                                                             18

                                                   i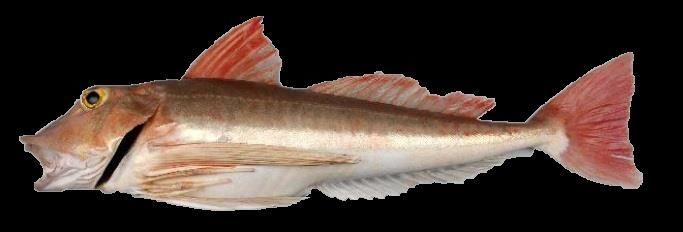
1 Stock being reviewed
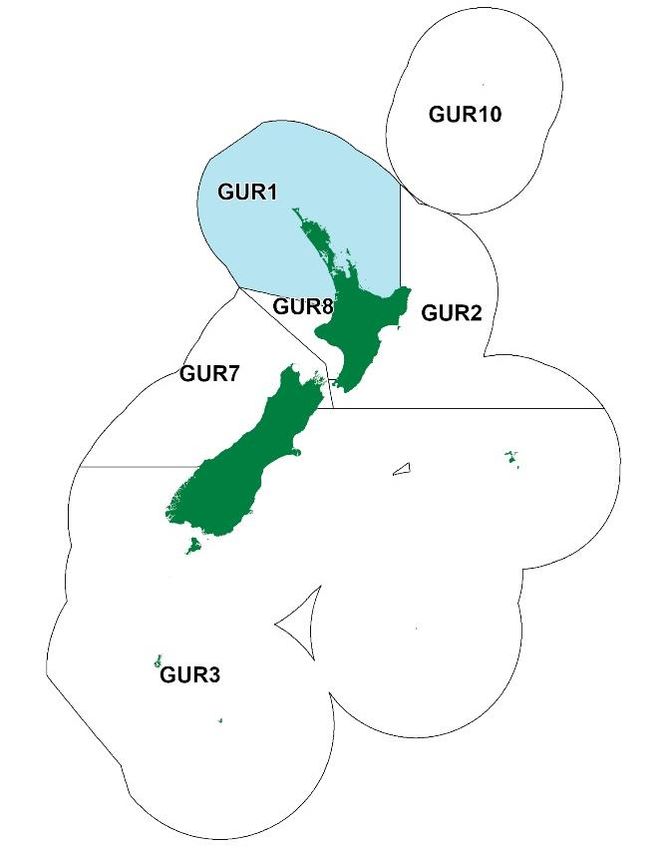
Red gurnard (GUR 1) – East and West Coasts of northern North Island
Chelidonichthys kumu, gurnard, Kumukumu
Figure 1: Quota Management Areas (QMAs) for red gurnard, with GUR 1 highlighted.
2 Summary
1. Fisheries New Zealand is reviewing sustainability measures for red gurnard in GUR 1 for the 1
October 2021 fishing year (Figure 1).
2. There is currently no Total Allowable Catch (TAC) set for GUR 1 and allowances for customary
and recreational take have not been set. There is also no allowance for other sources of
mortality caused by fishing, although, as a large portion of red gurnard catch is taken by bottom
trawl, the magnitude of this mortality could be significant.
3. The review of GUR 1 addresses a potential sustainability concern with the current management
settings.
4. The sustainability of the full Total Allowable Commercial Catch (TACC) is unknown, as there is
no estimate of biomass nor Maximum Sustainable Yield (MSY) for GUR 1. The TACC could
pose a sustainability risk if fully caught, particularly given the variability in red gurnard
recruitment.
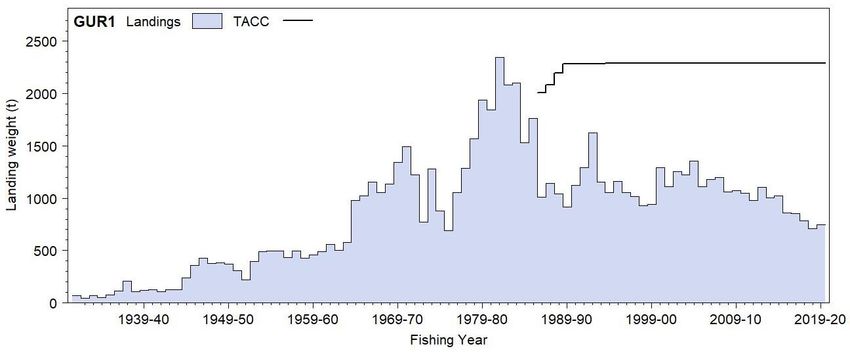
5. Since its introduction to the Quota Management System (QMS) in 1986, the TACC for GUR 1
has always been under caught. GUR 1 landings averaged about 50% of the TACC per annum
between 1986 and 2015, but a slight decline in landings more recently has seen this figure drop
to 35% between 2016 and 2020. The reason for this decline is unknown.
6. Fisheries New Zealand is proposing that a TAC and allowances for recreational take, customary
take, and other sources of mortality caused by fishing be set, and that the TACC be reduced to
address the potential sustainability risk posed by the current settings.
Fisheries New Zealand Review of sustainability measures October 2021: GUR 1 • 1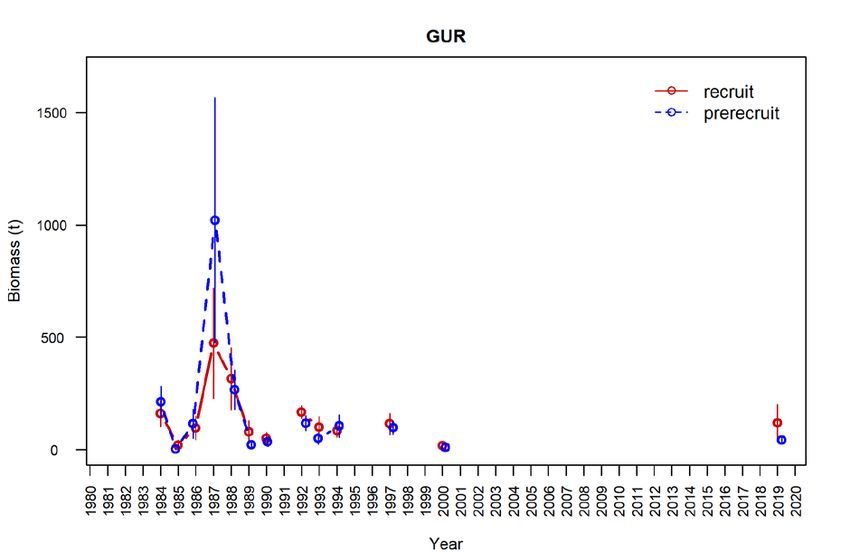
7.      The following options are proposed for GUR 1:
          Option 1 is to set a TAC of 2,328 tonnes, to make an allowance of 100 tonnes for recreational
          take, 40 tonnes for customary take, and 143 tonnes for other sources of mortality caused by
          fishing, and to reduce the TACC to 2,045 tonnes.

          Option 2 is to set a TAC of 1,317 tonnes and to set an allowance of 100 tonnes for
          recreational take, 40 tonnes for customary take, and 77 tonnes for other sources of mortality
          caused by fishing; and to reduce the TACC to 1,100 tonnes. This option reduces the potential
          sustainability risk associated with the current management settings and sets the TAC and
          TACC at levels that the best available information suggests are sustainable.

          Option 3 is to set a TAC of 996 tonnes and to set an allowance of 100 tonnes for recreational
          take, 40 tonnes for customary take, and 56 tonnes for other sources of mortality caused by
          fishing; and to reduce the TACC to 800 tonnes. This option greatly reduces the potential
          sustainability risk associated with the current management settings and responds to the recent
          (post-CPUE update) decline in landings.

8.      Fisheries New Zealand welcomes feedback and submissions on these options.

3       About the stock
3.1 Biology
9.      Red gurnard are found in Australia (as far north as southern Queensland on the east coast and
        Shark Bay on the western coast), South Africa and Mozambique, and New Zealand. In New
        Zealand, they are widely distributed from Cape Reinga to Stewart Island.

10.     The species occurs at depths of 20-180 m but are commonly found on sandy and muddy
        substrates in less than 60 m. Their diet comprises mainly of crustaceans, especially small crabs
        and shrimps.

11.     Red gurnard is a fast growing, moderately short-lived species with a maximum age of 16 years.
        They reach sexual maturity at 2-3 years old at a length of about 23 cm. Due to their fast growth
        rate and short lifespan, variation in red gurnard recruitment tends to result in large fluctuations
        in stock biomass.
12.     Red gurnard have a long spawning period which extends through spring and summer with a
        peak in early summer. Spawning grounds appear to be widespread, although perhaps localised
        over the inner and central shelf.

3.2 Fishery characteristics
13.     By virtue of its wide distribution in harbours and shallow coastal waters, GUR 1 is a shared
        fishery that is important to commercial, recreational, and customary fishers. It is sometimes
        targeted but also caught as welcome bycatch by commercial fishers targeting trevally (TRE),
        snapper (SNA), John dory (JDO), and tarakihi (TAR).

14.     GUR 1 is likely comprised of three biological stocks (West Coast, East Northland and Hauraki
        Gulf, and Bay of Plenty). This division is logical for management purposes because the
        commercial fisheries that catch red gurnard in these three regions largely act independently of
        one another, and several other species taken by the same gear in the same area are monitored
        using these same sub-stock boundaries.

15.     Each of these three GUR 1 sub-stocks are monitored and assessed using standardised catch
        per unit effort (CPUE) indices from their respective bottom trawl fisheries targeting GUR, SNA,
        TRE, TAR, or JDO.

16.     Recreational fishers in GUR 1 may take up to 20 red gurnard under the combined daily bag limit
        of 20 finfish. The minimum legal size is 25 cm. There is no commercial minimum legal size.

2 • Review of sustainability measures October 2021: GUR 1                                 Fisheries New Zealand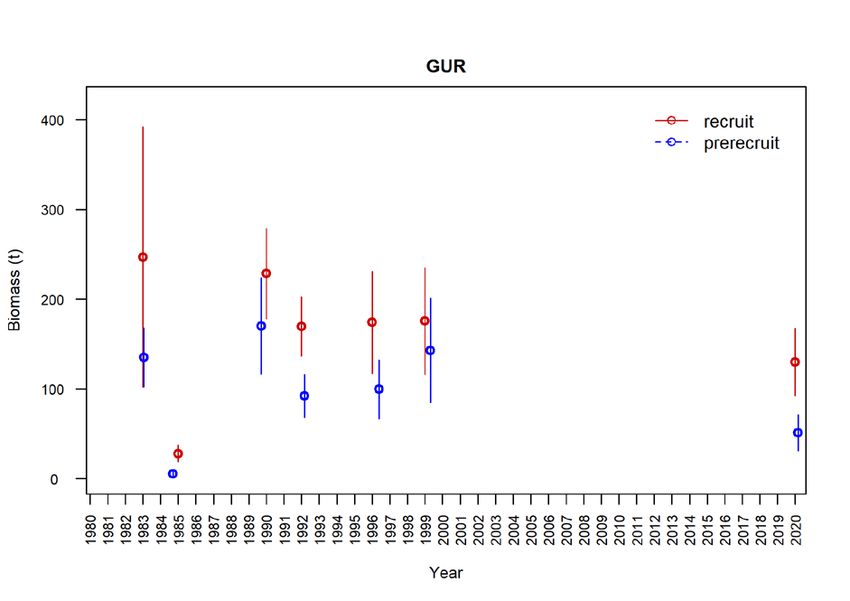
4      Quota Management System
17.    GUR 1 was introduced into the QMS in 1986. The 1986 TACC of 2,010 tonnes was based on
       the 1983 landings. Between 1986 and 1990, the TACC was gradually increased to a TACC of
       2,284 tonnes. Minor adjustments were made to the TACC in 1994 and again in 2010, when the
       TACC reached its current setting of 2,288 tonnes.

18.    For more information about the QMS go to https://www.mpi.govt.nz/law-and-policy/legal-
       overviews/fisheries/quota-management-system/.

5      Legal basis for managing fisheries in New Zealand
19.    The Fisheries Act 1996 provides the legal basis for managing fisheries in New Zealand,
       including the Minister’s responsibilities for setting and varying sustainability measures. See the
       separate document Overview of legislative requirements and other considerations at
       https://www.mpi.govt.nz/dmsdocument/45235 for more information.

6      Treaty of Waitangi obligations
6.1 Input and participation of tangata whenua
20.    Input and participation into the sustainability decision-making process is provided through Iwi
       Fisheries Forums, which have been established for that purpose. Each Iwi Fisheries Forum can
       develop an Iwi Fisheries Forum Plan that describes how the iwi in the Forum exercise
       kaitiakitanga over the fisheries of importance to them, and their objectives for the management
       of their interest in fisheries. Particular regard will be given to kaitiakitanga when making
       sustainability decisions.

21.    Iwi Fisheries Forums may also be used as entities to consult iwi with an interest in fisheries.
       Ahead of the June 2021 Iwi Fisheries Forum meetings, a short document describing the GUR 1
       stock, Fisheries New Zealand’s rationale for review, and initial management proposals was
       circulated to the northern forums with a potential interest in GUR 1: Te Hiku o Te Ika, the Mid-
       North, Nga Hapu o Te Uru o Tainui, and Mai i ngā Kuri a Whārei ki Tihirau.

22.    The Mid-North has expressed support for Fisheries New Zealand’s review of GUR 1 and
       supported a decrease to the TACC.

23.    Nga Hapu o Te Uru o Tainui expressed concern that the proposed decrease for GUR 1
       alongside a large increase to SNA 8 could result in a deemed values issue, as the two stocks
       are frequently caught together. The forum also noted that kingfish and trevally are also caught
       in the west coast trawl fishery and should also be considered.

24.    Members of Nga Hapu o Te Uru o Tainui also stated that the excess Annual Catch Entitlement
       (ACE) in GUR 1 served as a fallback option for fishers unable to source SNA ACE and several
       attributed the decline in GUR 1 landings to the Hector’s and Māui Dolphins Threat Management
       Plan (TMP), saying management measures from the TMP have led to decreases in fishable
       area and the number of operators.

25.    Fisheries New Zealand seeks further input and information on the proposed options for GUR 1
       from tangata whenua during consultation and before final advice and recommendations are
       made.

6.2 Kaitiakitanga
26.    Te Hiku o Te Ika, Mid-North, Hauraki, Nga Hapu o Te Uru oTainui, and Mai i ngā Kuri a Whārei
       ki Tihirau Iwi Fisheries Forums all include members with rohe in the GUR 1 QMA. GUR 1 is
       listed as taonga species in the fisheries plans of Mai i ngā Kuri a Whārei ki Tihirau, Nga Hapu o

Fisheries New Zealand                                       Review of sustainability measures October 2021: GUR 1 • 3
Te Uru oTainui, and Te Hiku o Te Ika. As newer forums, the Mid-North and Hauraki Collective
have not yet developed fisheries plans for their respective forums.
27. This review seeks to address a potential sustainability risk with the current management
settings. The options proposed are therefore consistent with management objectives of the Iwi
Fisheries Forum Plans, which generally relate to active engagement with iwi and the
maintenance of healthy and sustainable fisheries. Fisheries New Zealand seeks further input
from iwi to help inform final advice on this review (Table 1).
Table 1: Relevant Iwi Fisheries Forum Plans.
Iwi Fisheries Forum Relevant Fisheries Plan Management Objectives
Te Hiku o Te Ika Fish stocks are healthy and support the social, cultural
and economic prosperity of Te Hiku iwi and Hapu
Nga Hapu o Te Uru oTainui The fishery and its environment are healthy and
sustainable.
Ngaa Hapuu o Te Uru kaitiaki are able to participate in
and influence fisheries decision-making.
Mai i ngā Kuri a Whārei ki Tihirau The fisheries environment is healthy and supports a
sustainable fishery
28. Table 2 lists the customary fisheries areas that fall within the quota management area of GUR
1. As the options proposed in this paper aim to address a potential sustainability risk with GUR
1 by reducing the TACC, it is expected that these areas would benefit from the review.
Table 2: Customary Fisheries Areas in GUR 1.
Area Management Type
Aotea Harbour
Marokopa
Raukokere Mātaitai Reserve
Commercial fishing is not permitted within mātaitai
Te Kopa o Rongokānapa
reserves unless regulations state otherwise.
Te Maunga o Mauao
Te Puna
Te Rae o Kohi
Kawhia Aotea Taiāpure
All types of fishing are permitted within a Taiāpure. The
Maketu management committee can recommend regulations for
Waikare Inlet commercial, recreational and customary fishing.
29. To date, none of the customary fisheries areas listed in Table 2 have implemented regulations
restricting customary or recreational take of GUR 1.
7 Relevant plans, strategies, statements and context
7.1 Draft National Inshore Finfish Fisheries Plan
30. GUR 1 will be managed under the National Inshore Finfish Fisheries Plan (the Plan)
once finalised. The Plan outlines the management objectives and strategies for finfish fisheries
for the next five years and was consulted on in early 2020.
31. The Plan is aimed at progressing New Zealand towards ecosystem-based fisheries
management. Stocks are grouped within the Plan, with management approaches and objectives
4 • Review of sustainability measures October 2021: GUR 1 Fisheries New Zealandtailored accordingly for each group.
32. GUR 1 has been assigned to Group 2, which recognises that Fisheries New Zealand intends to
manage this stock to provide for moderate levels of use. Group 2 stocks are monitored with
partial quantitative assessments compared against trends over time.
7.2 Hauraki Gulf Marine Park Act
33. The Hauraki Gulf Marine Park (HGMP) falls within the quota management area of GUR 1,
making sections 7 and 8 of the Hauraki Gulf Marine Park Act 2000 applicable to the
management of this fishery. The Overview of Legislative Requirements and Other
Considerations document provides more information on the applicability of the Hauraki Gulf
Marine Park Act 2000.
34. As this review aims to address a potential sustainability risk with the GUR 1 management
settings, Fisheries New Zealand considers that the proposed options are consistent with
obligations under sections 7 and 8 of the Hauraki Gulf Marine Park Act 2000.
7.3 Te Mana o te Taiao (Aotearoa New Zealand Biodiversity Strategy)
35. Te Mana o te Taiao – the Aotearoa New Zealand Biodiversity Strategy sets a strategic direction
for the protection, restoration and sustainable use of biodiversity, particularly indigenous
biodiversity, in Aotearoa New Zealand. The Strategy sets a number of objectives across three
timeframes. The most relevant to setting sustainability measures for GUR 1 are objectives 10
and 12:
Objective 10: Ecosystems and species are protected, restored, resilient and connected from
mountain tops to ocean depths.
Objective 12: Natural resources are managed sustainably.
36. The Ministry for Primary Industries (MPI) is undertaking work to define specific terms used in
the Strategy (e.g. ‘environmental limits’), but is required by the Fisheries Act to manage
fisheries to balance use and sustainability, including the requirement to avoid, remedy or
mitigate adverse effects on the aquatic environment. The Ecosystem Interactions section in this
paper provides information on relevant interactions with the wider aquatic environment for this
stock.
8 Recent catch levels and trends
8.1 Commercial
37. The TACC for GUR 1 has never been caught. Average annual landings of GUR 1 were about
50% of the TACC between 1986 and 2015. Since the 2009 fishing year, landings have been
declining. A more substantial decline between 2016 and 2020 has seen average annual
landings drop to 35% of the TACC (Figure 2). The reason for this decline is not known.
Fisheries New Zealand Review of sustainability measures October 2021: GUR 1 • 5Figure 2: Commercial landings of GUR 1 against the TACC.
38. The majority (60-70%) of the total GUR 1 commercial catch is taken from the west coast sub-
stock (GUR 1W). The remaining GUR 1 commercial catch is usually split fairly evenly between
the East Northland and Hauraki Gulf (GUR 1E) and Bay of Plenty (GUR 1BP) sub-stocks.
39. In the GUR 1W sub-stock, approximately 80-90% of red gurnard catch is taken by bottom trawl
as part of the FMA 9 mixed trawl fishery. CPUE analyses and discussions with fishers
undertaken for the SNA 8 stock assessment have identified that operators fishing on the west
coast have modified their gear and trawl speeds to increase targeting of GUR 1 in recent years.
This is largely due to a lack of SNA 8 ACE availability and subsequent attempts to minimise
SNA by-catch.
40. Catch of GUR 1E is split between the bottom longline, bottom trawl, and Danish seine methods.
The majority of GUR 1BP catch is taken by Danish seine, while a smaller proportion is taken by
bottom trawl and bottom longline.
41. The proportion of catch taken from each sub-stock does not appear to have changed in recent
years. In the past five fishing years, the most consistent decline in GUR 1 landings has occurred
in GUR 1E, while the largest magnitude decline in landings has occurred in the GUR 1W sub-
stock.
42. The decline in landings in the GUR 1W sub-stock despite increased targeting may indicate that
biomass is declining, perhaps due to a period of below average recruitment. It is also possible
that GUR 1 abundance in the western sub-stock may be declining due to interspecific
competition for food with SNA 8, which has seen a large increase in biomass.
8.2 Customary Māori
43. The customary allowance for GUR 1 has not yet been set. Fisheries New Zealand holds
insufficient information to estimate current customary catch. The Fisheries (Kaimoana
Customary Fishing) Regulations 1998 have not been implemented in all of GUR 1. In the areas
where they have not been implemented, there is no requirement for customary fishers to report
their catch. It is also likely that tangata whenua are using recreational catch to meet their needs
in GUR 1.
44. Fisheries New Zealand’s records show that 56 customary authorisations were granted for the
take of GUR 1 between 2001 and 2019, but the quantities taken are not known.
45. Fisheries New Zealand welcomes tangata whenua’s views on the sufficiency of the proposed
customary allowance.
8.3 Recreational
46. The recreational allowance for GUR 1 has not yet been set. The National Panel Survey of
Marine Recreational Fishers (NPS) constitutes the best available information on recreational
harvest. The 2017/18 NPS estimated GUR 1 recreational harvest to be 86 tonnes (Table 3).
6 • Review of sustainability measures October 2021: GUR 1 Fisheries New ZealandThis is a decrease from the estimate of recreational harvest produced for the 2011/12 fishing
year, although there is some uncertainty associated with these estimates.
Table 3: Recreational harvest estimates for GUR 1.
Year Method Number of fish Total weight (t) CV (t)
2011/12 Panel survey 241 957 103 ±15 tonnes
2017/18 Panel Survey 168 798 86 ±13 tonnes
9 Status of the stock
47. The status of the GUR 1 stock is assessed for each of the three sub-stocks that align with the
major GUR 1 fisheries: GUR 1W, GUR 1E, and GUR 1BP. Management is guided by BMSY-
compatible target and limit reference points developed for each of these sub-areas based on
the mean CPUE of the bottom trawl (tow) series in that sub-area over the period of the 1995/96
to 2011/12 fishing years. The soft limit and hard limit reference points are 50% and 25% of the
target reference points, respectively.
48. The CPUE indices exhibit cyclical fluctuations that are consistent with the biomass fluctuations
seen in short-lived, fast growing species like red gurnard.
49. According to the 2021 Fisheries Assessment Plenary, the standardised CPUE assessments for
each of the GUR 1 sub-stocks were last updated in 2017, covering commercial catch and effort
through the end of the 2015/16 fishing year. The CPUE indices for each of the sub-stocks are
presented below (Figures 3-5).
GUR 1W
Target limit
Soft limit
Hard limit
average relative exploitation rate
(landings divided by
standardised CPUE and
normalised to a geometric mean
of one) during reference period
Figure 3: Top panel: landings (open circles) and standardised CPUE (combined model using tow by tow data from
1995–96, ±2 s.e.). Bottom panel: annual relative exploitation rate for red gurnard in the GUR 1 west coast
sub-stock.
Fisheries New Zealand Review of sustainability measures October 2021: GUR 1 • 7GUR 1E
Target limit
Soft limit
Hard limit
average relative exploitation rate
(landings divided by
standardised CPUE and
normalised to a geometric mean
of one) during reference period
Figure 4: Top panel: landings (open circles) and standardised CPUE (combined model using tow by tow data from
1995–96, ±2 s.e.). Bottom panel: annual relative exploitation rate for red gurnard in the GUR 1 east coast
sub-stock.
GUR 1BP
Target limit
Soft limit
Hard limit
average relative exploitation rate
(landings divided by
standardised CPUE and
normalised to a geometric mean
of one) during reference period
Figure 5: Top panel: landings (open circles) and standardised CPUE (combined model using tow by tow data from
1995–96, ±2 s.e.). Bottom panel: annual relative exploitation rate for red gurnard in the Bay of Plenty.
8 • Review of sustainability measures October 2021: GUR 1 Fisheries New Zealand50. Based on the 2017 standardised CPUE assessments, the Inshore Working Group concluded
that the GUR 1W sub-stock was very likely (> 90%) to be at or above the target, while the GUR
1E and 1BP sub-stocks were about as likely as not (40–60%) to be at or above the target. The
GUR 1W sub-stock was very unlikely (< 10%) to be below the soft and hard limits, while the
GUR 1E and BP sub-stocks were unlikely (< 40%) to be below the soft limit and very unlikely (<
10%) to be below the hard limit. This suggests that catch levels for all three sub-stocks were
sustainable at that time, although the western sub-stock was faring better than the two eastern
ones.
51. Since the 2015/16 fishing year, GUR 1 landings appear to have been declining. This may
indicate poor recruitment and a decline in GUR 1 biomass, or it may indicate a change in fisher
behaviour. Fisheries New Zealand is unable to draw any conclusions about this recent decline
in landings until the CPUE indices and accompanying characterisation of the GUR 1 fishery are
updated in 2022/23.
52. Recent inshore trawl surveys conducted on both coasts of the North Island (INT 2018-02 and
INT2018-03) have been used to produce relative biomass estimates for red gurnard within the
three sub-areas of GUR 1.
53. The West Coast North Island (WCNI) trawl survey was reinstated in 2017 after a 19-year hiatus.
The relative biomass series for the core area of the survey, which covers the GUR 1W sub-
stock, indicates substantially lower total biomass of red gurnard in 2018, 2019, and 2020 when
compared to the earlier estimates in the series. The 2019 and 2020 relative biomass estimates
were slightly higher than the 2018 estimate, which was the lowest estimate in the series. (See
Figure 6 below).
54. The difference between the recruited biomass estimates for recent and older surveys is not as
pronounced, suggesting that much of the recent decline in total biomass is attributable to a
decline in pre-recruit biomass, potentially signifying poor recruitment to come in the GUR 1W
sub-stock.
Figure 6: Biomass trends with 95% confidence intervals for recruited (>30cm) (dashed green line) and all
(solid black line) GUR within the core area of the West Coast North Island trawl surveys.
55. Trawl surveys conducted in the Hauraki Gulf and Bay of Plenty in 2019 and 2020, respectively,
generated relative biomass estimates for red gurnard in the east coast sub-stocks. Prior to this
iteration, the surveys were last conducted in 2000. With only one recent data point for each
Fisheries New Zealand Review of sustainability measures October 2021: GUR 1 • 9area, Fisheries New Zealand is unable to draw conclusions on recent trends in red gurnard
relative biomass.
56. The 2019 estimate for red gurnard biomass in the Hauraki Gulf (part of the GUR 1E sub-stock)
was higher relative to the preceding survey in 2000, but much lower than the series high in 1987
(Figure 7). The survey also found a male: female ratio of 0.31:1, which is a stronger female bias
than documented in previous surveys.
Figure 7: Biomass trends with 95% confidence intervals for pre-recruit (dashed blue line) and recruited (solid red
line) GUR for the Hauraki Gulf surveys.
57. Red gurnard biomass in the Bay of Plenty appears to have declined relative to the preceding
surveys between 1989 and 2000, although there is some overlap in the confidence intervals
(Figure 8). Pre-recruit biomass in the 2020 survey is noticeably lower than that of previous
surveys. A stronger female bias than documented in previous surveys was also evident here,
where the male: female ratio was 0.67:1.
Figure 8: Biomass trends with 95% confidence intervals for pre-recruit (dashed blue line) and recruited (solid red
line) GUR for the Bay of Plenty surveys.
10 • Review of sustainability measures October 2021: GUR 1 Fisheries New Zealand10 Current and proposed TAC, TACC and allowance settings
58. A TAC has not been set for GUR 1. Three options are proposed for the TAC, TACC, and
allowances for GUR 1. Fisheries New Zealand invites views on these proposed options (Table
4).
59. In each option, a customary allowance of 40 tonnes has been proposed for discussion.
Fisheries New Zealand seeks input from tangata whenua as to whether this proposed
allowance adequately provides for customary take.
60. Each option includes a proposed recreational allowance based on the best available information
on recreational harvest, which is provided by the 2017/18 National Panel Survey. Fisheries New
Zealand proposes a recreational allowance be set at 100 tonnes, based on the recreational
harvest of 86 tonnes ± 13 tonnes estimated from the 2017/18 panel survey (and rounded up to
100 for simplicity). Fisheries New Zealand is not proposing to review the current recreational
daily bag limit of 20 red gurnard per person per day, nor to review the minimum legal size for
recreationally caught red gurnard in GUR 1.
61. An allowance for other sources of mortality is intended to account for any mortality to a fish
stock that occurs due to fishing activity but is not otherwise accounted for in the TAC. Potential
sources of other mortality for GUR 1 could include: unreported commercial bycatch; mortality
associated with injury from red gurnard contacted but not captured by trawl and Danish seine
nets; mortality associated with recreational catch and release of red gurnard, especially those
below the minimum legal size; and mortality associated with the accidental loss or damage of
fishing gear.
62. Because the vast majority of the GUR 1 landings are taken by the commercial sector, it is
reasonable to expect that the vast majority of other mortality caused by fishing in GUR 1 to be
attributable to the commercial sector.
63. Fisheries New Zealand is proposing that the allowance for other mortality caused by fishing be
set at approximately 7% of the TACC for GUR 1, across all options. In the October 2018
sustainability round, the then Minister of Fisheries indicated a preference for setting this
allowance at approximately 10% of the TACC for inshore stocks caught predominantly by trawl
in the absence of information to suggest an alternative approach is more appropriate.
64. In the case of GUR 1, Fisheries New Zealand considers a level around 7% of the TACC is more
appropriate for two reasons.
• Enhanced monitoring on the west coast North Island means Fisheries New Zealand has
greater confidence in the catch and effort reported for the western sub-stock.
• A substantial portion (~20-30%) of GUR 1 is taken by the more selective methods of
bottom longlining and Danish seining, which are less likely to cause incidental mortality.
Table 4: Summary of current and proposed catch settings for GUR 1 from 1 October 2021. Figures are all in tonnes.
Figures in parentheses indicate the change from current settings.
Allowances
Option TAC TACC Customary All other mortality
Recreational
Māori caused by fishing
Current settings N/A 2,288 N/A N/A N/A
Option 1 2,328 2,045 (243 t) 40 100 143
Option 2 1,317 1,100 (1,188 t) 40 100 77
Option 3 996 800 (1,488 t) 40 100 56
10.1 Option 1
65. Setting the TAC at 2,328 tonnes and reducing the TACC by 243 tonnes to create allowances for
recreational, customary, and other mortality caused by fishing preserves most of the potential
Fisheries New Zealand Review of sustainability measures October 2021: GUR 1 • 11catch in the current management settings. This option will have the least impact on the
commercial sector and ensures the sector has the flexibility to increase its catch.
66. This flexibility may be particularly valuable to fishers fishing the GUR 1W sub-stock, as the
outcome of the SNA 8 review and the recent expansion of the trawl exclusion zone will both
influence behaviour in the FMA 9 mixed trawl fishery. How fishers respond to these
management changes remains to be seen, and it may be prudent to refrain from making
significant changes to the management settings of GUR 1 until the effects of these changes on
the FMA 9 mixed trawl fishery are better understood.
67. However, given the consistently low trend in catch of GUR 1 in comparison to the TACC and the
recent decline in landings evident since the last CPUE update in 2017, the TAC and TACC
settings proposed in this option could present a sustainability risk to GUR 1. Maintaining the
TACC at a level well above demonstrated catch would provide the commercial sector with the
potential to take catch that would likely exceed sustainable levels, based on recent CPUE
information.
10.2 Option 2
68. Option 2 sets the TAC at 1,317 tonnes and the TACC at 1,100 tonnes. This option brings the
TACC closer to the average annual landings of 1,072 tonnes since GUR 1 was introduced to
the QMS. It also closely approximates the most recent peak in landings, when 1,103 tonnes
were landed in the 2012/13 fishing year.
69. This option removes most of the uncaught TACC evident in the current management settings. It
reduces the potential sustainability risk associated with fully catching the current TACC by
bringing the catch limit in line with the demonstrated level of commercial take.
70. This option is predicated on the CPUE updates in 2016, which did not raise any sustainability
concerns with catch levels at that time. This option does not respond to the more recent decline
in GUR 1 landings seen over the past five years, nor the trends in relative biomass documented
by recent trawl surveys, which could indicate a decline in GUR 1 abundance.
71. Based on recent catch patterns, this option is unlikely to constrain catch of GUR 1 and is not
expected to result in economic costs to fishers, beyond any associated changes to ACE price.
However, changes to the management settings for SNA 8 could potentially result in different
fishing patterns in FMA 9. In this eventuality, catch levels in the GUR 1W sub-stock may
change, potentially resulting in this option a having a constraining effect on GUR 1 catch.
10.3 Option 3
72. Option 3 sets the TAC at 996 tonnes and the TACC at 800 tonnes.
73. This option presents a more precautionary management approach that responds to the recent
decline in GUR 1 landings over the past five years, during which the average landings has been
792 tonnes, and the concerning signals from the recent trawl surveys. Based on recent trends
in landings, a TACC of 800 tonnes would actively constrain catch in some years.
74. The CPUE indices were last updated four years ago and are not expected to be updated again
until 2023. Given red gurnard’s fast growth and relatively short lifespan, it is possible that
GUR 1 biomass could change substantially within that seven-year window and that the recent
decline in landings is already indicating a potential sustainability risk to the stock. In this case, a
substantial reduction in the TAC and TACC would not be inconsistent with the objective of
maintaining the stock at or above, or moving the stock towards or above, the MSY level.
75. Red gurnard tend to have large environmentally driven cycles in abundance. It is possible that,
in years where recruitment is good, Option 3 would be overly conservative and could result in
situations where the GUR 1 TACC limits fishers’ ability to take the TACC of other co-occurring
species, even in the absence of a sustainability risk to the GUR 1 stock. Fisheries using less
selective methods, such as the bottom trawl fishery in FMA 9, would be most affected by an
unnecessarily constraining TACC. More frequent monitoring and review of the GUR 1 TACC
would enable fisheries management to be more responsive to changes in GUR 1 abundance.
12 • Review of sustainability measures October 2021: GUR 1 Fisheries New Zealand11 Environmental interactions
76. The key environmental interactions with this fishery, which must be taken into account when
considering sustainability measures concern marine mammals, seabirds, fish bycatch, benthic
impacts, and habitats of particular significance.
77. The proposals in this paper aim to address a potential sustainability risk with GUR 1 by setting a
TAC and allowances and, in the cases of Options 2 and 3, removing the significant excess
evident in the current TACC. A TACC that is aligned with industry’s demonstrated capability is
unlikely to lead to any changes in fishing behaviour, meaning new or increased impacts on
bycatch species, protected species, or the benthic environment are unlikely.
78. However, any change in the TAC and TACC of one stock caught in a multispecies fishery, like
the FMA 9 mixed trawl fishery, may impact fishers’ ability to take their ACE for the other stocks
caught in that fishery. This could prompt fishers to change their behaviour. Any significant
change in fishing behaviour, such as area/depth fished, gear configuration, and species
targeted, has the potential to create new or increased impacts on bycatch species, protected
species, or the benthic environment.
79. Increased observer coverage and cameras onboard some vessels will enhance Fisheries New
Zealand’s abilities to monitor environmental interactions along the upper west coast of the North
Island (refer back to section 10).
11.1 Marine Mammals
80. Marine mammal interactions by vessels taking GUR 1 are relatively rare. Of the vessels that
take GUR 1, those using the bottom trawl method have reported the highest number of
interactions. In the last three full fishing years, bottom trawl vessels targeting red gurnard,
snapper, John dory, tarakihi, or trevally in GUR 1 have reported five marine mammal
interactions: three captures of dead New Zealand fur seals, one capture of an uninjured
bottlenose dolphin, and one capture of a dead pilot whale.
81. In 2020, as part of the fisheries measures under the Hector’s and Māui Dolphins Threat
Management Plan, the area closed to bottom trawling along the west coast of the North Island
was increased from 1 nm from the shoreline out to 4 nm between Maunganui Bluff and Tirua
Point.
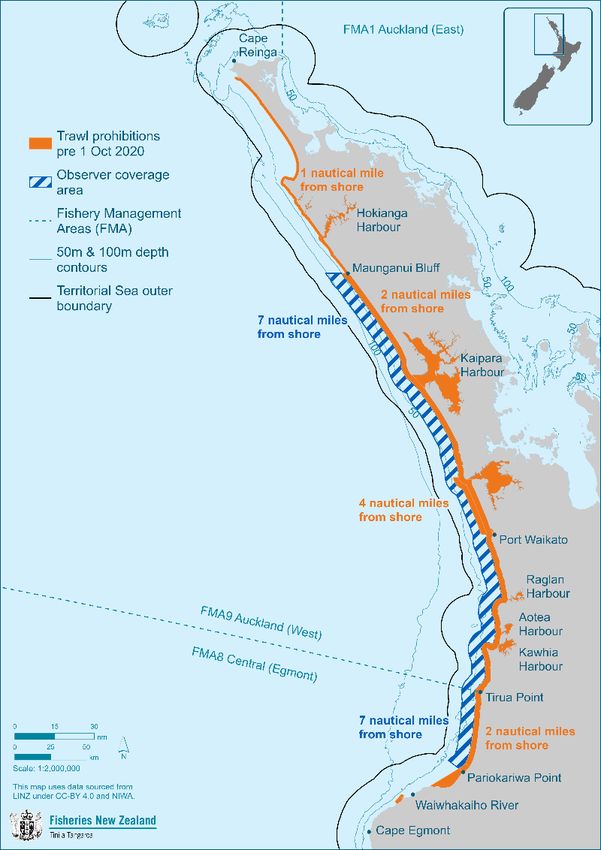
82. Observer coverage in the west coast North Island nearshore has been particularly high since
2014 to monitor for potential interactions with Māui dolphins (Figure 9). This enhanced
coverage area corresponds with a significant proportion of the area in which the GUR 1 sub-
stock is taken but does not extend to statistical area 047 nor does it cover all of 046. In addition
to enhanced observer coverage, a number of trawl and set net vessels operating on the west
coast North Island have installed onboard cameras.
Fisheries New Zealand Review of sustainability measures October 2021: GUR 1 • 13Figure 9: Observer coverage on trawl vessels in the Maūi dolpin zone.
83. The options proposed in this paper are not expected to increase marine mammal captures in
GUR 1.
11.2 Seabirds
84. The management of seabird interactions with New Zealand’s commercial fisheries is guided by
the National Plan of Action to Reduce the Incidental Captures of Seabirds in New Zealand
Fisheries (NPOA-Seabirds).
85. Seabirds can accidentally get caught during commercial fishing. Commercial fishers must file
daily reports about what they have caught. Fisheries New Zealand is now releasing these
reports quarterly (from the 2019/20 fishing year). You can view this information on our webpage:
https://www.mpi.govt.nz/science/open-data-and-forecasting/fisheries/seabirds-and-protected-
marine-species-caught-by-commercial-fishers/
86. The Spatially Explicit Fisheries Risk Assessment ranks bird species according to their risk from
commercial fisheries. The 2020 assessment identified black petrel as the most at-risk seabird,
followed by five taxa in the second-highest category: Salvin’s albatross, Westland petrel, flesh-
footed shearwater, southern Buller’s albatross and Gibson’s albatross. The seabirds most
commonly caught by vessels catching GUR 1 include flesh-footed shearwaters, black petrels,
and sooty shearwaters.
87. The options proposed in this paper are not expected to increase seabird captures in GUR 1
11.3 Fish Bycatch
88. GUR 1 is taken primarily in multispecies fisheries alongside snapper, trevally, tarakihi, and John
dory. As the options proposed in this paper suggest reduced TACCs, an increase in fish
14 • Review of sustainability measures October 2021: GUR 1 Fisheries New Zealandbycatch as a result of this review is unlikely. The increases proposed in the SNA 8 review,
however, may lead to greater fishing effort and consequently greater bycatch of other species in
the FMA 9 bottom trawl multispecies fishery.
11.4 Benthic Impacts
89. All three of the main methods used to take GUR 1 may impact benthic habitats. Vessels using
the bottom trawl, bottom long line, and Danish seining methods within GUR 1 report catches of
corals, bryozoans, and sponges. The options proposed in this paper are not expected to
increase benthic impacts within GUR 1.
11.5 Habitats of particular significance
90. The broad distribution and long spawning period of red gurnard makes it difficult to pinpoint
specific areas of particular significance to the species. Two habitats that may be considered
habitats of particular significance for red gurnard in GUR 1 are listed in Table 5 below.
Table 5: Summary of information on habitats of particular significance for GUR 1.
Fish Stock GUR 1
Habitat • Spawning migration area in the Hauraki Gulf,
between the inner gulf and Craddock Channel
(between Little Barrier and Great Barrier Island).
Attributes of habitat • In the 1970s, Elder found evidence of a seasonal
spawning migration offshore between the inner
Hauraki Gulf and Craddock Channel (Elder, 1976).
• Catch rates, particularly for females, suggested a
seasonal spawning migration during the spring and
summer months. A corresponding post-spawning
migration of spent fish occurring in the reverse
direction was also documented.
• This movement from shallow to deeper water is likely
to be related to water temperature.
Reasons for particular • Successful spawning is critical to supporting the
significance productivity of the stock.
Risks/Threats • Mobile bottom contact fishing is permitted in the
outer Hauraki Gulf, including in Craddock Channel.
These methods contact the seafloor, disturbing
benthic habitats. What makes Craddock Channel
particularly favourable for red gurnard spawning is
unknown, so the extent to which mobile bottom
contact fishing may impact their spawning here is
unclear.
• Changes in water temperature and water circulation.
Protections in Place • Mobile bottom contact fishing (bottom trawling,
dredging, and Danish seining) are prohibited in the
inner Hauraki Gulf.
• Vessels greater than 46 m are prohibited from
trawling anywhere in FMA 1.
Fish Stock GUR 1
Habitat • Shallow harbours and estuaries during the summer
months, particularly along the upper west coast of
the North Island.
Attributes of habitat • Juveniles that had recently settled have been found
in shallow harbours and estuaries during the summer
months of February and March, particularly along the
upper west coast of the North Island. These have
only been found in low numbers.
Fisheries New Zealand Review of sustainability measures October 2021: GUR 1 • 15Reasons for particular • May provide sheltered habitat for juvenile red
significance gurnard.
• May provide refuge from predation.
Risks/Threats • The condition of many shallow harbours and
estuaries has been compromised by non-fishing
activities, including agricultural and urban runoff and
sedimentation.
• Recreational dredging in some northern harbours
may compromise benthic habitats that provide
protection for juvenile fish and food sources.
• Changes in water temperature and water circulation.
Protections in Place • All harbours and estuaries in FMAs 1 and 9 are
protected from commercial trawling, Danish seining,
and dredging. Additionally, the Kaipara Harbour was
also closed to recreational scallop fishing in 2018,
which could reduce recreational dredging.
• The new National Policy Statement on Freshwater
Management and the National Environmental
Standards for Freshwater, which came into effect on
3 September 2020, should lead to improved water
quality in shallow harbours and estuaries.
91. While not directly implemented to protect GUR 1 habitats, there are 12 marine reserves that fall
within the GUR 1 QMA. Commercial and recreational take from these areas is prohibited. All 12
have been in place for at least 10 years. A map of marine reserves can be viewed on the
Department of Conservation’s website at:
https://www.doc.govt.nz/map/index.html?layers=Public%20conservation%20areas.
92. The options proposed in this paper are not expected to threaten habitats of significance within
GUR 1.
12 Uncertainties and risks
Status of the Stock
93. The primary uncertainty regarding GUR 1 is the current status of the stock. When the CPUE
indices were last updated through to the end of the 2015/16 fishing year, there were no
indications of a potential sustainability risk to the stock. However, since the updates, GUR 1
landings have declined. Annual landings over the past five years have been at their lowest level
since GUR 1 was introduced into the QMS.
94. The cause of this decline in landings is unknown and, until the CPUE indices and fishery
characterisation are updated, Fisheries New Zealand cannot say for certain whether or not the
decline indicates a sustainability concern.
Implications of SNA 8 Review
95. The review of SNA 8 could have implications for the GUR 1W sub-stock, as both are caught by
the FMA 9 mixed trawl fishery. An increase in the TAC and TACC for SNA 8 could lead to
greater fishing effort in SNA 8 and, consequently, increased catches of GUR 1W. Alternatively,
fishers may simply modify their behaviour to increase targeting of SNA 8, in which case fewer
gurnard may be caught due to changes in areas fished and/or gear configurations.
Impacts on the GUR 1 ACE Market
96. The potential for reductions in the TACC to impact on the availability and price of ACE. is not a
statutory consideration for setting or varying the TAC but rather a natural consequence of
addressing a potential sustainability risk to the stock.
16 • Review of sustainability measures October 2021: GUR 1 Fisheries New Zealand97. As the options proposed reflect current levels of catch in the most recent years, it is unlikely that
reductions in the TACC would significantly impact on ACE prices. With approximately 31% of
available ACE utilised over the last five complete fishing years, it is reasonable to expect that
the ACE market would be able to withstand reductions in the TACC without major changes in
the ACE price.
13 Deemed values
98. Deemed values are the price paid by fishers for each kilogram of unprocessed fish landed in
excess of a fisher’s ACE holdings. The purpose of the deemed values regime is to provide
incentives for individual fishers to acquire or maintain sufficient ACE to cover catch taken over
the course of the year, while allowing flexibility in the timing of balancing, promoting efficiency,
and encouraging accurate catch reporting.
99. The Deemed Value Guidelines set out the operational policy Fisheries New Zealand uses to
inform the development of advice to the Minister on the setting of deemed values.
100. The deemed value rates for GUR 1 are shown in Table 6.
Table 6: Standard deemed value rates ($/kg) for GUR 1.
Interim Rate Annual Differential Rates ($/kg) for excess catch (% of ACE)
($/kg) 100-120% 120-140% 140-160% 160-180% 180-200% 200%+
Status quo 1.53 1.70 2.04 2.38 2.72 3.06 3.40
101. The average price paid by fishers during the 2019/20 fishing year for one kilogram of GUR 1
ACE was $1.01. The 2019/20 port price index of GUR 1 was $2.93 (Figure 10).
$3.50 Avg ACE Transfer price Avg Port Price Deemed Value Interim Rate
$3.00 $2.93
$2.50
$/kg GUR 1
$2.00
$1.53
$1.50
$1.00 $1.01
$0.50
$0.00
Starting Fishing Year
Figure 10: Average ACE transfer price, average port price, and deemed value interim rate for GUR 1
2001-present.
102. As the current deemed value rates of GUR 1 are set slightly above the average ACE price, no
changes are proposed to the deemed value rates at this time. Fisheries New Zealand
acknowledges that if the TACC is reduced, subsequent changes in fishing behaviour and the
ACE market may result in the need for the deemed value to be re-evaluated in the future.
Fisheries New Zealand welcomes any feedback on this.
Fisheries New Zealand Review of sustainability measures October 2021: GUR 1 • 1714 Preferential allocation rights (28 N Rights)
103. There are 63.9 tonnes of preferential allocation (‘28 N’) rights associated with the GUR 1 stock.
Preferential allocation rights were granted to permit holders under section 28N of the Fisheries
Act 1983 who elected to take administrative rather than compensated reductions to their catch
allocations. When the TACC is increased for a stock that has 28N rights associated with it, the
quota shares of owners who do not have 28N rights are reduced and redistributed to the
holders of 28N rights. As the options in this paper suggest reducing the TACC, 28N rights for
GUR 1 are not expected to be triggered as a result of this sustainability round.
15 Questions for submitters on options for varying TACs,
TACCs and allowances
• Which option do you support for revising the TAC and allowances? Why?
• If you do not support any of the options listed, what alternative(s) should be considered?
Why?
• Are the allowances for customary Māori, recreational and other sources of mortality
appropriate? Why?
• Do you think these options adequately provide for social, economic, and cultural wellbeing?
• Do you have any concerns about potential impacts of the proposed options on the aquatic
environment?
104. We welcome your views on these proposals. Please provide detailed information and sources to
support your views where possible.
16 How to get more information and have your say
105. Fisheries New Zealand invites you to make a submission on the proposals set out in this
discussion document. Consultation closes at 5pm on 27 July 2021.
106. Please see the Fisheries New Zealand sustainability consultation webpage
(https://www.mpi.govt.nz/consultations/review-of-sustainability-measures-2021-october-round)
for related information, a helpful submissions template, and information on how to submit your
feedback. If you cannot access to the webpage or require hard copies of documents or any
other information, please email FMSubmissions@mpi.govt.nz.
17 Referenced reports
Department of Conservation and Fisheries New Zealand (2019). Hector’s and Māui Dolphin Threat
Management Plan. Latest review accessible at: https://www.mpi.govt.nz/consultations/hectors-
and-maui-dolphins-threat-management-plan-review/
Department of Conservation and Fisheries New Zealand (2020). National Plan of Action — Seabirds
2020. Accessible at: https://www.mpi.govt.nz/dmsdocument/40652-National-Plan-Of-Action-
Seabirds-2020-Report
Elder, R.D. (1976). Studies on age and growth, reproduction, and population dynamics of red gurnard,
Chelidonichthys kumu (Lesson and Garnot), in the Hauraki Gulf, New Zealand. Fisheries
Research Bulletin, No.12. 77 p.
Fisheries New Zealand (2011). Operational Guidelines for New Zealand’s Harvest Strategy Standard.
Accessible at: https://www.mpi.govt.nz/dmsdocument/19706-OPERATIONAL-GUIDELINES-
FOR-NEW-ZEALANDS-HARVEST-STRATEGY-STANDARD
18 • Review of sustainability measures October 2021: GUR 1 Fisheries New ZealandFisheries New Zealand (2019). Draft National Inshore Finfish Fisheries Plan. Accessible at:
https://www.mpi.govt.nz/consultations/draft-national-inshore-finfish-fisheries-plan/
Fisheries New Zealand (2020). Guidelines for the review of deemed value rates for stocks managed
under the Quota Management System. Accessible at:
https://www.mpi.govt.nz/dmsdocument/40250/direct
Fisheries New Zealand (2021). Fisheries Assessment Plenary, May 2021: stock assessments and
stock status. Compiled by the Fisheries Science and Information Group, Fisheries New
Zealand, Wellington, New Zealand. Accessible at: https://www.mpi.govt.nz/science/fisheries-
science-research/about-our-fisheries-research
Francis, M.P. et al. (2002). New Zealand demersal fish assemblages. Environmental Biology of
Fishes, 65, 215-234.
Hauraki Gulf Marine Park Act (2000). Accessible at:
https://www.legislation.govt.nz/act/public/2000/0001/latest/DLM52558.html
Jones, E. & R. Bian (2021). West Coast Trawl Survey 2020: Preliminary results for other target
species. (Working Group paper held by Fisheries New Zealand.)
Kendrick, T H; Bentley, N (2017) Updated CPUE Analyses for three substocks of red gurnard in GUR
1. (Working Group paper held by Fisheries New Zealand.)
Morrison, M.A. et al. (2014). Habitats and areas of particular significance for coastal finfish fisheries
management in New Zealand: A review of concepts and life history knowledge, and suggestions
for future research. New Zealand Aquatic Environment and Biodiversity Report No.125.
https://fs.fish.govt.nz/Doc/23523/AEBR_125_2638_ENV2010-03%20Obj%201-
2,%20MS1,%203,%204,%206.pdf.ashx
New Zealand Government (2020). Te Mana o te Taiao - Aotearoa New Zealand Biodiversity Strategy 2020.
Accessible at: https://www.doc.govt.nz/nature/biodiversity/aotearoa-new-zealand-biodiversity-
strategy/
Parsons, D.M. et al. (2021). Trawl surveys of the Hauraki Gulf and Bay of Plenty in 2019 and 2020 to
estimate the abundance of juvenile snapper. New Zealand Fisheries Assessment Report
2021/08. https://fs.fish.govt.nz/Doc/24856/FAR-2021-08-Hauraki-Gulf-2019-Bay-Of-Plenty-
2020-Trawl-Surveys-4125.pdf.ashx
Richard, Y. et al. (2020). Assessment of the risk of commercial fisheries to New Zealand seabirds,
2006–07 to 2016–17. New Zealand Aquatic Environment and Biodiversity Report, No. 237.
https://www.mpi.govt.nz/dmsdocument/39407/direct
Wynne-Jones, J.; Gray, A.; Hill, L.; Heinemann, A. (2014) National Panel Survey of Marine Recreational
Fishers 2011–12: Harvest Estimates. New Zealand Fisheries Assessment Report 2014/67.
Accessible at: https://www.mpi.govt.nz/dmsdocument/4719/direct
Wynne-Jones, J.; Gray, A.; Heinemann, A.; Hill, L.; Walton, L. (2019). National Panel Survey of Marine
Recreational Fishers 2017-2018. New Zealand Fisheries Assessment Report 2019/24. 104p.
Accessible at: https://www.mpi.govt.nz/dmsdocument/36792-far-201924-national-panel-survey-of-
marine-recreational-fishers-201718
Fisheries New Zealand Review of sustainability measures October 2021: GUR 1 • 19You can also read