INVESTOR PRESENTATION - AGGIORNAMENTI DATI DI BILANCIO AL 30.06.2015 SOFTWARE HOUSE LEADER NEL SETTORE DELLA GESTIONE DELLA TESORERIA AZIENDALE ...
←
→
Page content transcription
If your browser does not render page correctly, please read the page content below

INVESTOR
PRESENTATION
SOFTWARE HOUSE
LEADER NEL SETTORE DELLA GESTIONE DELLA TESORERIA AZIENDALE

AGGIORNAMENTI DATI DI BILANCIO AL 30.06.2015

Disclaimer
These slides have been prepared by PITECO S.p.A. (“PITECO”, the “Company” and together with its subsidiaries the “Group”), solely for a presentation to prospective investors concerning the Company in the context of activities that
are expected to lead to a listing on AIM Italia – Mercato Alternativo del Capitale, a multilateral trading facility managed by Borsa Italiana S.p.A., and an offering of the ordinary shares and convertible bonds issued by the Company.
These slides are strictly confidential and are being shown to you solely for your information. Neither this document nor any copy thereof may be reproduced, further distributed to any other person or published, in whole or in part, for
any purpose. By attending this presentation, you are agreeing to be bound by these restrictions. Any failure to comply with these restrictions may constitute a violation of applicable laws.
The information contained in this document (“Information”) has been provided by the Company or obtained from publicly available sources and has not been independently verified by Banca Popolare di Vicenza S.C.p.A. (“Banca
Popolare di Vicenza”).
None of the Company, Banca Popolare di Vicenza or any of their respective affiliates, directors, officers, advisers, agents or employees, nor any other person make any representation or warranty, express or implied, as to, and no
reliance should be placed on, the fairness, accuracy, materiality, completeness or correctness of the Information or any opinions contained herein. This presentation may contain financial information and/or operating data and/or
market information regarding the business, assets and liabilities of the Company and its subsidiaries and the results of operations and markets in which the Company and its subsidiaries are active. Such financial information may not
have been audited, reviewed or verified by any independent accounting firm and/or such operating or market information may be based on management estimates or on reports prepared by third parties which neither the
Company nor the Banca Popolare di Vicenza have independently verified. Banca Popolare di Vicenza has not made an independent evaluation or appraisal of the business, assets or liabilities of the Company or any of its subsidiaries.
It is not the intention of the Company or of Banca Popolare di Vicenza to provide, and you may not rely on these materials as providing, a complete or comprehensive analysis of the Company’s financial or trading position or
prospects. This presentation speaks as of its date and will not be updated. The Information included in this presentation may be subject to updating, completion, revision and amendment and such Information may change materially
without notice. No person is under any obligation to update or keep current the Information contained in this presentation and any estimates, opinions and projections expressed relating thereto are subject to change without notice.
Neither the Company or Banca Popolare di Vicenza, nor any of their respective affiliates, directors, officers, advisers, agents or employees, nor any other person shall have any liability whatsoever (in negligence or otherwise) for any
loss howsoever arising from any use of these materials or its contents or otherwise arising in connection with this presentation. Any projections, estimates, forecasts, targets, prospects, returns and/or opinions contained in this
presentation involve elements of subjective judgment and analysis and are based upon the best judgment of the Company as of the date of this presentation. No representation or warranty is given as to the achievement or
reasonableness of, and no reliance should be placed on, any valuations, forecasts, estimates, opinions and projections contained in this presentation. In all cases, recipients should conduct their own investigation and analysis on the
Company and the Information contained in this presentation.
THIS PRESENTATION AND ANY RELATED ORAL PRESENTATION DOES NOT CONSTITUTE AN OFFER OR INVITATION TO SUBSCRIBE FOR, PURCHASE OR OTHERWISE ACQUIRE ANY SECURITIES AND NOTHING CONTAINED HEREIN OR ITS
PRESENTATION SHALL FORM THE BASIS OF ANY CONTRACT OR COMMITMENT WHATSOEVER. ANY DECISION TO PURCHASE SECURITIES IN THE CONTEXT OF AN OFFERING SHOULD BE MADE ON THE BASIS OF INFORMATION CONTAINED IN
THE ADMISSION DOCUMENT (DOCUMENTO DI AMMISSIONE) IN ITALIAN LANGUAGE PUBLISHED IN RELATION TO SUCH AN OFFERING. The Company’s securities have not been, and will not be, registered under in the U.S. Securities Act of
1933, as amended (the “Securities Act”) and may not be offered or sold in the United States, absent registration or an exemption from registration under the Securities Act of 1933, as amended, or in any other jurisdiction absent
compliance with the securities laws of such jurisdiction. Neither this presentation nor any part or copy of it may be taken or transmitted into the United States or distributed, directly or indirectly, in the United States or to any “U.S. person”
as such term is defined in the Securities Act. Any failure to comply with this restriction may constitute a violation of U.S. securities laws. The Information contained in this document and any related presentations are for distribution only to
(a) persons who have professional experience in matters relating to investments falling within Article 19(5) of the Financial Services and Markets Act 2000 (Financial Promotion) Order 2005 (as amended, the “Order”), (b) persons falling
within Article 49(2)(a) to (d) (“high net worth companies, unincorporated associations etc.”) of the Order, (c) persons who are outside the United Kingdom, or (d) persons to whom an invitation or inducement to engage in investment
activity (within the meaning of section 21 of the Financial Services and Markets Act 2000) in connection with the issue or sale of any securities may otherwise lawfully be communicated or caused to be communicated (all such persons
together being referred to as “relevant persons”). This document and any related presentations are directed only at relevant persons and must not be acted on or relied on by persons who are not relevant persons. Any investment or
investment activity to which this document and any related presentations relate is only available to relevant persons and will be engaged in only with relevant persons.
In Italy this document and any related presentations is being distributed only to, and is directed at qualified investors within the meaning of Article 100 of Legislative Decree No. 58 of 24 February 1998, as amended, and article 34-ter,
paragraph 1, letter b), of Consob Regulation on Issuers No. 11971 of May 14, 1999, as subsequently amended (the “Issuers’ Regulation”) provided that such qualified investors will act in their capacity and not as depositaries or
nominees for other shareholders, such as persons authorized and regulated to operate in financial markets, both Italian and foreign, This document is not addressed to any member of the general public in Italy. under no circumstances
should this document circulate among, or be distributed in Italy to (i) a member of the general public, (ii) individuals or entities falling outside the definition of “qualified investors” as specified above or (iii) distribution channels through
which information is or is likely to become available to a large number of persons.
This Information contained in this document and any related presentations is being distributed to and is directed only at persons in Member States of the European Economic Area (“EEA”) who are “qualified investors” within the
meaning of Article 2(1)(e) of the Prospectus Directive (Directive 2003/71/ec) (“qualified investors”). Any person in the EEA who receives this document will be deemed to have represented and agreed that it is a qualified investor. Any
such recipient will also be deemed to have represented and agreed that it has not received this document on behalf of persons in the EEA other than qualified investors or persons in the UK, Italy and other member states (where
equivalent legislation exists) for whom the investor has authority to make decisions on a wholly discretionary basis. The company, Banca Popolare di Vicenza and their affiliates, and others will rely upon the truth and accuracy of the
foregoing representations and agreements. Any person in the EEA who is not a qualified investor should not act or rely on this document or any of its contents. The Information contained in this document is not for publication, release or
distribution in Australia, Canada or Japan. The distribution of this document and any related presentation in other jurisdictions may be restricted by law and persons into whose possession this document or any related presentation
comes should inform themselves about, and observe, any such restriction. Any failure to comply with these restrictions may constitute a violation of the laws of any such other jurisdiction. This document may not be acted on or relied on
by persons who are not eligible to invest in securities offered. Any investment or investment activity to which this communication relates is available only to persons eligible to invest in securities and will be engaged in only with such
persons.
Banca Popolare di Vicenza may provide investment banking services for the Company and may from time to time participate or invest in commercial banking transactions (including, without limitation, loans) with the Company.
Accordingly, information may be available to the Banca Popolare di Vicenza which is not reflected in this document. Banca Popolare di Vicenza may make a market in the securities described in this document. Accordingly, Banca
Popolare di Vicenza may actively trade these securities for their own accounts and those of their customers and, at any time, may have a long or short position in these securities or derivatives related hereto. Banca Popolare di
Vicenza is not a tax advisor. The tax implications of an investment in the securities must be verified by independent tax counsel before proceeding with any such investment.By attending this presentation, you are agreeing to be
bound by the foregoing limitations. Any failure to comply with these restrictions may constitute a violation of applicable securities laws. The Information contained herein does not constitute investment, legal, accounting, regulatory,
taxation or other advice.

                                                                                                                                                                                                                                                         2
Indice

   Sezione 1 Executive Summary                4

   Sezione 2 Presentazione della società      6

   Sezione 3 Il software e i clienti PITECO   13

   Sezione 4 Mercato di riferimento           17

   Sezione 5 Operazione IPO su AIM Italia     20

   Sezione 6 Presentazione dati semestrali    22

              Contatti                        28

                                                   3
sezione 1

Executive Summary

                    4
Executive Summary
PITECO è la principale Software House italiana per le          In data 31 luglio 2015 la società PITECO si è quotata
soluzioni proprietarie di gestione della liquidità aziendale   ufficialmente sul mercato AIM Italia di Borsa Italiana
e di pianificazione finanziaria per aziende large e mid-
cap nei settori dei servizi ed industriale.                    La raccolta complessiva è stata pari a circa € 16,5 mln (di
                                                               cui € 5 mln derivanti dall’emissione di un Prestito
PITECO ha oltre 30 anni di storia di mercato e copre tutta     Obbligazionario Convertibile)
la catena del valore del software: ricerca e sviluppo,
progettazione, sviluppo, realizzazione, vendita ed
assistenza: PITECO è 100% software di proprietà.                                  DATI SEMESTRALI 2015:

Il software è modulabile (19 diversi moduli), integrabile      • Ricavi pari a € 6,1 milioni (+9% rispetto al 30.6.2014)
(ogni cliente PITECO lavora già con un ERP come Oracle,        • EBITDA pari a € 2,6 milioni (+13% rispetto al 30.6.2014),
SAP o Microsoft), personalizzabile (architettura aperta          EBITDA margin pari al 42,6%
che consente una elevata differenziazione del prodotto)
                                                               • EBIT pari a € 2,5 milioni (+29% rispetto al 30.6.2014), EBIT
e disponibile per i mercati esteri (attuali clienti
                                                                 margin pari al 41,6%
internazionali di PITECO già lavorano con il software
PITECO in oltre 40 Paesi)                                      • Utile Netto pari a € 1,3 milioni (+38% rispetto al
                                                                 30.6.2014) pari al 21,1% dei ricavi
Il mercato del software applicativo italiano vale € 3,7 mld
                                                               • Flusso di Cassa Operativo pari a € 2,7 milioni (46,0% dei
nell’anno 2013 ed è in costante crescita dal 2011, con un
                                                                 ricavi e 104,9% dell’EBITDA)
CAGR del 3,5%. È il settore con la maggiore crescita nel
mondo dell'ICT (insieme con la pubblicità digitale; fonte:     • PFN pari a € 8,7 milioni (in miglioramento di € 1,3 milioni
Assinform edizione 2014)                                         rispetto al 31.12.2014).

La clientela di PITECO è composta da oltre 600 gruppi
industriali di grande e media capitalizzazione con una         Il 15 settembre 2015 il CdA ha comunicato che la società
estrema diversificazione di settore (banche e P.A.             ha adottato il bilancio redatto secondo i Principi
escluse)                                                       Contabili Internazionali (IAS/IFRS). Questa operazione è
                                                               stata anticipata di circa un anno rispetto a quanto
Il 1 luglio 2015 PITECO ha effettuato la prima operazione
                                                               indicato nel Documento di Ammissione come ulteriore
straordinaria con l’acquisto del ramo di azienda della
                                                               avvicinamento ai requisiti formali per l’accesso al
società Centro Data S.r.l.
                                                               mercato regolamentato MTA.

                                                                                                                                5
sezione 2

Presentazione della società

                              6
Presentazione di PITECO
  PITECO S.p.A., presente da più di 30 anni sul mercato           La vendita di software (15% dei ricavi annui) consente a
  nazionale, è la più importante società in Italia nella          PITECO di generare rilevanti ricavi ricorrenti da canoni di
  progettazione, sviluppo e implementazione di soluzioni          manutenzione (50% dei ricavi, in costante aumento su
  gestionali in area tesoreria per dimensioni, numero di          base annua) e da servizi ad alto valore aggiunto (35% dei
  risorse, gamma di servizi offerti e clienti gestiti             ricavi). Queste caratteristiche e la numerosa base clienti,
                                                                  distribuita su diversi settori industriali e caratterizzata da
  La società è Presente con 3 sedi operative (Milano,             una altissima retention e dalla costante crescita della
  Padova e Roma) con oltre 600 installazioni software             stessa (la società acquisisce oltre 30 nuovi clienti all’anno,
                                                                  principalmente società di medio-grandi dimensioni),
  Milano, la sede principale, coordina le attività ed ospita il   consentono alla società di realizzare una marginalità
  customer care service                                           lorda superiore al 42% al 30/06/2015 (Ebitda margin)

  La società presenta tre famiglie di prodotti. PITECO Evo:       Il mercato potenziale comprende tutte le aziende
  soluzione integrata per la gestione della finanza               industriali (non bancarie e P.A.) che, all’aumentare del
  aziendale composta da 17 diversi moduli. CBC: risponde          proprio fatturato e dell’esigenza di tracciare i propri flussi
  alle esigenze di gestione efficiente dei flussi dispositivi     finanziari, ritengono sia strategico presidiare e strutturare
  delle aziende verso il sistema bancario nazionale /             la funzione di tesoreria
  internazionale. Match-It: permette la gestione integrata di
  flussi di Big Data

     CASH MANAGEMENT                   FINANCIAL PLANNING                PAYMENT FACTORY                     RISK MANAGEMENT

GLOBAL LIQUIDITY MANAGEMENT                   SEPA                    FINANCIAL SUPPLY CHAIN                SPECIALIZED SERVICES

                                                                                                                                   7
Storyline PITECO

                      Il ramo d’azienda
                    delle attività legate       PITECO è l’unica       Lancio della nuova
                     al software PITECO          azienda italiana   piattaforma autorizzativa
                     viene scorporato e         presente alla XV     e dispositiva Corporate           Prima
Creazione            trasformato in una       Eurofinance Annual    Banking Communication          operazione di
    del                    società: il           Conference on      (CBC) integrata con CBI         M&A. PITECO
 software                management            international Cash            e SWIFT.               acquisisce il
PITECO da           diventa l’azionista di        and Treasury       PITECO diventa partner       ramo d’azienda
Met Group                  minoranza              Management             di SWIFT in Italia        di Centro Data

                                                                              2009                        2015      lug-2015

     Inizia la realizzazione di    Trasformazione di         Dedagroup                 Dedagroup e                IPO sul
            PITECO 2000:          PITECO Srl in PITECO    acquisisce il 30%             Sequenza                 mercato
         comprende una                   S.p.A.              di PITECO da             aumentano la               AIM Italia
           piattaforma di                                  Gruppo Met in              partecipazione
    integrazione per sistemi                              partnership con               all’81% del
        contabili aziendali                               il management              capitale di PITECO
          (ERP). Diventa il                                      (70%)
      software di riferimento
       per le più importanti
          aziende italiane

                                                                                                                               8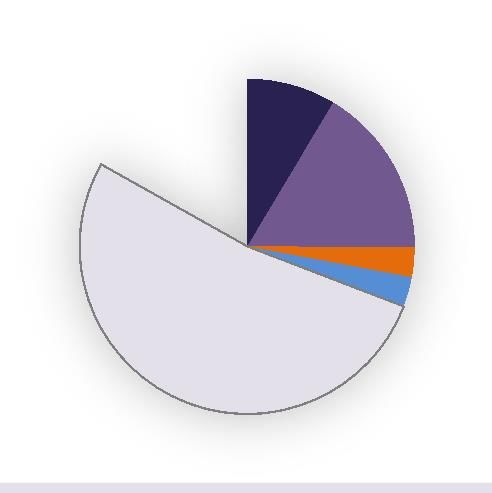
Numeri chiave della società
     Dati Finanziari ITA GAAP                                               CAGR (2011-2014)                        Dati Semestrali IFRS/IAS              Var YoY
     2008-2014 (€/mln)                                                      - Ricavi: +7,2%                                                               - Ricavi: +8,8%
                                                                                                                    06.2014 – 06.2015 (€/mln)
                                                                            - Ebitda: +13,8%                                                              - Ebitda: +13,4%
14                                                                                                     45%      7                                                    44,0%
                                                                                          42,4%                                                   42,6%
                                                               39,8%         39,3%                     40%
12                                               38,9%                                                          6           40,8%
                                                                                                                                                                     40,0%
                                35,4%                                                                  35%
10                   32,3%                                                                                      5
      29,6%                                                                                            30%                                                           36,0%
8                                                                                                      25%      4
                                                                                                                                                                     32,0%

                                                                                          12,3
6                                                                                                      20%

                                                                             11,2
                                                  10,8

                                                               10,8

                                                                                                                                                  6,1
                                                                                                                3

                                                                                                                           5,6
                                    9,9

                                                                                                       15%
                     9,3
      8,1

4                                                                                                                                                                    28,0%
                                                                                                       10%      2

                                                                                                 5,2
                                                                                    4,4
                                                                      4,3
                                                         4,2

2

                                                                                                                                                         2,6
                                          3,5

                                                                                                       5%                                                            24,0%

                                                                                                                                   2,3
            2,4

                           3

                                                                                                                1
0                                                                                                      0%
      2008            2009          2010          2011         2012          2013    2014                       0                                                    20,0%
                                                                            Audited Audited                                 giu-14                giu-15

                           Ricavi               Ebitda           % Ebitda Margin                                          Ricavi         Ebitda         %Ebitda Margin

                  Il Software PITECO è usato in oltre 40 paesi in 4                                          Nuovi clienti da inizio anno 2015: 19
                  continenti differenti

                  3 sedi operative e 80 dipendenti                                                           Media nuovi clienti: 30 annui

                                                                                                             Circa il 50% dei ricavi derivano da canoni
                  Oltre 600 clienti                                                                          ricorrenti di manutenzione in constante crescita

                                                                                                                                                                         9
Operazione di M&A
 Ramo d’azienda di Centro Data
La società ha stipulato in data 26 giugno 2015 con Centro Data S.r.l. un contratto per l’acquisto del ramo di azienda con
decorrenza dal 1° luglio 2015. Centro Data S.r.l è operativa nella fornitura di soluzioni per lo svolgimento di operazioni di
riconciliazione finanziaria e di matching sui Big Data (software Match-It).

Questa acquisizione ha permesso all’azienda di portare all’interno della propria offerta 3 nuovi moduli software, in aree
complementari all’attuale core business di PITECO e circa 50 nuovi clienti principalmente in settori non fortemente
presidiati da PITECO come assicurazioni e credito al consumo.

L’operazione di acquisizione è la prima operazione straordinaria frutto della strategia di espansione che la società ha
indicato come uno dei driver futuri della crescita.

   Controvalore                                € 1.085.000

    - di cui cash                                 55,3%
    - di cui accollo debito                       23,9%
    - di cui risconti ricavi anticipati           20,8%

   Fatturato 2014                              € 1.150.000

   Numero dipendenti                                11
   Numero clienti                                   50

                                                                                                                                10
Azionariato pre-post IPO & Management
Azionariato PRE-IPO Azionariato POST-IPO
3 Soci 3 Soci
Fondatori Mercato Fondatori
10% 16,87% 8,57%
Dedagroup
Sequenza
S.p.A. Sequenza S.p.A.
61% S.p.A. 16,49%
20%
Marco
Marco Podini
Podini 2,89%
4,5%
Dedagroup Maria Luisa
Maria Luisa
S.p.A. Podini
Podini
52,29% 2,89%
4,5%
MARCO PODINI PAOLO VIRENTI
Socio di PITECO Socio Fondatore di PITECO
AMMINISTRATORE
PRESIDENTE DELEGATO
RICCARDO VENEZIANI ANDREA GUILLERMAZ
Socio Fondatore di PITECO Socio Fondatore di PITECO
DIRETTORE DIRETTORE
FINANZIARIO COMMERCIALE
Altri membri CdA:
Gianni Camisa (Consigliere); Maria Luisa Podini (Consigliere); Anna Maria di Ruscio (Consigliere Indipendente)
11Drivers di crescita futuri
L’uso dei proceeds derivanti dalla quotazione in Borsa andrà ad alimentare i seguenti driver descritti,
consentendo alla società di crescere nei prossimi anni.
(1) NUOVI CLIENTI «LARGE»
(2) NUOVI MODULI
(3) LINEE ESTERNE (M&A)
(4) ACCESSO AL MERCATO «MID»
(5) SVILUPPO ESTERO (USA)
(1) Nuovi Clienti: storicamente la società acquisisce circa 30 clienti “large” all’anno e il mercato si dimostra
sempre più sensibile alle soluzioni di gestione della tesoreria. Nel corso del primo semestre la società ha
acquisito 19 nuovi clienti.
(2) Nuovi Moduli: PITECO continuerà ad investire in R&S per allargare l’attuale offerta di 19 moduli.
(3) Linee Esterne M&A: PITECO ha acquisito il ramo d’azienda di Centro Data. Il management di PITECO ha una
pipeline identificata di aziende target sul mercato nazionale.
(4) Accesso al mercato “Mid”: PITECO vuole allargare l’offerta alle società con un fatturato compreso tra € 50-
100m. PITECO presenta una pipeline di oltre 900 società già identificate.
(5) Sviluppo estero (USA): Questa strategia sarà legata ad una acquisizione sul mercato statunitense.
12sezione 3
Il software e i clienti PITECO
13Ciclo di vita del cliente
Breakdown delle vendite
(% sulle vendite 2014)
Il tipico ciclo di vita del cliente acquisito prevede 3 fasi:
4% 13%
Acquisizione: una prima fase progettuale che si
48%
conclude con la vendita del software PITECO e
la configurazione secondo le esigenze del 35%
cliente. Il valore medio di un tipico contratto è
stato pari a circa €65.000 nel 2014 (di cui €
35.000 di software e € 30.000 di attività di Contratti di manutenzione
consulenza) Vendita di servizi
Altro
Vendita software
Manutenzione: il canone di manutenzione Breakdown per
annuo ricorrente, indicativamente €11.000 annui tipologia di clienti
(in continua crescita e indicizzato all’inflazione), (% sulle vendite 2014)
è fatturato anticipatamente 2%
55% 43%
Upgrading: a ciò si aggiunge il cross selling degli
attuali 19 moduli di software che fanno parte < € 100mln
integrante dell’offerta PITECO. L’upgrading € 100mln > € 500mln
> € 500mln
determina nel tempo un incremento del
canone medio di manutenzione 98% dei clienti hanno un fatturato
maggiore di € 100 milioni.
14Settori e software gestionali serviti da
PITECO
SETTORI DI APPLICAZIONE DEL SOFTWARE PITECO SOFTWARE GESTIONALI DI APPLICAZIONE DEL
PRODOTTO PITECO (FY 2014)
UTILITIES 15,3%
MECHANICS & STEEL 13,3%
FASHION 8,7% ALTRI
21%
CONSTRUCTION & TILE 7,6%
FOOD 5,0% MICROSO
SERVICES 4,8% FT
2%
TELECOMMUNICATION 4,8%
RETAIL 4,8%
ORACLE SAP
CHEMICALS 4,7%
16% 61%
CONSUMER GOODS 4,5%
LOGISTICS 4,4%
INSURANCE 4,3%
• Attualmente PITECO conta oltre 600 clienti ben
AUTOMOTIVE 3,1%
distribuiti su tutti i settori industriali
MEDIA 2,7%
• Il 98% dei clienti ha un fatturato > € 100mln
AUTOMATION 1,5%
• Oltre il 50% del fatturato deriva dai contratti di
COMPUTER - INFORMATICS 1,0% manutenzione. I primi 10 clienti per dimensione di
contratto rappresentano circa il 7% del fatturato
FINANCE 0,9%
Breakdown del fatturato PITECO totale di PITECO
PAPER 0,5%
2014 per settore di appartenenza • Il 100% dei clienti PITECO ha già un software
PHARMACEUTICAL 0,4% gestionale
EDITORIAL 0,4% • I tre software gestionali principali (SAP, Oracle e
OTHERS 7,4% Microsoft) contano per circa l’80% (FY2014)
15Esempio di Clienti
UTILITIES MECHANICS / STEEL FASHION CONSTRUCTION
FOOD & BEVERAGE SERVICES TLC RETAIL
CHEMISTRY CONSUMER LOGISTICS / TRANSPORT FINANCIAL / INSURANCE
AUTOMOTIVE MEDIA AUTOMATION / PAPER
16sezione 4
Mercato di riferimento
17Il mercato di riferimento PITECO:
software applicativi gestionali
MERCATO DEL SOFTWARE: € 5.475 milioni (2014 – Assinform)
SOFTWARE DI SISTEMA SOFTWARE MIDDLEWARE SOFTWARE APPLICATIVI
Software che garantiscono Insieme di programmi che Programmi utilizzati per l’automazione di ufficio
le funzioni base (ad esempio fungono da intermediari tra le (es. word, excel), per particolari esigenze
i sistemi operativi, come diverse applicazioni e professionali ed aziendali (ad es. la tesoreria,
MAC OS, Windows) componenti software gestione magazzino), per la creazione di software,
per ottimizzare il funzionamento del computer
MANAGEMENT APPLICATION SOFTWARE: € 3.775 million
SOFTWARE DI SOFTWARE DI SOFTWARE PER LA SOFTWARE PER IL SOFTWARE DI GESTIONE
CONTABILITÀ MAGAZZINO PRODUZIONE BUDGETING ED ANALISI FINANZIARIA
SOFTWARE DI TESORERIA
18Crescita futura del settore delle
applicazioni per la Tesoreria
Grafico 1. Tool principali utilizzati dalle società per la gestione della tesoreria
§ Nonostante la necessità di un
sistema di tesoreria più
personalizzato, il 42,7% delle aziende overRicavi oltre £10b
£10b revenues 11% 57% 5% 16% 8% 3%
UK utilizzano ancora fogli di calcolo
come strumento primario per la
gestione delle loro operazioni di Ricavi trarevenues
£1b-£10b £1b-£10b 35% 32% 17% 12% 3%1%
tesoreria.
§ I server di tesoreria rimangono il
secondo tool più utilizzate nel Ricavi tra £500m-£1b
£500m-£1b revenues 43% 24% 10% 14% 9% 0%
complesso, a quota 26%, a seguire il
12% utilizzano il modulo aziendale di
tesoreria ERP, mentre il 10% utilizzano Ricavi tra £100m-£500m
£100m-£500m revenues 47% 11% 6% 17% 14% 5%
il cloud / software-as-a-service
(SaaS) basato su un Management
System Treasury (TMS). Ricavi trarevenues
£0-£100m £0-£100m 63% 13% 4% 3% 17% 0%
Fonte: Kyriba Corporation and Association Fogli Excel
Spreadsheets Software
Server software Software
Cloud Cloud
software
of Corporate Treasurers, 2014
Tool of
Part del Sistema
ERP systemERP Soluzionisolution
In-house in-house Non lo
Don't sanno
know/none of the above
§ In termini di ripartizione geografica, le Americhe, con un fatturato di $ 922m (43,8% del totale) sono il più grande mercato TMS, seguite da EMEA con un
fatturato di $ 887m (42,2%), mentre l'Asia Pacific e Giappone sono il mercato più piccolo con $ 294m dei ricavi (14,0%).
§ Per quanto riguarda i futuri tassi di crescita attesi, le Americhe sono previste raggiungere quota $1,2 miliardi di ricavi nel 2018, ovvero un 5,2% CAGR 2013-
18; l’EMEA dovrebbe raggiungere $1,1 miliardi (3,6% 2013-18 CAGR) mentre l'Asia / Pacific: è prevista raggiungere i $413m (7,0% 2013-18 CAGR).
Grafico 2. Grafico 3.
Ricavi derivanti dalle applicazioni per la Tesoreria e il Risk Ricavi per area geografica derivanti dalle applicazioni
Management divisi per area geografica, 2013 – 2018E per la Tesoreria e il Risk Management, 2013 (Total: $ 2.1b)
(US$m) 2013 2014 2015 2016 2017 2018 2013 2018 2013-18E
Share Share CAGR APJ
14%
Americas 922 960 1,002 1,060 1,124 1,189 43.8% 44.6% 5.2%
EMEA 887 901 949 969 1,004 1,061 42.2% 39.8% 3.6% Americas
44%
APJ 294 309 317 352 384 413 14.0% 15.5% 7.0% EMEA
42%
Total 2,013 2,170 2,268 2,381 2,512 2,663 100.0% 100.0% 4.8%
Crescita (%) 4.3% 3.2% 4.5% 5.0% 5.5% 6.0%
Source:IDC, July 2014 19sezione 5
Operazione IPO su AIM Italia
20Quotazione sul mercato AIM Italia
In data 31.07.2015 si sono ufficialmente avviate le Andamento del titolo in borsa dal giorno di IPO (31 lug 2015) ad
negoziazioni delle azioni ordinarie di PITECO S.p.A. oggi (30 set 2015)
sul Mercato AIM Italia e del Prestito Obbligazionario
Convertibile «Piteco Convertibile 4,50% 2015-2020».
Di seguito sono riportati i dati fondamentali dei due
strumenti emessi:
STRUMENTI EMESSI
Performance
Azione
da IPO: +1,0%
Codice ISIN IT0004997984
Prezzo IPO € 3,300
Prezzo al 29 set 2015 € 3,334
Confronto con Euro STOXX TMI / Software & Computer Services
Raccolta Equity € 11,5 mln
Capitalizzazione € 60 mln
Scambi medi giornalieri 36.000 pezzi
PITECO
Bond convertibile
Codice ISIN IT0005119083
Volume di emissione € 5 mln Euro STOXX TMI / Software &
Computer Services (Rebased)
Cedola 4,5%
Maturity 2015-2020
Strike price € 4,20
21sezione 6
Presentazione dati semestrali
22Conto Economico IFRS/IAS
06.2015 – 06.2014
CONTO ECONOMICO 30-06-2015 30-06-2014
[Dati in Eur] % %
Ricavi delle vendite 5.923.264 97,2% 5.491.086 98,0% I Ricavi hanno registrato un incremento di
Work in progress 7.111 0,1% (111.761) -2,0% circa il 9% principalmente per canoni di
163.606 2,7% 223.582 4,0% manutenzione ricorrenti, licenze software e
Altri ricavi
servizi.
RICAVI TOTALI 6.093.981 100,0% 5.602.906 100,0% L’EBITDA Margin è cresciuto dal 40,8% al 42,6%
Var% (YoY) 8,8% grazie alla crescita meno che proporzionale
dei principali costi diretti (costo del personale e
Materie prime (40.429) 0,7% (5.678) 0,1% per acquisto di servizi) al crescere del
Costi per servizi (899.884) 14,8% (897.216) 16,0% fatturato.
Costi del personale (2.525.971) 41,4% (2.411.252) 43,0%
L’EBIT Margin è cresciuto dal 34,9% al 41,6%,
Altri costi (32.519) 0,5% 0 0,0% grazie a minori ammortamenti relativi al
EBITDA 2.595.177 42,6% 2.288.760 40,8% software proprietario.
Var% (YoY) 13,4%
L’EBT pari a € 1,8 milioni, ha registrato un
Ammortamenti e svalutazioni (58.558) 1,0% (329.996) 5,9% incremento del 31%. L’incidenza sui ricavi è
41,6% 1.958.764 34,9% cresciuta dal 25,2% al 30,2%, principalmente
EBIT 2.536.620
grazie alla riduzione degli oneri finanziari
Var% (YoY) 29,5% conseguente alle nuove condizioni del
rifinanziamento del debito bancario in essere
Proventi (Oneri) finanziari (368.854) -6,0% (542.248) -9,7% nel 2012.
Proventi (Oneri) straordinari (324.276) -5,3% (5.484) -0,1%
EBT 1.843.490 30,2% 1.411.032 25,2% L’Utile Netto ha registrato un incremento del
38,3%.
Imposte (559.779) 9,2% (482.562) 8,6%
UTILE (PERDITA) D’ESERCIZIO 1.283.711 21,0% 928.470 16,6%
Var% (YoY) 38,3%
23Stato Patrimoniale IFRS/IAS
06.2015 – 12.2014
STATO PATRIMONIALE 30-06-2015 31-12-2014
[Dati in Eur]
Immobilizzazioni materiali 1.438.259 1.454.844
Immobilizzazioni immateriali 841.033 223.340
Avviamento 30.243.073 30.243.073
Altre Immobilizz. Finanziarie 1.380 181.801
Imposte differite 107.283 223.779
Totale Immobilizzazioni 32.631.029 32.326.838
Work in progress 148.357 141.246
Crediti commerciali 5.923.464 4.012.558
Cassa e Disponibilità liquide 825.296 1.851.428
Totale attivo corrente 6.897.117 6.005.232
ATTIVO TOTALE 39.528.146 38.332.069
Capitale sociale 15.550.000 15.550.000
Riserve 1.691.882 1.696.266
Utile (Perdita) d’esercizio e preced. 5.440.794 4.157.083
Totale Patrimonio netto 22.682.677 21.403.349
Altri debiti oltre 12 mesi 2.000.000 3.313.266
Debiti bancari oltre 12 mesi 5.178.712 7.380.379
TFR e Fondi per rischi e oneri 974.558 1.087.300
Altri debiti 40.209 35.968
Tasse differite 19.604 118.243
Totale debiti non correnti 8.213.083 11.935.156
Altri debiti finanziari entro 12 mesi 1.920.923 1.092.886
Debiti bancari entro 12 mesi 1.750.000 1.200.000
Debiti verso fornitori 696.084 529.890
Debiti tributari 260.251 298.255
Altri debiti 4.005.128 1.872.533
Totale debiti non correnti 8.632.386 4.993.564
PASSIVO TOTALE 39.528.146 38.332.069 24Posizione Finanziaria Netta IFRS/IAS
06.2015 – 12.2014
POSIZIONE FINANZIARIA NETTA 30-06-2015 31-12-2014
[Dati in Eur]
Depositi 824.928 1.851.091
Cassa 367 336
Liquidità 825.295 1.851.427
Debiti bancari entro 12 mesi (1.750.000) (1.200.000)
Debiti verso altri finanziatori entro 12 mesi (623.946) 0
Posizione Finanziaria Corrente (2.373.946) (1.200.000)
Posizione Finanziaria Netta Corrente (1.548.651) 651.427
Crediti finanziari non correnti 1.300 10.300
Debiti verso banche oltre 12 mesi (5.178.712) (7.380.379)
Debiti verso altri finanziatori oltre 12 mesi (2.000.000) (3.313.266)
Posizione Finanziaria non corrente (7.177.412) (10.683.345)
POSIZIONE FINANZIARIA NETTA (8.726.063) (10.031.918)
25Cash Flow Statement IFRS/IAS
06.2015 – 12.2014
30-06-2015 31-12-2014
CASH FLOW STATEMENT
(6 mesi) (12 mesi)
[Dati in Eur]
EBIT 2.536.620 4.526.241
Imposte pagate (757.996) (1.028.885)
NOPAT 1.778.624 3.497.356
Ammortamenti e svalutazioni 58.558 702.823
Delta capitale circolante 943.354 492.804
Delta fondi (57.714) 55.985
Cash Flow Operativo 2.722.821 4.748.968
% sui Ricavi 46,0% 38,9%
% su Ebitda 104,9% 92,9%
Investimenti (659.665) (273.283)
Free Cash Flow to Firm 2.063.156 4.475.685
% sui Ricavi 34,8% 36,6%
% su Ebitda 79,5% 87,5%
Proventi (Oneri) straordinari (324.276) 16.726
Interessi pagati (368.854) (1.010.610)
Free Cash Flow prima del ripagamento del debito 1.370.027 3.481.801
Vendor Loan 0 (2.264.533)
Ripagamento del debito (2.396.159) (2.414.448)
Free Cash Flow to Equity (1.026.132) (1.197.180)
Cassa a inizio periodo 1.851.427 3.048.608
Cassa a fine periodo 825.295 1.851.428
26I consulenti di PITECO
Financial Advisor
Nomad
Specialist & Corporate Broker
Auditor
Legal Advisor
Governance Advisor
Studio Spalla e
Tax Advisor Associati
Investor Relator
27GRAZIE PER
L’ATTENZIONE
Via Mercalli, 16
20122 – Milano
Tel. +39 023660931
Email info@pitecolab.itYou can also read