INVESTOR PRESENTATION - August 2020 - Seeking Alpha
←
→
Page content transcription
If your browser does not render page correctly, please read the page content below
INVESTOR
PRESENTATION

               August 2020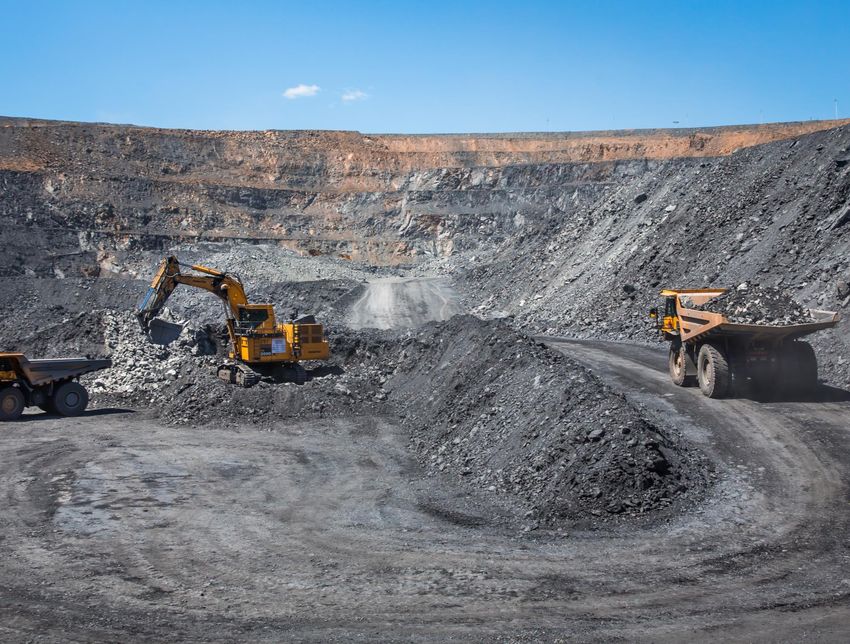
01
INTRODUCTION
POLYMETAL INTERNATIONAL PLC             INVESTOR PRESENTATION       3

POLYMETAL TODAY
                              Top-10 WORLD GOLD PRODUCER
                              2nd LARGEST GOLD PRODUCER IN RUSSIA
                              9 OPERATIONS ACROSS 2 COUNTRIES
                              FTSE 100 & MSCI CONSTITUENT

   Competence center

   Development

   Operations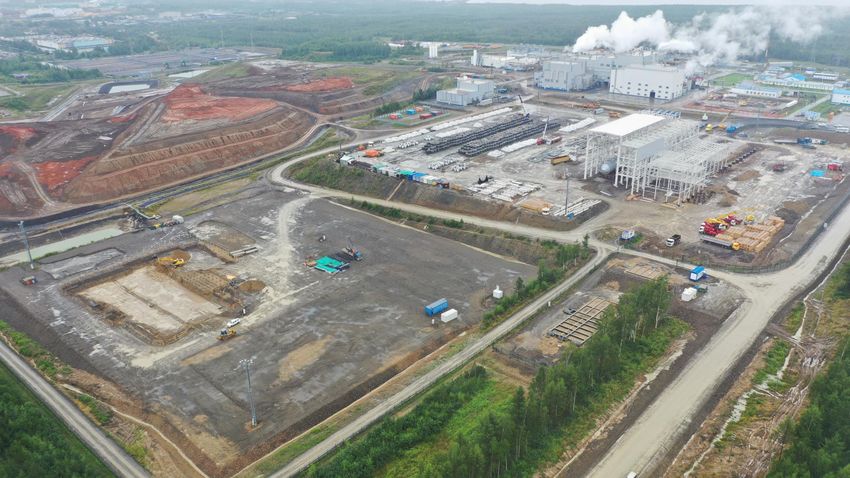
POLYMETAL INTERNATIONAL PLC                                INVESTOR PRESENTATION             4

STRATEGY

                              CAPITAL ALLOCATION
   SCOPE OF ACTIVITY                                         DESIRED OUTCOMES
                                  PRINCIPLES

    Russia and FSU            Regular dividend is         Significant sustainable dividend
                              shareholder’s right,
    Focus on gold, silver     comes before growth         Meaningful growth
    and possibly other        spending                    Reduction of environmental
    base metals
                              Target Net Debt/EBITDA      footprint
    ESG best practice         of below or equal to 1.5x   Social license to operate
    Medium-sized high-        Maintain high standards     Robust balance sheet
    grade deposits            of ESG through impact
                              assessment
    Leadership in
    refractory ore
    processing
POLYMETAL INTERNATIONAL PLC                                                                                                                           INVESTOR PRESENTATION                                            5

FOCUS ON GRADE

     AVERAGE RESERVE GRADE (2P RESERVES), g/t of GE

  5.6

                3.7

                            2.9            2.8
                                                         2.4
                                                                   2.2
                                                                            1.9         1.8
                                                                                                 1.5         1.5       1.4            1.4       1.3        1.2         1.2        1.1        0.9
                                                                                                                                                                                                             0.7
                                                                   Yamana

                                                                                        Polyus

                                                                                                 Anglogold

                                                                                                             Newmont

                                                                                                                                                                                  Centerra
   Hochschild

                                           Gold Fields

                                                                                                                                                                       Centamin
                Polymetal

                                                         Barrick

                                                                                                                                                Newcrest
                            Agnico Eagle

                                                                            Endeavour

                                                                                                                       Pan American

                                                                                                                                                                                                             Kinross
                                                                                                                                                           Fresnillo
                                                                                                                                      B2 Gold

                                                                                                                                                                                             Petropavlovsk
Source: Companies’ data for FY2019.
POLYMETAL INTERNATIONAL PLC                                                                                                                                 INVESTOR PRESENTATION                                           6

GROWING ASSET BASE

 Ore Reserves as at 01.01.2020
 25.2 Moz

 +1.2 Moz / +5% y-o-y

   2019 RESERVE PER SHARE, y-o-y change

  29%

                                                                                                                                                                                                   Pan American
                                                                                                                                          Agnico Eagle
                                                                                                                            Gold Fields
                                                                              Hochschild

                                                                                           Endeavour

                                                                                                       Centamin
                                                                   Newcrest

                                                                                                                                                                                        Centerra
                                                                                                                                                                            Fresnillo

                                                                                                                                                                                                                   Yamana
                                                                                                                  Kinross

                                                                                                                                                                  Barrick
                                                                                                                                                         Polyus
              7%       5%             3%              0%

                                                                  -3.0% -3%                -3%         -4%        -5%       -5%
    Newmont

                                                      Anglogold
                          Polymetal
              B2Gold

                                      Petropavlovsk

                                                                                                                                          -6%            -6% -17% -19%
                                                                                                                                                                       -26% -30%
                                                                                                                                                                                                                  -61%

Source: Companies’ data
POLYMETAL INTERNATIONAL PLC                                                                                                                                          INVESTOR PRESENTATION                                                          7

SIGNIFICANT SUSTAINABLE DIVIDEND YIELD

 50%                                                                                             $2.0bn                                                                         5.4%
 OF UNDERLYING NET INCOME
 (+ Board discretion to increase
                                                                                                                                                                                YTD
 the final dividend to a                                                                         PAID OUT SINCE IPO
 maximum annual payout of                                                                                                                                                       DIVIDEND YIELD*
 100% of FCF)

   AVERAGE 5-YEAR DY, %

5.2% 5.1%
                     4.3% 4.1%
                                             3.2%
                                                         2.0%
                                                                     1.6% 1.6%
                                                                                                  1.3% 1.3% 1.2% 1.2% 1.2%
                                                                                                                           1.1% 1.0% 0.9%
                                                                                                                                          0.6%
                                                                                                                                                                                                            0.3% 0%              0%        0%
                                                          Centerra
 Polyus

          Centamin

                                                                                                           Gold Fields

                                                                                                                         Hochschild

                                                                                                                                                                                                Anglogold
                      FTSE 100

                                 Polymetal

                                              FTSE 250

                                                                                                                                                FTSE GM

                                                                                                                                                                      Barrick

                                                                                                                                                                                                            B2Gold
                                                                      Fresnillo

                                                                                                                                                                                 Agnico Eagle

                                                                                                                                                                                                                                           Petropavlovsk
                                                                                                  Yamana

                                                                                                                                      Newmont

                                                                                                                                                                                                                                 Kinross
                                                                                  Pan American

                                                                                                                                                          Newcrest

                                                                                                                                                                                                                     Endeavour
 Source: Bloomberg data
 * DPS declared for 1H 2020 ($0.4) + Final 2019 DPS ($0.42) + Special 2019 DPS ($0.2) divided by YTD average share price ($18.8)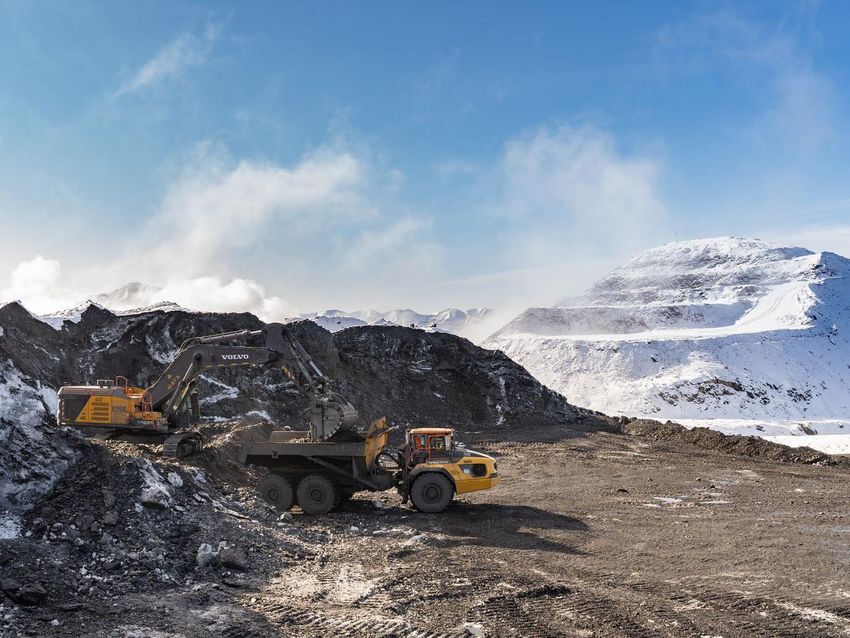
POLYMETAL INTERNATIONAL PLC                                 INVESTOR PRESENTATION        8

ESG LEADERSHIP

  RECOGNITION OF OUR EFFORTS TO DATE

   First and only Russian member            ESG rating A
                                            Member of ESG Leaders index

  1st among 55 precious metals               ESG score A-                 ESG score С+
  companies
  100 percentile
  First sustainability-linked loan in CIS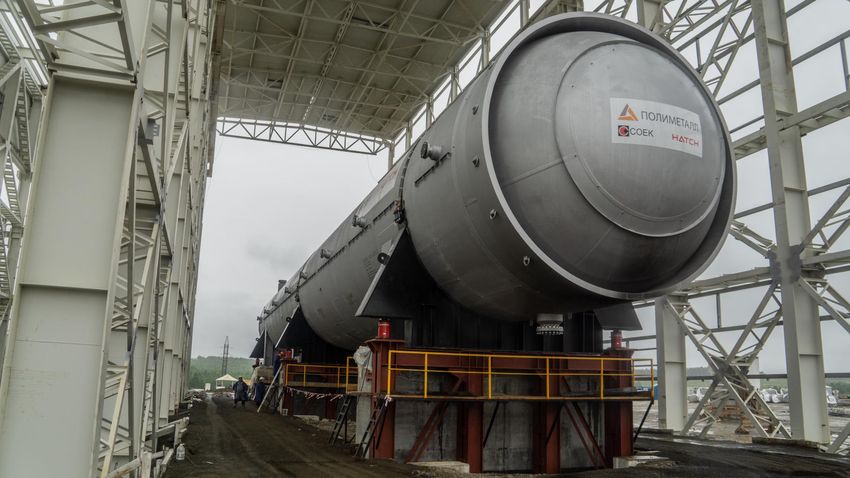
POLYMETAL INTERNATIONAL PLC                                                     INVESTOR PRESENTATION          9

ESG PERFORMANCE
  2019 KEY SUSTAINABILITY METRICS                                     RECENT TRANSPARENCY PROGRESS

GHG Intensity                         Energy Intensity                Scope 3 downstream and upstream
(t of CO2e per Kt of ore processed)   (GJ per Koz of GE produced)     emissions disclosure
                                                                      Disclosure in line with SASB and TCFD
75.1 t/Kt                                                             in 2019 Sustainability Report
-1% y-o-y                             4.2 TJ/Koz
                                      -1% y-o-y                       Permafrost FAQs disclosure

Share of Water                        Share of Dry Stacking
Recycled and Reused                                                 Our key strategic goals are:
                                                                      Zero fatalities
87%                                   10%
+5 pps y-o-y                          Amursk and Voro                 Further decrease of GHG emissions and
                                                                      energy consumption
  SAFETY                                                              Continued reduction of fresh water use
                                                                      per unit of production
Fatalities                              LTIFR                         Further implementation of dry stack
                                                                      storage method across the Group
2 in 2019                               0.19 in 2019                  (extension to Nezhda, Prognoz, POX-2
                                        +111% y-o-y                   sites and Omolon)
0 in 1H 2020
                                        0.07 in 1H 2020
                                        -70% y-o-y
POLYMETAL INTERNATIONAL PLC                                INVESTOR PRESENTATION       10

COVID-19 UPDATE

   No interruptions in production, supply chain or sales due to COVID-19 yet

   No material COVID-19 outbreaks have so far occurred at our operations

   There are currently 72 employees across all operations tested positive with the
   vast majority of confirmed cases occurring during intra-shift breaks or mandatory
   14-days observatory period

   Strict precautionary procedures are maintained at all production sites

   The additional COVID-related costs are estimated at approximately $2.5m per
   month

   Polymetal provides financial support to all regions of operations. In 1H, the
   Company purchased various critical medical supplies for 25 regional and municipal
   hospitals, and volunteers for the total amount of RUB 129 million (US$ 1.8 million)
02
CORPORATE
GOVERNANCE UPDATE
POLYMETAL INTERNATIONAL PLC                                                                          INVESTOR PRESENTATION                             12

BOARD COMPOSITION
   CHAIR                              INDEPENDENT DIRECTORS                                                     DEPARTED DIRECTORS

IAN COCKERILL
Chair (N, S)                         OLLIE OLIVEIRA          TRACEY KERR             GIACOMO BAIZINI                   JEAN-PASCAL
Chair of the Nomination Committee,   SINED (N, A, R)         INED (S, R)             INED (A, N)                       DUVIEUSART
Non-Executive Director at BHP, Ex-   Chair of the POLYs      Chair of the Safety &   Chair of the Audit                NED since 2011
President and CEO of Gold Fields,    Remuneration            Sustainability          and Risk Committee                PPF Group
ex-CEO of AngloCoal                  Committee, Chair of     Committee, Group        and ex-CFO of
                                     Audit Committee         Head of Safety and      EVRAZ Group S.A.
                                     at Antofagasta plc,     Sustainable
  NON-INDEPENDENT                    ex-Executive Director   Department in Anglo
                                     at De Beers             American plc
  DIRECTORS
                                                                 JOINED

                                                                                                                       CHRISTINE
                                                                                                                       COIGNARD
                                                                                                                       INED since 2014

VITALY NESIS
Group CEO, S

                                     ANDREA ABT              ITALIA BONINELLI        VICTOR FLORES
                                     INED (A)                INED (R)                INED (A, S)
                                     Ex-Chief                Ex-Executive VP for     Director of Strategic
                                     Procurement Officer     Organizational          Projects, Orion
                                     at Siemens AG           Development at          Resource Partners
                                     NED at John Laing       AngloGold Ashanti.      (USA) Inc
                                     Group, Petrofac Ltd.                                                    N – Nomination Committee
KONSTANTIN YANAKOV                   and Gerresheimer AG                                                     R – Remuneration Committee
ICT Group Ltd                                                                                                A – Audit and Risk Committee
Ex-CFO of Polymetal                                                                                          S – Safety and Sustainability Committee
POLYMETAL INTERNATIONAL PLC INVESTOR PRESENTATION 13
SHAREHOLDER STRUCTURE
SHARES OUTSTANDING FREE FLOAT, $bn
472 MILLION
8.9
7.5
71%
FREE FLOAT
3.1 3.0
ICT Group
Alexander Nesis
28.0%
Polymetal Polyus Fresnillo Centamin
Otkritie LTM ADTV, $m
3.9%
PPF LSE
Petr Kellner 42 MOEX
3.8% 38
13
Management 28
Institutional
& Directors 0.9%
investors
and individuals 29
63.4% 18
12
PPF’s stake is now part of the Free Float as Jean-Pascal 10
Duvieusart (PPF) left the Board at the last AGM on April 27, 2020
Previous free float – 65%
Polymetal Polyus Fresnillo Centamin03 OPERATIONS UPDATE
POLYMETAL INTERNATIONAL PLC                                        INVESTOR PRESENTATION      15

1H 2020 – PRODUCTION
Strong performance at Kyzyl compensated for the
planned decline at Svetloye and Voro

  GE PRODUCTION RECONCILIATION, Koz

                                      +53                                           723
          694                                              -21             -3

          1H 2019             Kyzyl         Other assets         Discontinued       1H 2020
                                                                 operations
POLYMETAL INTERNATIONAL PLC INVESTOR PRESENTATION 16
1H 2020 – FINANCIAL HIGHLIGHTS
Robust growth of all profitability metrics driven by higher
prices and production at stable unit costs
1H 2020 1H 2019 Change
Revenue, $m 1,135 941 +21%
Adjusted EBITDA, $m 616 403 +53%
Adjusted EBITDA margin 54% 43% +11%
Total cash cost, $/GE oz 638 667 -4%
All-in sustaining cash cost, $/GE oz 880 904 -3%
Underlying net earnings, $m 373 188 +98%
Underlying EPS, $/share 0.79 0.40 +98%
Dividends proposed for 1H, $/share 0.40 0.20 +100%
Net operating cash flow, $m 300 127 +136%
Capital expenditure, $m 248 189 +31%
Free cash flow (pre M&A), $m 53 -63 NA
Net debt, $m 1,690 1,4791 +14%
Net debt/Adjusted EBITDA, x 1.31 1.38 -5%
Notes:
1) As at 31/12/2019POLYMETAL INTERNATIONAL PLC INVESTOR PRESENTATION 17
AISC – POLYMETAL VS GLOBAL PEERS
1H 2020 ALL-IN SUSTAINING CASH COSTS, $/oz YEAR-ON-YEAR CHANGE IN AISC, %
Buenaventura 1,815 Buenaventura 75.7
New Gold 1,370 New Gold 26.3
IAMGOLD 1,210 Agnico Eagle 24.9
Agnico Eagle 1,118 Barrick Gold 18.7
Pan American** 1,093 Newcrest 18.0
Yamana 1,074 Centerra 12.0
Newmont*** 1,061 Pan American 11.4
AngloGold 1,031 Endeavour 11.0
Petropavlovsk* 1,020 Yamana 10.0
Barrick Gold 1,015 Newmont 10.0
Kinross 988 IAMGOLD 7.7
Gold Fields* 970 Kinross 6.8
Hochschild* 965 AngloGold 2.9
Fresnillo 964 Hochschild -0.8
Endeavour 918 Gold Fields -1.1
Eldorado 902 Polymetal -2.7
Centamin 899 Centamin -4.0
Newcrest 880 Petropavlovsk -5.0
Polymetal 880 Fresnillo -6.0
Centerra 790 Eldorado -7.7
B2 Gold 717 B2 Gold -18.7
Source: Companies’ data.
* 2019 data used
** Au/Ag rate calculated based on the Company’s average realised prices
*** Gold segment dataPOLYMETAL INTERNATIONAL PLC INVESTOR PRESENTATION 18
DPS DYNAMICS BY PEER
DECLARED DPS CHANGE (H1 2020 vs H1 2019)
Gold Fields 167%
Yamana 121%
Polymetal 100%
Barrick 88%
Newmont 79%
AgnicoEagle 60%
Centamin 50%
Pan American 43%
Gold 26%
Newcrest 13%
Fresnillo -18%
Hochschild -100%
Endeavour No dividends paid
Kinross No dividends paid
B2Gold No dividends paid
Source: Thomson ReutersPOLYMETAL INTERNATIONAL PLC INVESTOR PRESENTATION 19
BALANCE SHEET
Net Debt/EBITDA down to 1.3x
Net debt of $1.7bn as of 01 July 2020 with 1.3x Net Low cost of debt at 3.6%, a decrease over 1H
Debt/EBITDA, below 2019 year-end number of 1.4x 2019 number of 4.5% supported by lower
and our mid-term target of 1.5x benchmark interest rates and our ability to
negotiate competitive margins given the solid
financial position of the Company and its
excellent credit history
ACTUAL MATURITY PROFILE1, $m INTEREST RATE BREAKDOWN2
422
Fixed Floating
287 73% 27%
264
216
127 127 127 127
- 2
2020 2021 2022 2023 2024 2025 2026 2027 2028 2029
Notes:
1) Net of cash
2) Excluding short-term (up to 6 months) loans04 PROJECTS UPDATE
POLYMETAL INTERNATIONAL PLC                                     INVESTOR PRESENTATION        21

NEZHDA
Completion scorecard
                                                             Equipment
                                 Engineering
                           Permitting          Contracting                    Construction
                                                              delivery

            Processing
               plant                95%           95%          80%                65%
           main building

             Crusher                100%          100%         100%                90%

          Site roads and
                                    100%          100%         100%                95%
              bridges

         Power complex              100%          100%         95%                 25%

          Infrastructure
                                    100%          100%         100%               100%
            and camp

         Tailings storage
                                    80%           70%          50%                 50%
            facility #1
POLYMETAL INTERNATIONAL PLC INVESTOR PRESENTATION 22 NEZHDA Photo update: concentrator building completed
POLYMETAL INTERNATIONAL PLC             INVESTOR PRESENTATION   23

NEZHDA
Photo update: SAG and ball mills installed
POLYMETAL INTERNATIONAL PLC   INVESTOR PRESENTATION   24

NEZHDA
Photo update: pit #2
POLYMETAL INTERNATIONAL PLC INVESTOR PRESENTATION 25 NEZHDA Key project milestones Q1 2019 Start of construction Q3 2019 First ore mined Q4 2019 Plant framework construction and winterization Q1 2020 Start of equipment installation Q4 2020 • Commissioning of diesel power plant completed Q2 2021 • Mechanical completion Q3 2021 • Start of commissioning activities Q4 2021 • End of commissioning activities and first production Q2 2022 • Full ramp-up Q3 2022 • Grid power to the production site
POLYMETAL INTERNATIONAL PLC                                     INVESTOR PRESENTATION      26

POX-2
Completion scorecard

                                 Basic       Detailed
                                                          Contracting       Construction
                              engineering   engineering

      POX area
                                 100%          65%           95%                 15%
    (Hatch scope)

 Other processing
 areas (Polymetal                85%           50%           85%                 10%
      scope)

 Cryogenic oxygen
                                 100%          95%           95%                 10%
      plant

    Internal and
      external                   80%           50%           25%                 15%
   infrastructure
POLYMETAL INTERNATIONAL PLC INVESTOR PRESENTATION 27 POX-2 Photo update: autoclave installed
POLYMETAL INTERNATIONAL PLC   INVESTOR PRESENTATION   28

POX-2
Photo update: site view
POLYMETAL INTERNATIONAL PLC INVESTOR PRESENTATION 29
POX-2
2020 key milestones
H1 2020 Completion of autoclave foundation
Completion of POX building foundation
Construction of new concentrate storage
H2 2020 Autoclave delivery and installation
• Completion of POX-2 building framework
Q4 2022 • Mechanical completion
Q3 2023 • First production
Q4 2023 • Full ramp-upPOLYMETAL INTERNATIONAL PLC INVESTOR PRESENTATION 30
VEDUGA
Conceptual project highlights
Concentrator capacity 1.5 Mtpa
Ore Reserves 18.7 Mt of ore @ 4.5 g/t containg 2.7 Moz of gold
Recoveries in dore* 88%
Annual production* 220 Koz of gold
TCC/AISC* $600-650 per oz / $700-750 per oz
LOM 20+ years (combined open-pit and underground)
CAPEX ~ $400m
Processing Conventional flotation + Amursk POX
Tailings Dry cake
* LOM averagePOLYMETAL INTERNATIONAL PLC INVESTOR PRESENTATION 31 VEDUGA Conceptual project schedule Q4 2021 • Investment decision Q1 2022 • Start of pre-stripping Q2 2022 • Start of construction Q1 2025 • First production. End of construction Q2 2025 • Full ramp-up
05
OUTLOOK
POLYMETAL INTERNATIONAL PLC                                                                                         INVESTOR PRESENTATION              33

PRODUCTION OUTLOOK
2020-2025
     GOLD PRODUCTION, GE Koz1

      Stay-in-business                     POX-22                 Nezhda                  Veduga3                                    PRODUCTION
                                                                                                                                     UPSIDE:
                                                                                                                                     17%

                                                                                                                                            1,750
                                                                                                            1,700           1,700
                                                                                            1,600                                                   150
                                                                 1,500                                               80             120
         1,496                       1,500
                                                                                                    180             180             180             120
                                                                                   30
                                                                                                    1,420           1,440                           180
                                                                                 1,470                                              1,400
                                                                                                                                                    1,300

        2019                         2020E                       2021E                     2022E            2023E           2024E           2025E
        Restated
Notes:
1) Gold equivalent (GE) including gold and silver at 120:1 Ag oz/Au oz conversion ratio
2) Effect from recoveries increase and 3rd party concentrate processing
3) Subject to Board approval in 2021
POLYMETAL INTERNATIONAL PLC INVESTOR PRESENTATION 34
CAPEX OUTLOOK
2020-2025
CAPEX, $m
Stay-in-business POX-2 Long-term projects
Nezhda Veduga1
475
446 445
436 22
30 410
125 50
56
108 375 30 365
133 30 120 160
50
40
130
83 80 80
25
247 235 235
225 225 235
198
2019A 2020E 2021E 2022E 2023E 2024E 2025E
Notes:
1) Subject to Board approval in 2021POLYMETAL INTERNATIONAL PLC INVESTOR PRESENTATION 35
2020 GUIDANCE
The Company is on track to meet 2020 1H 2020 2020
its guidance on all key metrics Guidance Actual Outlook
Despite 1H 2020 TCC was below Production, Koz of GE 1,500 723 On track
the guidance, Polymetal reiterates
its full-year guidance range of TCC, $/oz of GE 650-700 636 On track
$650-700/GE oz for TCC and $850-
900/GE oz for AISC as depreciation AISC, $/oz of GE 850-900 880 On track
of RUB and Kazakh Tenge is
currently counterbalanced by Capital expenditure, $m 475 248 On track
COVID-related costs and increase in
Free cash flow (pre M&A) Growth 53 On track
mining tax on the back of rising
gold and silver prices
50% of
Regular dividend underlying $189 m
net income
Net Debt/ Adjusted 1.3x (1.4x as at
Down On track
EBITDA 2019YE)
Assumptions 2020 Budget 1H 2020 Actual Current
Gold, $/oz 1,400 1,661 1,930
Silver, $/oz 17 17 26
RUB/USD rate 63 69 74
Note: the guidance remains contingent on the RUB/USD
Oil 60 42 45
exchange rate and diesel fuel pricePOLYMETAL INTERNATIONAL PLC INVESTOR PRESENTATION 36
2020 NEWS FLOW
Corporate
25 September Interim dividend payment
9 November Analyst & Investor day: growth projects
Projects
Tomtor – initial Mineral Resources estimate announcement
Q3
Prognoz – initial Ore Reserve estimate announcement
Kutyn – completion of strategic review
Q4 East Bakyrchik – initial Ore Reserve estimate announcement
POX-2 – completion of framework constructionAPPENDIX
POLYMETAL INTERNATIONAL PLC                                                                                                                            INVESTOR PRESENTATION                                         38

FOCUS ON LOM
    AVERAGE LIFE OF MINE AS OF 01.01.2020, YEARS

    28
               26

                              20                                                  +3 years
                                                                                       by 2022E
                                        17
                                                 16              16          16

                                                                                         13           13         13
                                                                                                                            11             11            10

                                                                                                                                                                          7           7
                                                                                                                                                                                                6

                                                                                                                                                                                                         2
                              Newmont

                                                                 Anglogold

                                                                                                                 Centerra
                Gold Fields

                                        Polyus

                                                                                                      Centamin

                                                                                                                                                                                                        Hochschild
    Newcrest

                                                                                          Polymetal

                                                                                                                                           Endeavour

                                                                                                                                                                                     Kinross

                                                                                                                                                                                               B2Gold
                                                                             Barrick

                                                                                                                            Pan American

                                                                                                                                                          Agnico Eagle

                                                                                                                                                                         Fresnillo
                                                 Petropavlovsk

Notes:
P+P reserves as of 01.01.2020 divided by 2019 depletion.
POLYMETAL INTERNATIONAL PLC INVESTOR PRESENTATION 39
1H 2020 – PRODUCTION AND COSTS
Strong performance at Kyzyl compensated for the planned decline at Svetloye and Voro and
contributed to the cost dynamics along with RUB/KZT weakness
Production, GE Koz TCC, $/oz
Mine Comment
1H 2020 1H 2019 Change 1H 2020 1H 2019 Change
Material positive grade reconciliation and
Kyzyl 213 159 +33% 386 407 -5%
design capacity outperformance
Grade increase attributable to processing of
Albazino 140 136 +2% 735 754 -2%
higher grade ore from Anfisa pit
Moderate decrease in silver grade offset by
Dukat 104 108 -4% 9.8 10.0 -2%
RUB depreciation
Processing of gold-rich ore from Yolochka and
Omolon 88 95 -8% 602 832 -28%
Birkachan underground in Q2
Treatment of additional volumes of higher cost
Varvara 84 70 +21% 881 708 +24%
and gold-rich 3rd party ore
Lower stacking volumes impacted by
Svetloye 52 61 -15% 410 388 +6%
maintenance shutdown in Q2
Voro 42 56 -25% 440 381 +16% Processing of lower-grade stockpiles
Mayskoye 1 5 -79% Na Nm na
TOTAL
(continuing 723 691 +5% 638 667 -4%
operations)
TOTAL 723 694 +4%POLYMETAL INTERNATIONAL PLC INVESTOR PRESENTATION 40
TOTAL CASH COSTS
Down due to weakness in RUB/KZT supported by change
in production structure towards lower cost operations
TCC RECONCILIATION1, $/oz
667 -4%
+7 638
+10 +6
+14
-38 +18
-27
-19
1H 2019 FOREX rate Change in Change Domestic Mining tax COVID Au/Ag Other 1H 2020
change sales in grade inflation change extra costs ratio change
structure
Notes:
1) Co-product total cash cost: cost of sales + on-mine part of SG&A – deprecation and amortization. GE (gold equivalent) based on actual realized gold, silver and copper pricesPOLYMETAL INTERNATIONAL PLC INVESTOR PRESENTATION 41
COST STRUCTURE AND SENSITVITY
2020E CASH COST STRUCTURE, $/oz
RUB 48%
$ / Au RUB/Tenge
Royalty 9% Services 27%
Diesel 16%
RUB/ Tenge Diesel
Labor 19% Fuel 16%
$ 19%
RUB / Tenge $ / RUB /Tenge
Utilities 3% Non-fuel
consumables 24% Tenge 17%
RUB/USD EXCHAGE RATE
85 1H 2019 average 65.1 2H 2019 average 64.2 1H 2020 average 69.3
80
75
70.4
70 67.1
63.0 62.0
65
60
55
50
Jan-19 Mar-19 May-19 Jul-19 Sep-19 Nov-19 Jan-20 Mar-20 May-20 Jul-20POLYMETAL INTERNATIONAL PLC INVESTOR PRESENTATION 42
SENSITIVITY ANALYSIS
SENSITIVITY TO RUB/USD AND GOLD PRICE
1 RUB/USD movement in $100/oz movement
domestic currency in gold price
TCC $7-10/oz ~$5/oz
EBITDA $12-17m ~$150m
FCF $13-18m ~$120m
DPS (regular) ~$0.03 ~$0.13POLYMETAL INTERNATIONAL PLC INVESTOR PRESENTATION 43
TAX REGULATION UPDATE
Russian and Kazakhstan taxation overview
Key taxes imposed Russia Kazakhstan
General rate - 20% (since 2008).
Different preferential tax regimes may General rate - 20% (since 2008)
decrease the tax rate up to 0%
Income tax Paid in 2019 - $18.5m
Paid in 2019 - $85.9m
Effective tax rate 2019 – 22.9%
Effective tax rate 2019 – 14.2%
General rate - 6% for Au / 6.5% for Ag General rate - 5% for Au, Ag (since 2011).
Royalty (since 2002). Calculated based on the Calculated based on the market price of precious
(Mineral extraction tax, realized selling price metals contained in the ore extracted
or MET)
Paid in 2019 - $68.0m Paid in 2019 - $45.4m
WHT on intragroup General rate - 15% (since 2002) General rate - 15% (since 2008)
dividends Applicable Russia-Cyprus rate - 5% Applicable Kazakhstan-Cyprus rate - 5%POLYMETAL INTERNATIONAL PLC INVESTOR PRESENTATION 44
TAX REGULATION UPDATE
Latest tax initiatives
Latest tax initiatives Status
RUSSIA
Proposal to increase withholding tax rate on dividends under DTT with Cyprus in
the light of COVID-19 economic impact mitigation measures
Current lowest available rate for the Group: 5% WHT
After amendments: 15% WHT Certain
Timing: to be enacted 1 Jan 2021
Details still to be clarified - Cyprus might want to negotiate some exemptions, e.g. to listed
entities
Potential increase of income tax rate for mining companies rather than oil and gas
sector
As an alternative mechanism an introduction of an additional income tax is discussed (already Under discussion
applied for closed list of oil and gas projects) with excess profit withdrawal based on EBITDA
margin
KAZAKHSTAN
Potential increase of the income tax rate for companies of mining sector by 7%
Under discussion
(to 27%)POLYMETAL INTERNATIONAL PLC INVESTOR PRESENTATION 45
BROWNFIELD PROJECTS
Average annual Average
Start CAPEX,
Project LOM production, AISC, Target
-up $m
Koz $/oz
Primorskoye 2022 7 4 30 750-800 Dukat LOM extension
Conveyors plus electric
Mayskoye AISC down fleet to reduce ventilation,
2022 30 10+ -
haulage by $150 fuel consumption and
carbon footprint
Mayskoye AISC down Reduce dilution,
2023 40 10+ +30
backfill by $100 improve grade
Refractory processing to
Voro
2022 90 9 70 500-550 complement ore stockpiles
flotation plant
treatment
Nevenrekan 2023 7 3 50 700-750 Omolon LOM extension
Replace low-grade
Elevator 2024 20 4 50 800-850
Varvara orePOLYMETAL INTERNATIONAL PLC INVESTOR PRESENTATION 46
COMPARISON OF RUSSIAN POX PROJECTS
Parameters POX-1 POX-2 Petropavlovsk
Construction period 5 years 5 years ! 8 years
Working volume, m3 150 1,100 ! 250 x 4
Concentrate processing
225 300 500
capacity, Ktpa
100% in 2019 40% in 2019;
Capacity utilization NA
100% in H1 2020 52% in H1 2020
430 in 2019 500 180 in 2019;
Production, Koz of gold
260 in H1 2020 annual average ! 178 in H1 2020
Operational temperature, ˚С 200 240 ! 225
Pressure, bar 22 45 ! 35
Tailings storage Dry stacking Dry stacking ! Downstream TSF
Fresh water consumption, % of
23% in 2019 25% target ! 50% target
total water consumption
CAPEX, USD m 272 431 310POLYMETAL INTERNATIONAL PLC INVESTOR PRESENTATION 47
VEDUGA
Long section
W
Indicated MR
Inferred MR
Intermediate
Western pit pit South Eastern South Eastern
Central pit
pit 1 pit 2
Arrow
pitPOLYMETAL INTERNATIONAL PLC INVESTOR PRESENTATION 48
VEDUGA
Ore Reserve increase potential
CENTRAL PIT
12.7
26.9 50.9
Design Pit 8.7
4.4 7.3 Actual Pit
14.3 30.6
6.5 6.6
18.1
XX True width, m 7.6
XX Grade, g/t
16.6
16.7
6.6
6.9
15.7
7.2
13.8
11/1
6.2
3.6
8.3
8.9 17.8
5.5
12.3
5.5 8.4
5.2
7.8 15.4 4.4
5.0
45.6
66,3
10.5
6,7 38.6 3.5
6.9 4.1
7.8
7.8
49.7
5.6POLYMETAL INTERNATIONAL PLC INVESTOR PRESENTATION 49
LONG-TERM GROWTH PIPELINE
Conceptual projects highlights
PROGNOZ VIKSHA
Ownership: 100% Ownership: 100%
Mineral Resources: 256 Moz at 789 g/t Ag eq
Mineral Resources: 165 Mt at 1.1 g/t, total
Capacity: 1 Mtpa content of 5.7 Moz of PdEq (6.1 Moz of 3E)
Mining: ~8 years of open pit followed by ~10
years of underground Mining: Open-pit (300 m pit depth, 8 m average
reef width)
Processing: Flotation + Leaching + Merrill-Crowe
Production: ~20 Moz of Ag eq per annum Processing: Flotation
CAPEX: ~$250m
Next steps: Initial Ore Reserves estimate in 2H
Next steps: Initial Ore Reserves estimate in 2H 2021
2020; Investment decision in 2H 2021POLYMETAL INTERNATIONAL PLC INVESTOR PRESENTATION 50 DISCLAIMER This presentation includes forward-looking statements technological and market change in the industries in management in the market in which the Company that involve known and unknown risks and which the Company operates, as well as other risks operates. While the Company believes that such uncertainties, many of which are beyond the specifically related to the Company and its operations. research and estimates are reasonable and reliable, Company’s control and all of which are based on the Past performance should not be taken as an indication they, and their underlying methodology and directors’ beliefs and expectations about future or guarantee of future results, and no representation assumptions, have not been verified by any events. These forward-looking statements include or warranty, express or implied, is made regarding independent source for accuracy or completeness and statements concerning plans, objectives, goals, future performance. Neither the Company, nor any of are subject to change without notice. Accordingly, strategies, future events or performance, and its agents, employees or advisors intend or have any undue reliance should not be placed on any of the underlying assumptions, predictions and other duty or obligation to supplement, amend, update or industry, market or competitive position data statements, which are other than statements of revise any of the forward-looking statements contained in this presentation. The information historical facts. The words “believe,” “expect,” contained in this presentation. to reflect any change contained in this presentation has not been “anticipate,” “intends,” “estimate,” “forecast,” in their expectations or any change in events, independently verified. Neither the Company, any of “project,” “will,” “may,” “should”, “shall”, “could”, “risk”, conditions or circumstances on which such its affiliates, subsidiaries or subsidiary undertakings “aims”, “plans”, “predicts”, “continues”, “assumes”, statements are based nor any of their respective advisors or representatives “positioned” and similar expressions or the negative makes any representation or warranty, express or thereof identify certain of the forward-looking Nothing in this presentation constitutes an offer, implied, and no reliance should be placed on the statements. Forward-looking statements include invitation, recommendation to purchase, sell or fairness, accuracy, completeness or correctness of the statements regarding: strategies, outlook and growth subscribe for any securities in any jurisdiction or information or opinions contained in this presentation. prospects; future plans and potential for future solicitation of any offer to purchase, sell or subscribe Percentages and certain amounts included in this growth; liquidity, capital resources and capital for any securities in any jurisdiction and neither the presentation have been rounded for ease of expenditures; growth in demand for products; issue of the information nor anything contained herein presentation. Accordingly figures shown as totals in economic outlook and industry trends; developments shall form the basis of or be relied upon in connection certain tables may not be the precise sum of the of markets; the impact of regulatory initiatives; and with, or act as any inducement to enter into, any figures that precede them. Neither the Company, or the strength of competitors. The forward-looking investment activity. any of its affiliates, advisors or representatives statements in this presentation are based upon accepts any liability whatsoever (in negligence or various assumptions and predictions, many of which To the extent available, the industry, market and otherwise) for any loss howsoever arising from any are based, in turn, upon further assumptions and competitive position data contained in this information contained in the presentation. predictions, including, without limitation, presentation come from official or third party sources. management’s examination of historical operating Third party industry publications, studies and surveys trends, data contained in the Company’s records and generally state that the data contained therein have other data available from third parties. Although the been obtained from sources believed to be reliable, Company believes that these assumptions were but that there is no guarantee of the accuracy or reasonable when made, these assumptions are completeness of such data. While the Company inherently subject to significant uncertainties and believes that each of these publications, studies and contingencies which are difficult or impossible to surveys has been prepared by a reputable source, the predict and are beyond its control, and the Company Company has not independently verified the data may not achieve or accomplish these expectations, contained therein. In addition, certain of the industry, beliefs or projections. Many factors could cause the market and competitive position data contained in this actual results to differ materially from those contained presentation come from the Company's own internal in predictions or forward-looking statements of the research and estimates based on the knowledge and Company, including, among others, general economic experience of the Company's conditions, the competitive environment, risks associated with operating in Russia and Kazakhstan, rapid
You can also read