Investor presentation - January 2022 - Hamburger Hafen und Logistik AG
←
→
Page content transcription
If your browser does not render page correctly, please read the page content below
Investor presentation

January 2022

                        © Hamburger Hafen und Logistik AG
Agenda

01              HHLA at a glance                                                                                                                                 04   Fact book
                page 3

02              Investment case                                                                                                                                                   Port Logistics
                page 7                                                                                                                                                            page 25

03              Financial performance 1-9 │2021                                                                                                                                   Container segment
                and guidance 2021
                                                                                                                                                                                  page 28
                page 17
                                                                                                                                                                              Intermodal segment
Disclaimer
The facts and information contained herein are as up to date as is reasonably possible and are subject to revision in the future. Neither the Company                         page 44
nor any of its parent or subsidiary undertakings nor any of such person’s directors, officers, employees or advisors nor any other person makes any
representation or warranty, express or implied as to, and no reliance should be placed on, the accuracy or completeness of the information contained
in this presentation. Neither the Company, nor any of its parents or subsidiary undertakings nor any of their directors, employees and advisors nor any
other person shall have any liability whatsoever for loss howsoever arising, directly or indirectly, from any use of this presentation. The same applies to
information contained in other material made available at the presentation. While all reasonable care has been taken to ensure that the facts stated                          Logistics segment
herein are accurate and that the opinions contained herein are fair and reasonable, this document is selective in nature. Where any information and

                                                                                                                                                                              page 52
statistics are quoted from any external source, such information or statistics should not be interpreted as having been adopted or endorsed by the
Company as being accurate. This presentation contains forward-looking statements relating to the business, financial performance and results of the
Company and/or the industry in which the Company operates. These statements generally are identified by words such as “believes”, “expects”,
“predicts”, “intends”, “projects”, “plans”, “estimates”, “aims”, “foresees”, “anticipates”, “targets” and similar expressions. The forward-looking statements,
including but not limited to assumptions, opinions and views of the Company for information from third party sources, contained in this presentation are

                                                                                                                                                                              ESG
based on current plans, estimates, assumptions and projections and involve uncertainties and risks. Various factors could cause actual future results,
performance or events to differ materially from those described in these statements. The Company does not represent or guarantee that the
assumptions underlying such forward-looking statements are free from errors and the Company does not accept any responsibility for the future
accuracy of the opinions expressed in this presentation. No obligation is assumed to update any forward-looking statements. By accepting this
presentation you acknowledge that you will be solely responsible for your own assessment of the market and the market position of the Company and
that you will conduct your own analysis and be solely responsible for forming your own view of the potential future performance of the Company’s
                                                                                                                                                                              page 55
business. This presentation is not a prospectus and does not constitute an offer or an invitation or solicitation to subscribe for, or purchase, any shares
of the Company and neither this presentation nor anything contained herein shall form the basis of, or be relied on in connection with, any offer or
commitment whatsoever.

                      January 2022                     Investor presentation                                                                                                                          © Hamburger Hafen und Logistik AG   2
At a glance

                                       Hamburger Hafen und Logistik AG (HHLA) is a leading European
                                       logistics company. Listed on the stock exchange since 2007.

                                       With a tight network of container terminals in Hamburg, Odessa,
                                       Tallinn and Trieste, excellent hinterland connections and well-
                                       connected intermodal hubs in Central and Eastern Europe,
                                       HHLA represents a logistics and digital hub along the transport
                                       streams of the future. Its business model is based on innovative
                                       technologies and is committed to sustainability.

January 2022   Investor presentation                                                       © Hamburger Hafen und Logistik AG     3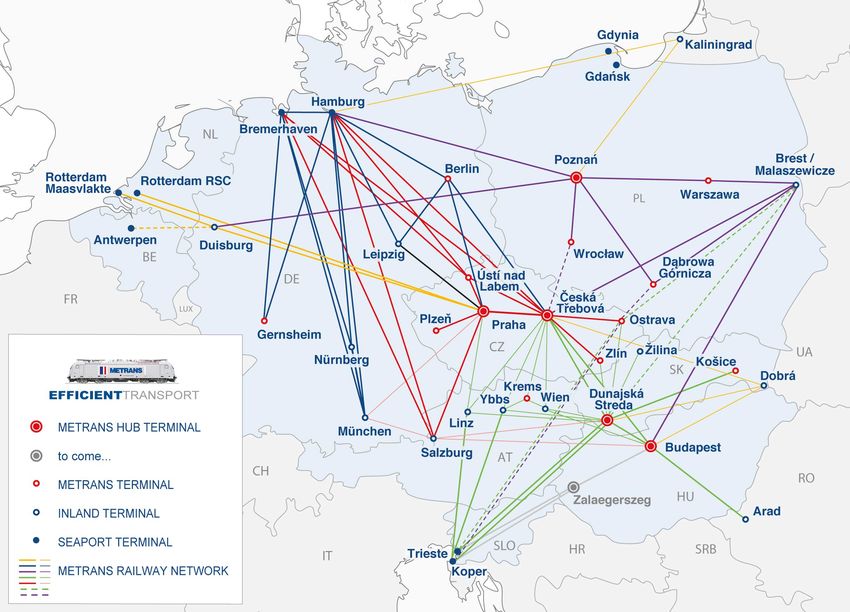
At a glance
One of Europe’s leading logistics companies
Group is divided into two subgroups: Port Logistics and Real Estate
Group
Subgroups Port Logistics Real Estate
Shareholder Listed class A shares Non-listed class S shares
structure
Free and Hanseatic City of Hamburg (FHH)
holds 69.0 % of the listed class A shares
Class A shares comprise all segments 69.0 %
Free and 100 %
of the Port Logistics subgroup
Hanseatic City Free and
(Container, Intermodal, Logistics) of Hamburg Hanseatic City
Index affiliation: SDAX 31.0 % of Hamburg
Stock exchanges: Free float
Frankfurt am Main, Hamburg
Segments Container Intermodal Logistics Real Estate
January 2022 Investor presentation © Hamburger Hafen und Logistik AG 4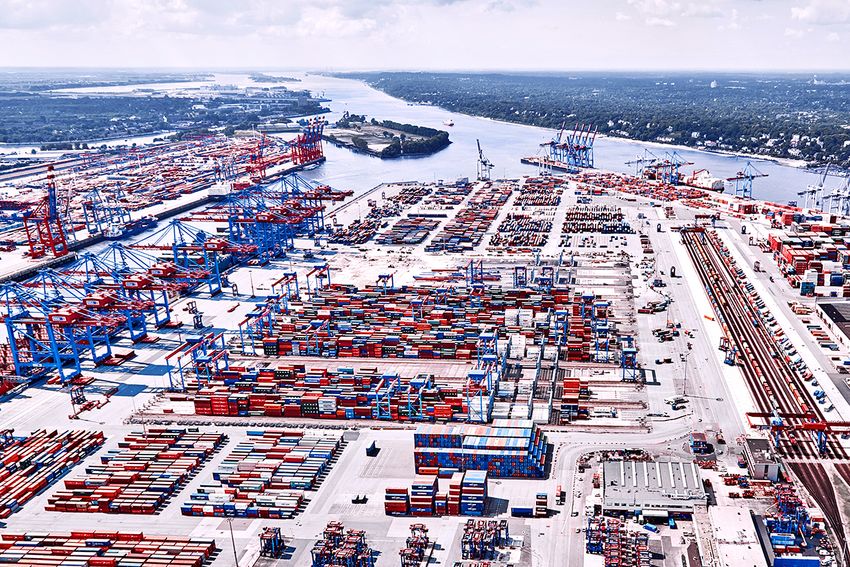
At a glance
Executive Board
Experienced management with focus on strengthening the creative power and future viability of HHLA
Executive Board
Angela Titzrath Dr. Roland Lappin Jens Hansen Torsten Seebold
First appointment October 2016 First appointment May 2003 First appointment April 2017 First appointment April 2019
Chairwoman Chief Financial Officer Chief Operating Officer Chief HR Officer
Corporate development Finance and controlling Container operations Human resources
Corporate communications (including organisation) Technology Purchasing and materials
Sustainability Investor relations Information systems management
Container sales Internal audit Health and safety in the
Real Estate segment workplace
Intermodal segment
Legal and insurance
Logistics segment
January 2022 Investor presentation © Hamburger Hafen und Logistik AG 5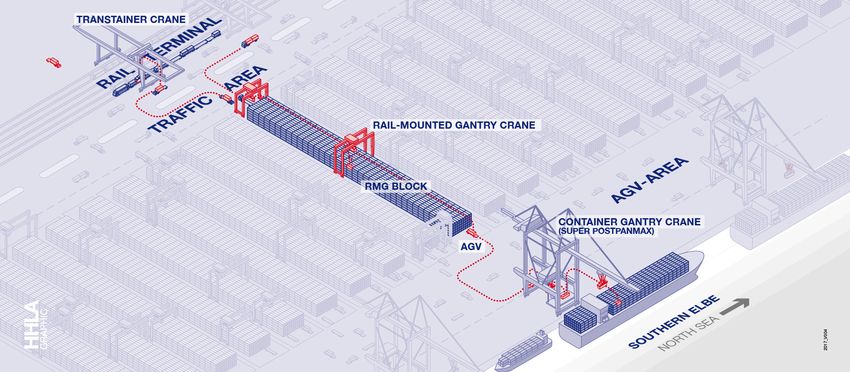
At a glance
Port Logistics subgroup well positioned along vertical logistic chain services
State-of-the-art container throughput and transport services supported by specialised and new logistic activities
Key figures 2020
Container segment Throughput Revenue Revenue share
Three container terminals in Hamburg with a local market share of 74 % 6,776 k TEU € 737.5 m
Terminals in Odessa (UKR) and Tallinn (EST); majority stake in Trieste (ITA)
Container handling and transfer between modes of transport (ship, rail, truck) EBIT EBIT margin 58 %
Container-related services (e.g. storage, maintenance, repair) € 65.4 m 8.9 %
Intermodal segment Transport Revenue Revenue share
Container transport via rail and truck in the ports’ hinterland 1,536 k TEU € 476.8 m
Loading and unloading of carriers
Operation of five hub terminals and nine inland terminals in CEE EBIT EBIT margin 38 %
Around 450 regular train connections per week with own fleet € 88.3 m 18.5 %
Logistics segment Revenue EBIT Revenue share
Specialist handling of dry bulk, general cargo, vehicles, fruit, etc. € 51.4 m € -3.9 m
New business activities, such as additive manufacturing,
airborne logistics services, etc. 4%
At-equity earnings EBIT margin
Consulting and training € 3.4 m € - 7.5 %
January 2022 Investor presentation © Hamburger Hafen und Logistik AG 6
Investment case

 January 2022   Investor presentation   © Hamburger Hafen und Logistik AG   7
Investment case

Investment case
At a glance

                                              THE logistical and digitally innovative hub

                                              Favourable geographical location in a market with solid growth outlook

                                              Well-invested asset base with state-of-the-art technology

                                              Solid financial foundation with strong cash flows

                                              Balanced logistics – environmental protection and sustainability approach

                                              Ambition 2025: Growth and efficiency as guiding principles

       January 2022   Investor presentation                                                         © Hamburger Hafen und Logistik AG   8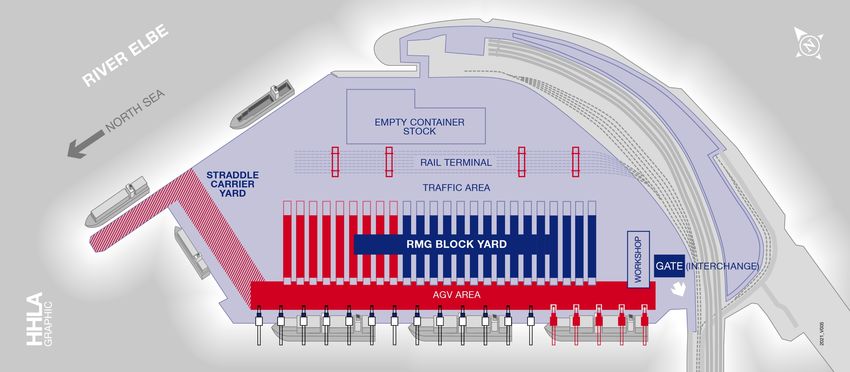
Investment case

Local player well connected to Central Eastern Europe and Asia
Further internationalisation, digitalisation and automation will be main drivers for future growth
                                                                                                     NORTHERN EUROPE ‒ FAR EAST
                                                                                                              maritime

    Internationalisation
    will continue with HHLA benefitting
    from new transport routes                                                                     CONTINENTAL SILK ROAD
                                                                                                           rail

     Digitalisation & automation
                                                                                          ●
     will open up further opportunities                                           ●
     and HHLA will benefit from new                                                   ●       ●
     and optimised logistic processes          TRANSPACIFIC       TRANSATLANTIC                                                  TRANSPACIFIC

Strategic levers of HHLA
                                                                                                                 Tallinn    ●
    Strengthening the existing core business
    Exploiting growth opportunities along                                                               ● Hamburg
    transport streams of the future
    Improving efficiency by automation
                                                                                                             ●           Odessa      ●
    and growing sustainably                                                                        Trieste

    Striving for climate neutrality by 2040

        January 2022   Investor presentation                                                           © Hamburger Hafen und Logistik AG   9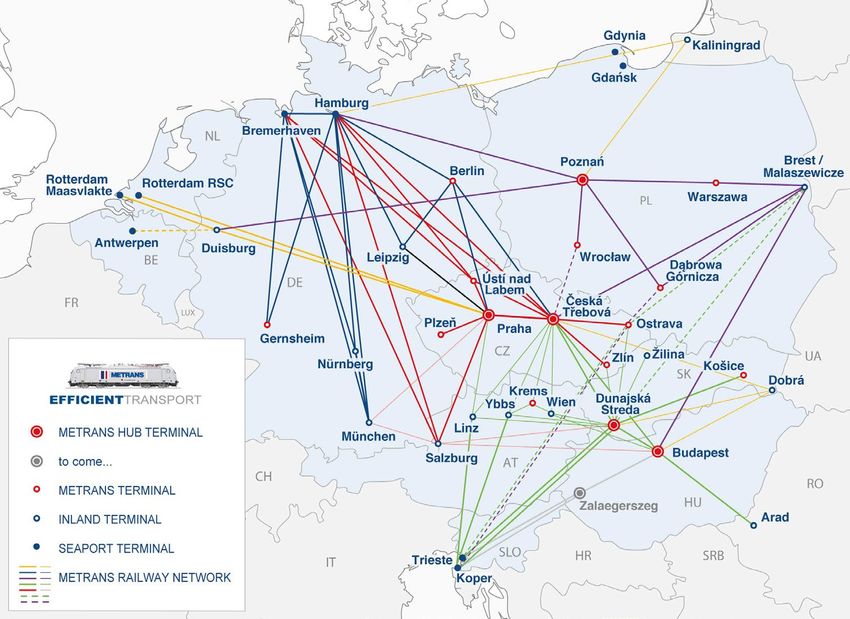
Investment case
Dense rail network connect own port terminals within CEE and towards Asia
Favourable geographical location in markets with robust economies
Located at Germany’s largest
logistics hub with excellent hinterland
Europe’s largest railway port with a
dense rail network in CEE and the west
to the new silk road
● Owing 5 hubs and 12 hinterland terminals
○
as well as light-weighted railway wagons and
state-of-art locomotives
Traction with cross-border transport solutions
Offering climate friendly modes of transport
January 2022 Investor presentation © Hamburger Hafen und Logistik AG 10Investment case
Well-invested asset base
Operations with state-of-the-art technology
Operating cash flow
State-of-the-art handling technology, innovative IT systems and a high level of Self-funded investments
Investing cash flow
in € million
automation (without proceeds for
short-term deposits)
In line with client needs: Three fully equipped berths for mega carriers in
303,0
operation at the container terminals Burchardkai (CTB) and Tollerort (CTT) 258,9 271,4
218,7 214,8
Further rollout of additional automated block storage capacities at CTB
192,6
On-dock railway stations at all facilities able to comply with future 740m block trains 163,8 160,0
124,0
101,8
Optimised traffic coordination for an improved cargo flow and terminal access
HHLA Pure: climate-neutral handling and transport from the port to the hinterland 2016 2017 2018 2019 2020
Rollout of additional automated block storage Own fleet of multi-system locomotives Own designed light-weighted wagons
January 2022 Investor presentation © Hamburger Hafen und Logistik AG 11Investment case
Solid financial track record with strong cash flows even in recent years …
… with high market volatility that required exceptional operational flexibility due to Coronavirus pandemic
Equity development Ø Capital employed / ROCE Since 2019: Profit after tax and minorities
Capital employed
in € million in € million in € million
including right of use
Equity ratio in % Net debt / EBITDA ROCE in % (IFRS16) EPS in €
605 1,887 1,924 103
556 564 94
529 526 512 1,588
32.3 33.5 31.7 71 73
1,149 1,154 1,216 64
21.9 21.5 23.6
13.6 15.5 1.47 35
12.8 12.9 1.34
10.5
5.0 5.8 0.91 1.02 1.02
2.4 2.1 2.4 3.9 3.6
0.50
2016 2017 2018 2019 2020 30.09.21 2016 2017 2018 2019 2020 30.09.21 2016 2017 2018 2019 2020 9M21
Net debt Self-funded investments Operating cash flow Dividend development
in € million in € million Investing cash flow in € Payout ratio Dividend yield as of 31.12.
1,395 1,356
Pension provisions 1,308
Lease obligations 303 0.80
496 524 271 0.70
Net financial debt 502 259 0.67
242
219 215 0.59
706 193
636 164 165 0.45
576
124 65 % 66 %
442 773 737 102 106 54 %
453 751 52 % 50 %
442
3% 3% 5% 3% 2%
183 264
134 126 95 55
2016 2017 2018 2019 2020 30.09.21 2016 2017 2018 2019 2020 9M21 2016 2017 2018 2019 2020
Investing cash flow without proceeds for short-term deposits 2020: Pay out ratio adjusted by changes in net provisions
January 2022 Investor presentation © Hamburger Hafen und Logistik AG 12Investment case
Sustainable management anchored in business model
Ambitious climate protection target supported by concrete measures
Excellent prerequisites for green infrastructure in the Port of Hamburg
Europe’s largest railway port with around 165 rail operators
Efficient handling of around 200 freight trains per day with more than 5,000 wagons
2020: Up to 60,000 freight trains with up to 1.6 million wagons handled at the Port of Hamburg
HHLA Pure: climate-neutral handling and transport from the port to the hinterland
Reduction of
Extensive electrification and use of green electricity on the terminals
CO2 emissions
by at least 50% Transport by Metrans with CO2 optimized equipment (e.g. use of hybrid locomotives
designed for heavy-duty shunting and use of light-weighted container wagons
by 2030 (base 2018)
(30% lighter than normal equipment) and “whispering” brakes for 50% reduction of noise)
Unavoidable CO2 emissions are currently offset by certified development projects
Climate neutral according to the highest international Gold standard
until Complete conversion of the diesel-powered AGV fleet to battery-powered AGV by 2021/22
2040
>> reduction of around 15,500 tonnes a year once the system has been completed
Certification of the climate-neutral container throughput and transport service by TÜV Nord
January 2022 Investor presentation © Hamburger Hafen und Logistik AG 13Investment case
Committed to transparency and engaged in dialogue with stakeholders
Sustainability recognition
High standards for high transparency ESG ratings
Scale
HHLA’s commitment to sustainability is binding, transparent,
(high to low)
measurable and comparable
HHLA supports the Sustainable Development Goals (SDGs)
adopted by the UN AAA to CCC A
HHLA applies the Global Reporting Initiative
(GRI 4 standard) guidelines on sustainability reporting
First maritime company to issue a declaration of compliance A+ to D- C-
with the German Sustainability Code (DNK)
HHLA has reported on its carbon footprint regularly since 2008
On the list, but not
as part of the international Carbon Disclosure Project (CDP) 100 to 0
yet finally assessed
All major operating companies certified according to
DIN 50001 (energy management)
A to D- B-
More ESG information on Climate Change
our Sustainability Report
report.hhla.de/annual- 0 to 100 59
report-2020/sustainability Average performaner
January 2022 Investor presentation © Hamburger Hafen und Logistik AG 14Medium-term outlook
Several developments driving HHLA’s transformation process
Advanced momentum through implementation of an efficiency programme in the Container segment
Structural sector developments
HHLA’s response:
01 Ship size development 04 Overcapacity in the North Range targets of the efficiency
Increasing number of mega carriers demands Pressure on pricing due to fierce competition
more efficiency and operational flexibility as
programme
well as investments
Cooperation of port authorities Lean and sustainable
02 Consolidation of shipping liners 05 Consolidation of the port authorities in France, organisational structure
Formation of alliances leads to increased price Belgium and the Netherlands to enhance
and performance pressure efficiency
Improved productivity in line
03 Increasing degree of automation 06 Dedicated terminals prevailed
Many shipping lines have established stakes
with customer expectations
Share of highly automated systems such as CTA
is steadily increasing in terminals, putting HHLA multi-user approach
under pressure Expansion for mega carriers
> 24,000 TEU
Hamburg-specific topics
Laying groundwork for
regaining market share
07 Nautical restrictions solved 08 Infrastructure maintenance
Ongoing infrastructure maintenance and projects,
Elbe dredging completed and fully approved
i.e. replacement of Köhlbrandbrücke, are on track
Reduction of emissions and
energy consumption
January 2022 Investor presentation © Hamburger Hafen und Logistik AG 15Investment case
Focus on three profit sources to fuel our future success
Rationale for 2025
Container Intermodal Logistics
Increase efficiency at Hamburg Expansion of rail terminals and hubs, Moderate increase expected from at-
terminals by further automation i.e. Zalaegerszeg (Hungary) equity earnings
– Targets 2025: Cost savings of € >120m Expansion of hinterland rail network in Strong top-line growth from new
p.a., unit costs reduction of € 30 per box, Central and Eastern Europe by ventures anticipated from 2021
performance increase by ≥ 30 boxes/Cbh increasing frequency on existing onwards
– Automation of block storages and connections and adding new
horizontal transport from the quayside to connections, particularly in Southern Positive EBIT contribution from new
yard via AGV and South-Eastern Europe ventures expected for 2023 onwards
– Further optimisation of the existing Taking advantage of EU green deal Clear commitment to invest in new
systems by using intelligent system control
technologies along future transport
Growing EBIT contribution from streams
international terminals
Striving for efficiency Growing EBIT contribution Positioned for growth
January 2022 Investor presentation © Hamburger Hafen und Logistik AG 16Financial performance 1-9 │2021 and guidance 2021 January 2022 Investor presentation © Hamburger Hafen und Logistik AG 17
Financial performance
Strong increase in revenue and EBIT supported by temporary effects
Favourable growth in container transport volumes; full-year guidance for 2021 raised
Key figures for 1-9│2021
Major achievements
HHLA kept production running 24/7 despite pandemic-related restrictions
Throughput Transport
Automation of block storage at CTB continued
COSCO Shipping Ports receives minority stake of 35 % in Container Terminal Tollerort 5,165 k TEU 1,154 k TEU
HHLA became part of H2Global Foundation and successfully completed joint project + 1.6 % + 11.1 %
with MAN “Hamburg TruckPilot”
Revenue EBIT
Market environment
€ 1,057.5 m € 151.3 m
Several effects worldwide led to persisting imbalances in trade flows, i.e. accident in Suez
+ 12.8 % + 56.7 %
Canal, shutdowns at key export ports in China due to corona outbreaks, fire at a Japanese
semiconductor factory, power supply problems in China
EBIT margin Profit after tax
Ongoing delays in sailing schedules led to high pressure on terminals and hinterland
and minorities
transport systems 14.3 % € 73.1 m
+ 4.0 pp + 133.7 %
Results
Slight increase in container throughput despite loss of a Far East service in previous year;
container transport grew strongly ROCE Operating cash flow
EBIT benefited from temporary increase in storage fees and strong transport volumes 10.5 % € 242.4 m
ROCE exceeds medium- and long-term target of 8.5 % + 3.7 pp + 29.2 %
11 November 18
Analyst conference on the interim results January to September 2021 © Hamburger Hafen und Logistik AG
2021Financial performance
Strong rise in top and bottom line due to temporary increase in storage fees
Container Volume increase mainly driven by Far East as well as Americas shipping regions
Container throughput Revenue Container throughput up by 1.6 % overall,
in thousand TEU in € million mainly driven by Internationals (+4.8 %) whilst
+1.6% +13.1%
Hamburg volumes (+1.3 %) masked by loss of
5,086 5,165 620.0 Far East service in previous year
548.4
Positive volume development driven by
− moderate increase in the shipping regions
Far East, North America and South America
− acquisition of an additional feeder service for
the Baltic Sea region in the third quarter
Average revenue per TEU up by 12.0 % y-o-y
9M20 9M21 9M20 9M21
mainly attributable to
− higher storage fees due to longer dwell times
OpEx EBIT and EBIT margin as a result of ongoing delays in shipping
in € million in € million schedules
+6.7% +57.2% OpEx increased by 6.7% due to
512.1 107.9 – higher external staff and material costs
479.7
– additional provisions for the restructuring
68.7 measures
– union wage rate increases
– ramp-up costs for PLT Italy (Trieste)
12.5% 17.4%
EBIT increased despite higher opex due to
improved revenue quality
9M20 9M21 9M20 9M21
11 November 19
Analyst conference on the interim results January to September 2021 © Hamburger Hafen und Logistik AG
2021Financial performance
Pleasing revenue development driven by increase in rail transport volumes
Intermodal EBIT growth supported by one-off effect from retroactively granted higher subsidy
Container transport Revenue Strong rise in transport volumes driven by
in thousand TEU in € million
+11.1% +9.9% increase in rail transport (+14.0%) while
road transportation kept stable
1,254 383.2
1,129 348.7 Rail share up to 81.4 % (+2.1 pp)
Volume growth was broadly diversified
Revenue increased significantly but lagged
behind volume growth as average revenue
per TEU came down as a result of a change
9M20 9M21 9M20 9M21 in structure of cargo flows
OpEx rise driven by higher personnel
OpEx EBIT and EBIT margin expenses due to increased staff base
in € million in € million
+6.0% +27.5% EBIT development supported by
303.7 79.5 − favourable top line growth and
286.4
62.4
− retroactively granted higher subsidy for
route prices of € 11 m.
EBIT margin increased by 2.9 pp to 20.8 %
17.9% 20.8%
9M20 9M21 9M20 9M21
11 November 20
Analyst conference on the interim results January to September 2021 © Hamburger Hafen und Logistik AG
2021Financial performance
Top line growth supported by first-time consolidation of iSAM AG
Logistics Profitability burdened by start-up losses of new activities
Revenue EBIT Revenue from consolidated companies
in € million in € million
+36.4% pos. increased strongly mainly due to
51.7 ‒ first-time consolidation of automation
specialist iSAM AG (incl. its three
37.9
subsidiaries)
‒ strong increase in vehicle logistics
-2.4
EBIT impacted by temporary increases in
-3.6 start-up losses of new activities
9M20 9M21 9M20 9M21
At-equity earnings recorded a strong
increase overall
At-equity earnings
+30.2%
in € million
2.2
1.7
9M20 9M21
11 November 21
Analyst conference on the interim results January to September 2021 © Hamburger Hafen und Logistik AG
2021Financial performance
Comfortable liquidity position secured by strong cash flow
Port Logistics
in € million
Free cash: 126.1
274.1
31.7
D&A
122.8 107.4
1.1 10.0
15.2 259.9
EBIT 25.5
32.3 50.0
201.3 151.3
0.7
19.1 13.9
40.0
242.4 - 116.3 - 78.2
209.9
161.3 Operating cash flow Investing cash flow Financing cash flow
Financial EBITDA Working Investments Divestments Changes in Dividend Payments Redemption of Redemption Others F/X Financial
fund as capital and short-term paid to minorities lease liabilities of (financial) effects effects fund as
other effects deposits loans
of 01.01. of 30.09.
Financial fund Short-term deposits
11 November 22
Analyst conference on the interim results January to September 2021 © Hamburger Hafen und Logistik AG
2021Guidance 2021
Full-year guidance has been updated
Port Logistics Disruptions to global production and supply chains are expected to persist until 2022
Research estimates for 2021
GDP development Throughput development
by IMF April July October by Drewry March June September
World + 6.0 % + 6.0 % + 5.9 % World + 8.7 % + 10.1 % + 8.2 %
China + 8.4 % + 8.1 % + 8.0 % China + 12.4 % + 12.0 % + 7.1 %
Russia + 3.8 % + 4.4 % + 4.7 % Europe + 4.0 % + 6.8 % + 6.5 %
CEE + 4.4 % + 4.9 % + 6.0 % NW Europe + 0.3 % + 8.1 % + 7.6 %
World trade + 8.4 % + 9.7 % + 9.7 % Scan. & Baltics + 4.1 % + 5.6 % + 6.9 %
Sources: IMF // Drewry Maritime Research
Guidance for the Port Logistics subgroup 2021
2020 1-9│2021 Guidance for 2021
Container throughput 6,776 k TEU 5,165 k TEU Moderate increase
Container transport 1,536 k TEU 1,254 k TEU Significant increase
Revenue € 1,269.3 m € 1,057.5 m Around € 1,410 m (previously: significant increase)
EBIT € 110.3 m € 151.3 m Around € 190 m (previously: in the range of € 140 to 165 m)
Capital expenditure € 178.7 m € 105.3 m Around € 175 m (previously: in the range of € 220 to 250 m)
Liquidity € 201.3 m € 259.9 m sufficient to meet payment obligations at all times
Dividend per A class share € 0.45 commitment to pay out 50 to 70 % of net profit after minority interests
11 November
2021
Analyst conference on the interim results January to September 2021 Level of intensity: slight < moderate < significant < strong © Hamburger Hafen und Logistik AG 23Fact book HHLA Port Logistics subgroup page 25 Container segment page 28 Intermodal segment page 44 Logistics segment page 52 January 2022 Investor presentation © Hamburger Hafen und Logistik AG 24
Fact book

                   HHLA’s successful development since more than 135 years
Port Logistics     From a port logistics operator to a globally vertical integrated service provider

                                                         1992                                                           2012
                                                         HHLA’s rail affiliate Polzug sets the first commercial         Realignment of Intermodal shareholding: HHLA takes over
                                                         container block train to Eastern Europe rolling                89% stake in METRANS and gets full control of Polzug
  1885                                                   1995                                                           2016
  Foundation of HFLG with the                            CTB is the first terminal worldwide to use satellite           Berths at CTB ready to handle the newest generation of ULCV
  aim to build and operate                               data for container positioning in the storage area             2018
  Hamburg’s warehouse
                                                         1995                                                           Acquisition of largest container terminal in Tallinn, Estland
  district; at the time it was the
                                                         HHLA acquires 25 % of shares in METRANS                        2018
  world’s largest and most
  technically advanced                                   1996                                                           Merger of METRANS & Polzug; acquisition of remaining shares
  logistics centre                                       Acquisition of the container terminal at CTT                   2019
                                                                                                                        CTA gets certified as first climate neutral terminal in Europe

                       1960 - 80s                           1990s                            2000s                           2010s                           2020
                      1968                                                               2002                                                           2021
                      First containership is handled at CTB                              Opening of container terminal Altenwerder                      Acquisition of majority stake
                      1972                                                               (CTA), Hamburg – a facility with the highest                   in multi-function terminal PLT
                      1st weekly Asian container service handled at CTB                  degree of automation worldwide at that time                    in Trieste, Italy

                      1976                                                               2007                                                           2021
                      HHLA sets up HPC Hamburg Port Consulting                           Opening of a hub terminal in Dunajska Streda                   Acquisition of majority stake
                                                                                         and further inland terminals                                   in automation specialist iSAM
                      1982
                      Opening of multi-functional terminal O'Swaldkai                    2007
                                                                                         Initial public offering (IPO) of HHLA
                      1984
                      Rollout of mobile data communication at CTB

                 January 2022    Investor presentation                                                                                                        © Hamburger Hafen und Logistik AG      25
Fact book
Key figures
Port Logistics Port Logistics subgroup
in € million 2016 2017 2018 2019 2020
Revenue 1,146.0 1,220.3 1,285.5 1,350.0 1,269.3
EBIT 147.6 156.6 188.4 204.4 110.3
Profit after tax and minorities 63.7 71.2 102.9 93.6 35.3
Earnings per share in € 0.91 1.02 1.47 1.34 0.50
ROCE in % 12.8 13.6 15.5 11.1 5.8
Free cash flow (excl. proceeds from short term deposits) 116.9 134.9 19.8 116.6 111.4
Capex (without Group internal transaction) 136.9 136.4 132.9 214.9 178.7
January 2022 Investor presentation © Hamburger Hafen und Logistik AG 26Fact book
Balance sheet, assets and liabilities
Port Logistics Port Logistics subgroup
in € million 2016 2017 2018 2019 2020
Balance sheet total 1,638.1 1,658.9 1,783.3 2,401.4 2,383.3
Non-current assets 1,165.1 1,184.6 1,280.5 1,936.6 1,953.4
Current assets 473.1 474.4 502.8 464.8 429.9
Equity 528.7 555.8 564.5 525.6 512.5
Pension provisions 453.5 442.1 442.1 496.3 523.9
Other non-current liabilities 452.2 430.8 545.1 1,111.8 1,068.0
Current liabilities 203.7 230.3 231.6 267.7 278.9
January 2022 Investor presentation © Hamburger Hafen und Logistik AG 27Fact book
Key figures
Container Container segment
in € million 2016 2017 2018 2019 2020
Container throughput in thousand TEU 6,658 7,196 7,336 7,577 6.776
Revenues 694.6 746.6 758.9 799.7 737,5
EBITDA 201.5 194.7 209.8 240.2 160,4
EBITDA margin in % 29.0 26.1 27.6 30.0 21,7
EBIT 117.8 109.4 131.6 141.3 65,4
EBIT margin in % 17.0 14.7 17.3 17.7 8,9
Segment assets 824.5 810.8 888.9 1,295.6 1,282.6
January 2022 Investor presentation © Hamburger Hafen und Logistik AG 28Fact book
Growth of global container throughput and GDP
Container Slowdown of growth multiplier on GDP since 2012
Upswing Dip Recovery Decade of convergence Pandemic dip & recovery
Ø multiplier 2.6x 7.3x 2.4x 1.2x ~ 1.0x
20%
15%
10%
5%
0%
2000 2001 2002 2003 2004 2005 2006 2007 2008 2009 2010 2011 2012 2013 2014 2015 2016 2017 2018 2019 2020 2021e 2022e 2023e 2024e
-5%
-10%
Container throughput GDP world
Source: Drewry Maritime Research, Container Forecaster, December 2020 / IMF World Economic Outlook, January 2021
January 2022 Investor presentation © Hamburger Hafen und Logistik AG 29Fact book
Ports are an investment opportunity in GDP growth
Container After a decade of convergence continued growth in line with GDP development expected
Upswing Dip Recovery Decade of convergence Pandemic dip & recovery
in TEU million
800
700
600
500
400
300
200
100
0
2001 2003 2005 2007 2008 2009 2010 2011 2012 2013 2014 2015 2016 2017 2018 2019 2020 2021e 2022e 2023e 2024e
Global thereof Asia thereof Northwest Europe
Global 12.3% -9.3% 11.8% 3.8% ~5%
CAGR
Asia 14.1% -7.9% 13.4% 4.1% ~4%
NW Europe 9.7% -17.1% 6.4% 2.3% ~5%
Source: Drewry Maritime Research, Container Forecaster, December 2021 / HHLA
January 2022 Investor presentation © Hamburger Hafen und Logistik AG 30Fact book
Development of alliances in the Asia − Far East services
Container Concentration in the shipping industry substantially increased
Share Main developments since 2016
FE – Europe
Acquisition of CSCL by COSCO
Acquisition of APL by CMA CGM
37% Insolvency of Hanjin
Acquisition of Hamburg Süd by Maersk
Integration of UASC in Hapag-Lloyd
Acquisition of OOCL by COSCO
Merger of Japanese carriers
38%
Implications
Re-shaping of alliances and cooperation to
improve load factor and slot costs
Consolidation process in the shipping
25% industry led to a highly concentrated
market; only smaller changes expected
Perspectives
Source: HHLA / Deployment of largest vessel sizes and
AXS Alphaliner Monthly
Monitor, March 2021 focus on calls at gateway ports (hubs)
January 2022 Investor presentation © Hamburger Hafen und Logistik AG 31Fact book
Competing ports of the North Range
Container Container throughput and market share development
Throughput and market share of HHLA in 2020
Container throughput in the North Range** 2020 in TEU million
43.1 million TEU (+ 2.4 % y-o-y)
41,9
WILHELMSHAVEN
KIEL
0.4 million TEU CANAL
(- 33.8 y-o-y) 13,7
8,5 6,3
15 % 46 % 74 %
North Range** German Bay Hamburg HHLA
BREMERHAVEN HAMBURG
4.8 million TEU 8.5 million TEU
(- 1.8 % y-o-y) (- 7.9 % y-o-y) CAGR* CAGR* CAGR* CAGR*
ROTTERDAM 1.1% - 0.9% - 1.1 +0.7%
14.3 million TEU HHLA in Hamburg
(- 3.2 % y-o-y) 6.8 million TEU
(- 11.1 % y-o-y) Throughput and market share of HHLA in 2008
in TEU million
36,9
Current terminal capacity
of North Range ports
ZEEBRUGGE ANTWERP of ~ 56.5 million TEU p.a.1 15,3
1.8 million TEU 12.0 million TEU utilisation stands at ~ 71 %2 9,7
(+ 10.3 % y-o-y) (+ 1.4 % y-o-y) 6,9
Sources: Port Authorities / HHLA 20 %
17 % 45 %
40 % 70 %
66 %
1 Drewry Global Container Terminal Operators 2020 (Aug. 2020)
2 HHLA estimates (Drewry capacity estimates / reported volumes)
North Range** German Bay Hamburg HHLA
* CAGR: 2008-2020, ** North Range ports (Antwerp, Rotterdam, Zeebrugge, Hamburg, Bremerhaven / 2018 incl. Amsterdam / 2020 incl. Wilhelmshaven)
January 2022 Investor presentation © Hamburger Hafen und Logistik AG 32Fact book
Favourable geographical location of Hamburg
Container Still a hub for the major economies of Asia and CEE
Sea-bound container throughput in Hamburg FY20 Port of Hamburg: Hub with network
by region
52% Asia Germany’s largest logistics hub
10% Baltic Sea Europe’s largest railway port with dense
BALTIC SEA /
SCANDINAVIA
9% Scandinavia rail network to CEE and dense feeder
9% North America network to the Baltics
7% Latin Amerika
Cost advantages for shipping lines
5% Rest of Europe
3% Africa
due to central location deep inland
5% Other regions Attractive cargo mix
Source: HHLA Well balanced import/export flows
Challenges Potential
Underutilized capacities in most North Elbe dredging already completed;
Range ports puts pressure on pricing full approval anticipated for H2/2021
Formation of alliances leads to increased > adjustment of the waterway enabling a
ASIA / higher load factor, extended time slots and
FAR EAST CENTRAL AND price and performance pressure
EASTERN EUROPE more flexibility for handling of mega carriers
Increasing number of mega carriers
demands more efficiency and operational Ongoing infrastructure projects, i.e. replace-
flexibility as well as investments ment of Köhlbrandbrücke, are on track
Recovery of the Russian economy
January 2022 Investor presentation © Hamburger Hafen und Logistik AG 39Fact book
Far East transport chain
Container Hamburg’s location offers cost benefits compared to other North Range* ports
Shanghai Hamburg
(one-way: ~ 20,375 km)
60 % of costs for about 97 %
700 km = 5 Cent per iPad of total distance
No differentiation in freight rates
between North Range** ports
Hamburg Prague
20,375 km = 7 Cent per iPad
(one-way: ~ 700 km)
40 % of costs for about 3 %
20’ Container = 11,500 iPads
of total distance
Shanghai – Hamburg* = € 800
Hamburg – Prag* = € 520
Clear differentiation between North
Range* ports
12 Cent per iPad per 21,000 km
* as of Dec 2017
** North Range ports (Antwerp, Rotterdam, Hamburg, Bremen Ports incl. Wilhelmshaven)
January 2022 Investor presentation © Hamburger Hafen und Logistik AG 34Fact book
Handling of ultra large container vessels (ULCVs) require extra effort
Container Ongoing growth in ship sizes
Ship size development at HHLA container terminals Implications
2016
Since first call of a 2017
ULCV in 2010, share increased
Nautical restrictions tightened by
2018
to more than 25% 2019 increasing number of mega carriers
39% 41% 40%
2020
35% 34%
because of more width and draught
30% 32% 31%
25% 27% 26%
*
22% 22% Peak load conditions due to narrower time
16% 17% 19%
14% 15% 14% windows requires higher degree of
10%
automation
Capex requirements (suitable quay walls,
< 6,000 TEU 6,000 to 10,000 TEU 10,000 to 14,000 TEU > 14,000 TEU
gantry cranes etc.)
* 2020 trend impacted by loss of a Far East service
ULCV (>10,000 TEU) fleet worldwide and order book until 2022 Counteraction
47
62 Enhancing service quality by continuous
35
56 investment in technology and efficiency
45
50
70 Proper equipment for ULCV’s
61
52
in service
(quay walls, gantry cranes etc.)
75
756
709
653
65 in order
Optimising vessel calls within the port
618
573
523
453
392
340
Raising attractiveness of HHLA terminals
265
200
by expanding hinterland network
2013 2014 2015 2016 2017 2018 2019 2020e 2021e 2022e 2023e
January 2022 Investor presentation Source: Alphaliner Monthly Monitor, March 2020 © Hamburger Hafen und Logistik AG 35Fact book
Ship size development
Container Mega carriers of > 24 thousand TEU have become standard on the Asia-North Europe route
January 2022 Investor presentation © Hamburger Hafen und Logistik AG 36Fact book
Mega carriers led to challenging peak load conditions
Container Example for the impact of a 24 TTEU vessel on all modes of transport and the block storage system
Throughput:
24 TTEU vessel
9,500 boxes
5
50
2
3,600
January 2022 Investor presentation © Hamburger Hafen und Logistik AG 37Backup
HHLA is ready for 24,000 TEU vessels
Measures for smooth container throughput on the waterside and in the hinterland
NTK: Nautische Terminal Koordination FLZ: Feeder Logistik Zentrale
Coordination of arriving and departing Neutral platform and single point of contact
vessels in the river Elbe already starting for feeder vessel planning and terminal
in the North Sea rotation coordination
Rail handling: Project “RaMoNa”
Introduction of RAngierMOdells NOrdhafen (Shunting model Northern port)
Reduction of shunting, increase of efficiency and reduction of turnaround times in rail traffic
Truck handling: Project “Fuhre 4.0“ incl. slot booking Tightening of the system in 2021
Reduce handling and waiting times for HGVs and distribute them evenly throughout the day.
Increasing the capacity and efficiency of existing infrastructure (public transport network,
transhipment companies, technical equipment)
Terminal operation
Implementation of a new terminal operating system from Navis
Electrically operated storage blocks instead of sole use of VCs at CTB
14.12.2021 Capital Markets Day: Striving for Efficiency – Restructuring programme in the Container segment © Hamburger Hafen und Logistik AG 38Fact book
Focus on client needs: mega carrier ready
Container Investments in terminal expansion and process optimisation continued at all terminals in Hamburg
Organisation
Centralisation of planning and administration functions
Set-up container operations with partly flexible allocation of
workforce across terminals and integrated steering model
Bundling of technical services including maintenance & repair
Automation
Automation of horizontal transport and extension of storage crane
systems at CTB
Remote control / automation of railroad crane at CTA
Automation of ship-to-shore cranes at CTA
KÖHLBRANDBRÜCKE
Process optimisation and digitalisation
Standardization and digitalisation in administrative and control
functions enabled through N4
New truck and train operations to enhance handling efficiencies
AI-supported yard optimisation by forecasting dwell times and final
destinations of containers
Cost optimisation
Peak shaving to reduce energy costs
Cross-terminal asset management
BERTH FOR MEGA CARRIER Optimisation of internal and external services
January 2022 Investor presentation © Hamburger Hafen und Logistik AG 39Fact book
HHLA Container Terminal Altenwerder
Container CTA Terminal Layout 2025
Container Terminal
Altenwerder (CTA)
Asset largely
depreciated –
€ 125 m replacement
investments necessary
by 2025
Additional investments
of € 19 m by 2025
Light capacity increase
from 2.3 m TEU today
to 2.6 m TEU in 2025
14.12.2021 Capital Markets Day: Striving for efficiency © Hamburger Hafen und Logistik AG 40Fact book
HHLA Container Terminal Burchardkai
Container CTB Terminal Layout 2025
Container Terminal
Burchardkai (CTB)
Investments of
€ 385 m between
2022 and 2025
Includes investments
in third ULCV berth
Increasing the 2.9 m
TEU capacity today
to 4.1 m TEU in 2025
14.12.2021 Capital Markets Day: Striving for efficiency © Hamburger Hafen und Logistik AG 41Fact book
HHLA Container Terminal Tollerort
Container CTT Terminal Layout 2025 ff.
Container Terminal
Tollerort (CTT)
Capacity expansion
in line with volume
development depending
on COSCO – from
1.6 m TEU up to
2 m TEU in 2025
Including total
investments in the
amount of € 60 m until
2025
Further expansion for
second ULCV berth
possible
14.12.2021 Capital Markets Day: Striving for efficiency © Hamburger Hafen und Logistik AG 42Fact book
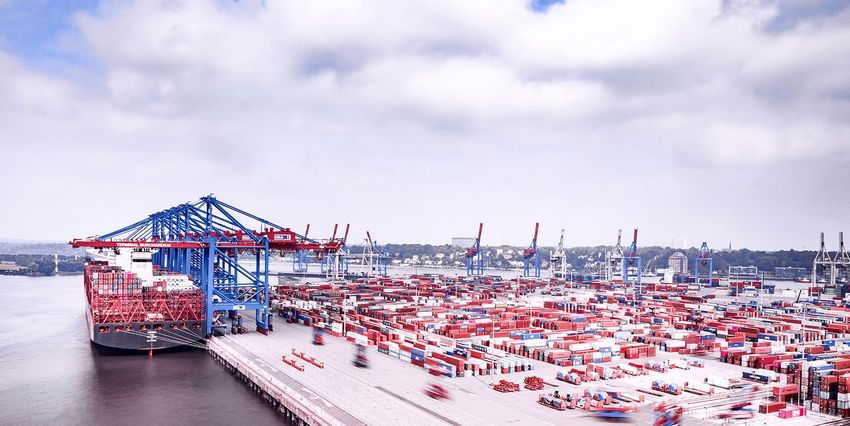
High automation level with mega-carrier berths in operation
Container Advanced terminal technology
HHLA in the Port of Hamburg
Market share of 74 % in Hamburg and
15 % in the North Range in 2020
State-of-the-art handling technology,
innovative IT systems and a high level of
automation
Three fully equipped berths for the latest
generation of ULCV’s already in operation
at the container terminals Burchardkai
(CTB) and Tollerort (CTT)
Further rollout of additional automated block
storage capacities at CTB
On-dock railway stations at all facilities able
to comply with future 740 metre block trains
Optimised traffic coordination for an
improved cargo flow and terminal access
January 2022 Investor presentation © Hamburger Hafen und Logistik AG 43Fact book
State-of-the-art container handling at CTA
Container Maximum efficiency by high degree of automation and compact layout
January 2022 Investor presentation © Hamburger Hafen und Logistik AG 44Fact book
International container terminals
Container Port Logistics subgroup with international presence
Container terminal Odessa (CTO) operated by UIC, Odessa / Ukraine
Since Current capacity Potential capacity
Largest and most modern container terminal in Ukraine
Multipurpose terminal for containers and also bulk, general and project cargo
2001 850k TEU 1.2m TEU
Stake Area Length of quay wall
100 % ~ 35 ha 970 m
Terminal Muuga operated by HHLA TK Estonia, Muuga (close to Tallinn) / Estonia
Since Current capacity Potential capacity
Market leader in Estonia
Multipurpose terminal for break bulk, bulk and RoRo handling
2018 300k TEU 800k TEU
Geographic position links the Northern European market with the New Silk Road Stake Area Length of quay wall
Location is developing into a multimodal hub as a result of regional infrastructural
projects (such as the Rail Baltica project)
100 % ~ 35 ha 950 m
Piattaforma Logistica Trieste (PLT), Trieste / Italy Since Current capacity Potential capacity
Multipurpose terminal: Northern part is already handling general cargo transports,
Northern part
southern part is newly developed to handle container and RoRo cargo 2021 Ramp up 300k TEU
Southern part
Operations and ramp-up have already started in the first quarter of 2021 Stake Area
Favourable geographic location as the most northern port in the Mediterranean
to serve CEE as southern gateway 50.01 % ~ 28 ha
January 2022 Investor presentation © Hamburger Hafen und Logistik AG 45Fact book
Nautical restrictions of Elbe waterway solved
Container Arrivals and departures of large container ships are much more stable as a result
Passing boxes
for extended time slots and more flexibility
to handle entrance and departure of mega-
carriers
Cutting the peaks in the river bed
enables a higher load factor for mega-
carriers
Frist stage approval
since May container ships can utilise about
50 % of the draught improvements;
depending on ship size draughts increase
by 0.3 m to 0.9 m
Final approval at the end of 2021
Enabling a higher load factor,
extended time slots and more
flexibility for mega carriers
January 2022 Investor presentation © Hamburger Hafen und Logistik AG 46Fact book
Key figures
Intermodal Intermodal segment
in € million 2016 2017 2018 2019 2020
Container transport in thousand TEU 1,408 1,480 1,480 1,565 1,536
Revenues 390.1 414.0 433.8 486.9 476.8
EBITDA 79.6 95.0 112.7 139.0 131.8
EBITDA margin in % 20.4 22.9 26.0 28.6 27.7
EBIT 55.9 69.9 89.1 99.2 88.3
EBIT margin in % 14.3 16.9 20.5 20.4 18.5
Segment assets 405.0 408.1 436.1 585.1 614.5
January 2022 Investor presentation © Hamburger Hafen und Logistik AG 47Fact book
EBIT multiplied several times since realignment
Intermodal Strategic decision to invest in own assets is a prerequisite to boost utilisation and efficiency
EBIT & EBIT margin Since realignment the
CAGR in million € 99 operating result (EBIT)
2007* – 2020 89 multiplied compared to
88
6.8%
prior years and
Realignment
significantly
70
outperformed volume
and revenue growth
55 56
Strategic decision to
CAGR 38 39
21% 20%
invest in own assets is
2012 – 2020 18% 29 19% a prerequisite to boost
17% 27 28 27 17%
18.7%
22 23 15% utilization and efficiency
16% 13% 14%
12%
8% 8%
7%
Outlook 2021
2007* 2008* 2009* 2010* 2011* 2012 2013 2014 2015 2016 2017 2018 2019 2020
Moderate
CAGR 12% 15% 57% increase of
2017 – 2020 Subgroup Subgroup Subgroup
transport volume
8.1%
EBIT EBIT EBIT
adjusted by changes (2020: 1.5 million TEU)
in net provision
* 2007-2011 pro forma: applying the ownership structure end of 2018
January 2022 Investor presentation © Hamburger Hafen und Logistik AG 48METRANS at a glance
We have established more than 550 regular train connections per week
General overview of the METRANS network
From / to trains per week
Terminals
17
Train connections
per week
> 550
Locomotives
128
Wagons
> 3,200
14.12.2021 Capital Markets Day: 30 years of METRANS – status quo and prospects of the intermodal business © Hamburger Hafen und Logistik AG 49METRANS at a glance
We are well connected to the new continental Silk Road
General overview of the METRANS network
Number of operated trains by METRANS
that originated in or went to China
1.250
1.009
1.000 914
750
496
500 404
250 30 92
0
2016 2017 2018 2019 2020 1-11
2021
General potential of the new Silk Road
Silk Road infrastructrue project is economically viable
(price increased from USD 5,000 to USD 15,000)
Strong westbound focus (imbalance of 70:30)
Cargo transfer mainly to Germany (Hamburg and Duisburg);
distribution across whole Europe (key role of Poland as transit country)
Weaknesses: irregular service, delays (transport, customs);
high material binding
Outlook: growth stabilisation
14.12.2021 Capital Markets Day: 30 years of METRANS – status quo and prospects of the intermodal business © Hamburger Hafen und Logistik AG 50Fact book
Focussed capex for higher value added
Intermodal Approx. € 547 million investment in own assets since 2012
17 Hub and inland terminals
in the hinterland >120 Multi-system locomotives
and shunting engines >3,200 Own designed
light-weighted wagons
Investments
in € million
130,9*
77,1 82,7 Focus of investments
46,9 52,3 55,1 in 2021 on the renewal and
44,1 45,7
expansion of own transport and
12,0 handling capacities
2012 2013 2014 2015 2016 2017 2018 2019 2020
2019: limited comparability due to first-time application of IFRS 16
January 2022 Investor presentation © Hamburger Hafen und Logistik AG 51Fact book
The HHLA on-dock rail terminals
Intermodal
9 sidings suitable for trains >700 m 10 sidings over 700 m long 5 sidings over 700 m long
4 RMGs (half-automated) 4 RMGs 3 RMGs
Upgrading completed Upgrading underway Upgrading according to needs
Biggest container
rail terminal
in Europe
January 2022 Investor presentation © Hamburger Hafen und Logistik AG 52Fact book
The hub and shuttle system
Intermodal Every port is linked with a network of hubs and inland terminals
System success derives from a transport design that involves hinterland hubs and shuttle trains plus
comprehensive monitoring of the transport and logistics chain between the seaport and the hinterland customer
January 2022 Investor presentation © Hamburger Hafen und Logistik AG 53Fact book
Value drivers: Differentiating know-how and service excellence
Intermodal Know-how and intelligent terminal layout to the customer’s profit
Innovative design of transport system
and terminal layout that is customized
on the special needs of container
transportation
Highly efficient terminal layout
(e.g. 12 trains can be handled at the
same time at the Prague terminal)
CEE terminals operate 24/7/365
High level of value added service
like repair services for containers
and on-site customs services
Offices in the ports of Hamburg,
Bremerhaven, Koper and Istanbul
Experienced management with
entrepreneurial passion and incentive
structures
Engaged and locally well connected
sales force
January 2022 Investor presentation © Hamburger Hafen und Logistik AG 54Fact book
Value drivers: Equipment
Intermodal
Own locomotives enhance
Own wagon design for Own shunting locomotives
the production quality and
customized container transportation with state-of-the-art technology
improve cost efficiency
Approx. 3,200 own container wagons Metrans owns 40 TRAXX F140 MS Next innovation driver: shunting
Own design and development of locomotives from Bombardier locomotives with hybrid technology
light-weighted wagons with modern Metrans operates 128 locomotives Depending on the assignment,
“whispering” braking system shunting locomotives can run on
Multi-system locomotives can be
Optimal distribution deployed in up to seven different battery power for between 50-70 %
‒ 92 containers fit on the standard electricity grids used all over Europe of the time it is in operation
maximum length of 610 m in CEE since it can be operated using both Reduction of fuel consumption
‒ 108 containers fit on the standard alternating and direct current by up to 50 %
maximum length of 720 m in WE
No locomotive changes at each border 50 % less CO2 than conventional
Overall weight of the container saves time and costs and ensures a shunting locomotives
flat wagon is around 4,000 kilograms high degree of reliability
resp. approx. 30 % lighter than the
conventional equipment in Europe
January 2022 Investor presentation © Hamburger Hafen und Logistik AG 55Fact book
Strong position in Central and Eastern Europe
Intermodal Markets and competitors
Germany Position of METRANS Czech Republic
Very competitive market Full coverage Strong position of METRANS,
High share of trucks Specific regions serving whole country
New markets
METRANS serves specific regions Slovakia
(Munich, Nuremberg, Leipzig, Berlin) Strong position of METRANS,
Austria serving whole country
Very competitive market Hungary
METRANS serves specific regions Strong position of METRANS,
(Salzburg, Upper Austria, Lower Austria) serving whole country
Poland New markets
Very competitive market Romania, Serbia
High share of trucks
METRANS covers whole country (focus HH, BHVN only)
Competition
14.12.2021 Capital Markets Day: 30 years of METRANS – status quo and prospects of the intermodal business © Hamburger Hafen und Logistik AG 56Fact book
Combined transport is key driver to achieve significant increase in modal sp
Intermodal
Share of intermodal and total rail freight Previous and expected combined transport and
in the overall modal split in million tkm total rail freight volume growth in billion tkm
Rail
16.9% 5.5% 76.9% 6.2% Truck
+38.8%
Combined 750
2009
transport +146.6% Rail freight
Barge 484,1
500 410,9 Combined transport
+17.8% +56.5% +9.9% -1.9% 348,8
278,4 Due to data availability
250 177,3 the rail share for 2019
112,9 is illustrated by 2018
2018
values.
18.0% 7.5% 76.5% 6.2% 0
2009 2019 2029e
Source: UIRR / UIC presentation Source: UIRR / UIC presentation
Estimated change in modal split from 2018 till 2030 Rail
Economic importance of European combined transport
in % Truck Market volume of more than € 6 billion
18% 75% 7% Barge Important contribution to EU climate change target
2018 Reduced CO2 emissions: 5 million tonnes p.a.
2030 ~ +10%
Freight growth driver: + 50 % more tonnes within 10 years
30% 63% 7% High investments in new technologies and digitalisation
Estimated freight
volume growth by 2030
Source: Rail freight forward, European Rail Freight Vision 2030 Source: UIRR / UIC presentation
14.12.2021 Capital Markets Day: 30 years of METRANS – status quo and prospects of the intermodal business © Hamburger Hafen und Logistik AG 57Fact book
With HHLA Pure, we offer our clients CO2-neutral handling and transport
Intermodal Certified CO2-neutrality for transportation from the port in Hamburg all the way to Europe’s hinterland
Climate-neutral logistics chain
Customers
Product design Process Course of action
Handling at the container terminals in Certification of HHLA Pure by TÜV Nord Modern hybrid and electric locomotives
Hamburg, esp. at Container Terminal
Receiving customer-specific transport Electrification at the port container
Altenwerder, with widely electrified processes
(volume / route) terminal with electric storage crane system,
Transport and collection via METRANS with electric vehicles
Offsetting and monitoring by TÜV Nord
CO2-optimised trains and wagons
Any currently unavoidable CO2 emissions are
offset through certified development projects
with the highest international standard (Gold)
Confirmation of climate-neutral transports for
customers
14.12.2021 Capital Markets Day: 30 years of METRANS – status quo and prospects of the intermodal business © Hamburger Hafen und Logistik AG 58Fact book
Network and equipment enable massive savings in CO2 emissions
Intermodal
CO2 emissions on selected routes in the METRANS network CO2 emissions on the Hamburg-Budapest
KG CO2 per TEU KG CO2 per TEU
Hamburg < > Poznan Truck
Hamburg < > Budapest METRANS rail
Rail
Hamburg < > Dunajska Streda
0 100 200 300 400 500 600 700 800 900
Hamburg < > Prag
Truck
Hamburg < > Ceska Trebova
METRANS rail
Rail
Hamburg
- 88 %
METRANS savings
Hamburg < > Gernsheim compared to truck*
Hamburg < > Berlin KöWu
Budapest - 58 %
0 100 200 300 400 500 600 700 800 900 METRANS savings
compared to rail*
Truck and rail data based on EcoTransit calculator, an emission calculator for
* Budapest < > Hamburg
greenhouse gases and emissions. Data provided by METRANS is TÜV-certified.
14.12.2021 Capital Markets Day: 30 years of METRANS – status quo and prospects of the intermodal business © Hamburger Hafen und Logistik AG 59Fact book
Key figures
Logistics Logistics segment
in € million 2016 2017 2018 2019 2020
Revenues 55.0 50.8 59.8 59.0 51.4
EBITDA 2.4 6.9 10.0 8.5 6.9
EBITDA margin in % 4.3 13.7 16.7 14.3 13.4
EBIT - 1.7 2.6 5.6 2.5 - 3.9
EBIT margin in % - 3.1 5.0 9.4 4.3 - 7.5
At-equity earnings 3.7 3.9 4.4 3.0 3.4
Segment assets 62.0 40.9 42.0 55.8 51.7
January 2022 Investor presentation © Hamburger Hafen und Logistik AG 60Fact book
Overview of the Logistics segment activities
Logistics HHLA continues a tradition leading the way in port innovations
Specialist handling Consulting services Logistic services
RoRo Consulting Additive manufacturing
UNIKAI Lagerei- und Speditions- HPC Hamburg Port Consulting GmbH, Bionic Production GmbH, Lüneburg
gesellschaft mbH, Hamburg Hamburg
ARS-UNIKAI GmbH, Hamburg at equity
Bulk Automation technology Hyperloop transport system
Hansaport Hafenbetriebsgesellschaft iSAM AG, Mülheim an der Ruhr Hyperport Cargo Solutions GmbH i.G.,
mit beschränkter Haftung, Hamburg at equity
Hamburg at equity
Fruits Digital solutions
HHLA Frucht- und Kühl-Zentrum modility GmbH, Hamburg
GmbH, Hamburg at equity
Ulrich Stein Gesellschaft mit
beschränkter Haftung, Hamburg at equity
Airborne solutions
HHLA Sky GmbH, Hamburg
Spherie UG(haftungsbeschränkt),
Hamburg at equity
Third Element Aviation GmbH,
Bielefeld at equity
January 2022 Investor presentation © Hamburger Hafen und Logistik AG 61Fact book
Examples for new business fields
Logistics HHLA continues a tradition leading the way in port innovations
Digital solutions Additive manufacturing Airborne solutions
modility Bionic Production HHLA Sky
Corporate spin-off founded in 2020 Founded in 2015 Founded in 2018
HHLA initiated the new booking portal with Independent provider of consultancy Business concept: in-house developed
several partners from the transport and services for additive manufacturing industrial drones with a globally first
freight-forwarding sector scalable end-to-end drone system that
Business concept: introduce 3D printing
Business concept: Booking and brokerage enables drones to be operated safely
processes into industrial series production
portal to connect intermodal operators’ beyond the visual line of sight (BVLOS)
and employ bionic designs to suitable
available transport capacities with the components and development of Benefits: Variety of assignments from
transport needs of freight forwarders; focus hardware and software components for civil and industrial safety at airports and
on combined road/rail transport in Europe 3D printing equipment industrial sites, to environmental
Benefits: opportunity to gain easy access monitoring and surveying grounds and
Benefits: optimised components in line
to intermodal transport offers while fostering buildings to collect specific data on behalf
with bionic principles allow a production
new customer relationships; additionally, of customers or transmit real-time images
using minimal materials and energy
Intermodal transport will thus be further using extremely powerful cameras
bolstered as an efficient, environmentally
friendly transport system
January 2022 Investor presentation © Hamburger Hafen und Logistik AG 62You can also read