Investor Presentation - Nexstar Media Group, Inc. January 2023 Perry A. Sook, Founder, Chairman & CEO Tom Carter, President & COO Lee Ann Gliha ...

Page created by Kevin Robinson
 
CONTINUE READING
Investor Presentation - Nexstar Media Group, Inc. January 2023 Perry A. Sook, Founder, Chairman & CEO Tom Carter, President & COO Lee Ann Gliha ...
Nexstar Media Group, Inc.

Investor
Presentation
January 2023

Perry A. Sook, Founder, Chairman & CEO
Tom Carter, President & COO
Lee Ann Gliha, EVP & CFO
Investor Presentation - Nexstar Media Group, Inc. January 2023 Perry A. Sook, Founder, Chairman & CEO Tom Carter, President & COO Lee Ann Gliha ...
Disclaimer
Forward-Looking Statements
This presentation includes forward-looking statements. We have based these forward-looking statements on our current expectations and projections about future events. Forward-
looking statements include information preceded by, followed by, or that includes the words "guidance," "believes," "expects," "anticipates," "could," or similar expressions. For these
statements, Nexstar claims the protection of the safe harbor for forward-looking statements contained in the Private Securities Litigation Reform Act of 1995. The forward-looking
statements contained in this presentation, concerning, among other things, future financial performance, including changes in net revenue, cash flow and operating expenses, involve
risks and uncertainties, and are subject to change based on various important factors, including the impact of changes in national and regional economies, the ability to service and
refinance our outstanding debt, successful integration of acquired television stations and digital businesses (including achievement of synergies and cost reductions), pricing fluctuations
in local and national advertising, future regulatory actions and conditions in the television stations' operating areas, competition from others in the broadcast television markets, volatility
in programming costs, the effects of governmental regulation of broadcasting, industry consolidation, technological developments and major world news events. Nexstar undertakes no
obligation to update or revise any forward-looking statements, whether as a result of new information, future events or otherwise. In light of these risks, uncertainties and assumptions, the
forward-looking events discussed in this presentation might not occur. You should not place undue reliance on these forward-looking statements, which speak only as of the date of this
presentation. For more details on factors that could affect these expectations, please see Nexstar’s other filings with the Securities and Exchange Commission.

Definitions and Disclosures Regarding non-GAAP Financial Information
Adjusted EBITDA is calculated as net income, plus interest expense (net), loss on extinguishment of debt, income tax expense (benefit), depreciation, amortization of intangible assets and
broadcast rights, (gain) loss on asset disposal, impairment charges, (income) loss from equity method investments, distributions from equity method investments and other expense
(income), minus reimbursement from the FCC related to station repack and broadcast rights payments. We consider Adjusted EBITDA to be an indicator of our assets’ operating
performance and a measure of our ability to service debt. It is also used by management to identify the cash available for strategic acquisitions and investments, maintain capital assets
and fund ongoing operations and working capital needs. We also believe that Adjusted EBITDA is useful to investors and lenders as a measure of valuation and ability to service debt.

Free cash flow is calculated as net income, plus interest expense (net), loss on extinguishment of debt, income tax expense (benefit), depreciation, amortization of intangible assets and
broadcast rights, (gain) loss on asset disposal, stock-based compensation expense, impairment charges, (income) loss from equity method investments, distributions from equity
method investments and other expense (income), minus payments for broadcast rights, cash interest expense, capital expenditures, proceeds from disposals of property and equipment,
and operating cash income tax payments. We consider Free Cash Flow to be an indicator of our assets’ operating performance. In addition, this measure is useful to investors because it is
frequently used by industry analysts, investors and lenders as a measure of valuation for broadcast companies, although their definitions of Free Cash Flow may differ from our definition.

For a reconciliation of these non-GAAP financial measurements to the GAAP financial results cited in this presentation, please see the supplemental tables at the end of Nexstar’s fourth
quarter and full year 2021 financial results press release dated February 22, 2022 and Nexstar’s third quarter financial results press release dated November 8, 2022.

With respect to our forward-looking guidance, no reconciliation between a non-GAAP measure to the closest corresponding GAAP measure is included in this release because we are
unable to quantify certain amounts that would be required to be included in the GAAP measure without unreasonable efforts. We believe such reconciliations would imply a degree of
precision that would be confusing or misleading to investors. In particular, a reconciliation of forward-looking Free Cash Flow to the closest corresponding GAAP measure is not available
without unreasonable efforts on a forward-looking basis due to the high variability, complexity and low visibility with respect to the charges excluded from these non-GAAP measures. For
example, the definition of Free Cash Flow excludes stock-based compensation expenses specific to equity compensation awards that are directly impacted by unpredictable fluctuations
in our stock price. In addition, the definition of Free Cash Flow excludes the impact of non-recurring or unusual items such as impairment charges, transaction-related costs and gains or
losses on sales of assets which are unpredictable. We expect the variability of these items to have a significant, and potentially unpredictable, impact on our future GAAP financial results.

                                                                                                                                                                                                   2
Investor Presentation - Nexstar Media Group, Inc. January 2023 Perry A. Sook, Founder, Chairman & CEO Tom Carter, President & COO Lee Ann Gliha ...
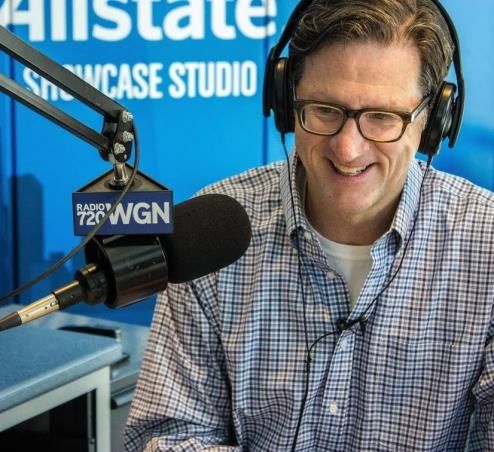
Nexstar Media Group, Inc. Overview
                                                                                      National Reach                                                      9/30/22 LTM Revenue Composition
                                                                                      Key National Properties:
                                                                                      The CW, NewsNation, The Hill
                                                                                                                                                                        Digital / Other        8%
                                                                                      % of U.S. Covered:                                          100%                  Growing

                                                                                      Local Reach At Scale                                                              Political Advertising 5%
                                                                                                                                                                        Growing – 11% of Revenue in
                                                                                      % of U.S. TV Households:                                     68%                  2020 Election Year
                                                                                      Monthly Unique Visitors:                                  90MM+                   Core Advertising      35%
                                                                                                                                                                        Consistent
                                                                                      Financial Profile                                       9/30/22
                                                                                                                                                                        Distribution          52%
                                                                                      LTM Revenue:                                            $4,970MM                  Recurring and Growing
         200         One of America’s major   Fastest growing
  owned or partner    broadcast networks    national cable news                       LTM Adj. EBITDA:                                        $2,114MM
 broadcast stations     (75% ownership)          network in
 in 116 U.S. markets                                                                  % Margin:                                                    43%
                                               70MM+ homes                                                                                                   9/30/22 LTM FCF Allocation
                                                                                      LTM Free Cash Flow:                                     $1,400MM
                                                                                      % of Adj. EBITDA:                                            66%
                                                                                                                                                                         Dividends              10%
                                                                                      Capital Structure
                    Multicast TV networks                            31%              Net Debt / EBITDA(1):                                        3.2x
                  reaching almost 95% and                       ownership stake                                                                                          Share Repurchases 54%
                 50% of US TVHH, respectively                                         Corporate Credit Rating:                                 Ba3 / BB
                                                                                                                                                                         Debt Repayment        27%
                                                                                      9/30/22 LTM Return of Capital
                                                                                      Dividend:                                 $3.63 / share (2)
                                                                                                                                                                         Other                  9%
Top 10 digital news                            Multi-platform     Consumer products   Share Repurch.:                          $20.02 / share(2)
  & information                                political news     recommendations
     property                                                                         Total:                                   $23.65 / share(2)
                                                                                      (1)   Based on credit agreement definition.
                                                                                      (2)   Based on shares outstanding as of Q3 2022 10-Q.                                                      3
Sources: Comscore, Nielsen, Company filings.
Investor Presentation - Nexstar Media Group, Inc. January 2023 Perry A. Sook, Founder, Chairman & CEO Tom Carter, President & COO Lee Ann Gliha ...
Year In Review                                            Track Record of Stock Price Performance
•         One of the best performing stocks in all of    5 Year Nexstar Stock Price History
          media over the last twelve months
                                                         $250.00      NXST Stock Price Performance:
•         Returned $892MM, 64% of free cash flow,                     5 Years:               +158%
          to shareholders during the LTM period ended                 Cum. Dividends Paid:   $11.94
          9/30/22                                        $200.00

•         Increased 2023 dividend by 50% to $5.40 per
          share p.a., a 2.6% dividend yield
                                                         $150.00
•         Diversified revenue model insulates revenue
          and cash flows from recessionary pressures
           − 50%+ of revenue from contractual            $100.00
              distribution sources
           − ~70% of YTD core advertising revenue from
              resilient local advertising market          $50.00

           − Exposure to record-breaking political
              television advertising spending
                                                           $0.00
•         Low leverage of 3.2x
•         Undervalued trading to a mid-teens FCF yield
                                                                                                      4
    Stock price as of 1/27/23.
Investor Presentation - Nexstar Media Group, Inc. January 2023 Perry A. Sook, Founder, Chairman & CEO Tom Carter, President & COO Lee Ann Gliha ...
Unprecedented Combination of Powerful National Brands/Reach
      with the Largest Local Station Group Engaging Local Audiences
      and Businesses at Scale
                                                                              Inimitable asset portfolio gives Nexstar the unique ability to
                                                                                    offer both nationwide reach and local activation.
                                     Powerful National Brands                                                                                                          National Reach
                                                                                                          Nexstar reaches the entire U.S. population via its national TV networks
                                                                                                            Broadcast Networks TVHH                                                         Cable News Networks TVHH

                                                                                                              123.8              123.8         123.8           123.8            123.8
                                                                                                                                                                                                  70.2             66.1           73.9            75.1

                                                                                                                                 ABC           CBS             NBC              FOX                          MSNBC              Fox News          CNN

                                     Scaled Local Engagement                                                                                                Largest Local Presence
                                                                                                          Nexstar reaches 68% of the U.S. population via its local TV stations
                                                                                                           % of TVHH (No UHF Discount)

                                                                                                            80%
                                                                                                                      68%
                                                                                                            70%                                                     Nexstar’s local footprint is ~75%+ larger
                                      • 116 local markets                                                   60%                                                    than the other broadcast network owners
                                      • 5,500 local journalists                                             50%                    45%
                                                                                                                                              39%       39%        39%         38%      37%
                                      • 300,000 hours of local content                                      40%                                                                                   36%
                                                                                                                                                                                                          29%
                                      • 1,500 local salespeople                                             30%                                                                                                       25%        24%       22%     22%
                                      • 40,000 local advertiser relationships                               20%
                                                                                                            10%
                                                                                                             0%
                                                                                                                       Nexstar    Univision   TEGNA    Fox Corp.   Sinclair   Paramount Comcast    Gray   Weigel      Scripps   WRNN-TV    INYO    The Walt
                                                                                                                      (The CW)                           (FOX)                  Global   (NBC)                         (Local                     Disney Co.
                                                                                                                                                                                (CBS)                                  Only)                        (ABC)
                                                                                                                                                                                                                                                               5
Sources: SNL Kagan, SEC filings, Investor Presentations, Comscore, Nielsen.
Investor Presentation - Nexstar Media Group, Inc. January 2023 Perry A. Sook, Founder, Chairman & CEO Tom Carter, President & COO Lee Ann Gliha ...
is a Top 10 News & Information Property and Top 40 Overall
      Nexstar Digital reaches almost 35% of the U.S. digital audience, complementing its TV reach.

•   Nexstar Digital offers local and national advertisers a full suite of products                          Top 10 Digital
    and services including display, programmatic, mobile, social, e-commerce,                        News & Information Property
    OTT/CTV advertising                                                                        Sept. 2022 Unique Visitors per Comscore
                                                                                               (in ‘000s)
                                                                        Nexstar Properties

                                                                     240 mobile applications   1.      Yahoo-BuzzFeed News           175,952

                                                                                               2.      Microsoft News                    160,192
                                                                     126 websites
                                                                                               3.      The Weather Co.               155,083
                                                                     781 social media pages
                                                                                               4.      CNN Network                   146,834
                                                                     200 broadcast stations
                                                                                               5.      NBC News                          145,513
                                                                     6 OTT properties on
                                                                                               6.      USA TODAY                     132,236
                                                                     all major platforms

          Stellar is Nexstar’s proprietary outcome-driven omni-channel ad campaign platform    7.      Fox News Media                    101,166

                                                                                               8.      NEXSTAR DIGITAL                   90,572
                                Nexstar OTT Properties
                                                                                               9.      New York Times                    90,542

                                                                                               10.     CBS News                          82,755

                                                                                                                                                   6
Investor Presentation - Nexstar Media Group, Inc. January 2023 Perry A. Sook, Founder, Chairman & CEO Tom Carter, President & COO Lee Ann Gliha ...
The Reinvention of Broadcasting: What’s Old is New Again
                     Nexstar generates more free cash flow than its larger media peers.

•   Increasing investor focus on free cash flow generation as    10/18/22: Netflix Follows Broadcast-Centric Business Models After
                                                                 Years of Innovation (Source: Online Video News)
    the primary method to create shareholder value which
    favors broadcasting business models

•   Streaming players are eliminating their differentiated       7/27/22: For the 22/23 Upfront, “Media Dynamics says…that the five
    consumer offering by adopting superior broadcast             broadcast TV networks took in $9.9 billion in primetime sales,
                                                                 up…6.4%”
    television business model and going ad-supported in the
    national market                                              Nielsen: NFL audiences choose local broadcast over Amazon Prime
                                                                 % of In-Market Viewership of TNF through Week 17 (December 29, 2022)
•   Advertisers continue to seek out broadcasters as the only
    place to find audiences at scale                                              Amazon
                                                                                 Prime, 33%

•   Broadcast television is the most important medium for
    engaging live sports audiences
     −   Audiences prefer broadcast delivery                                                                   Local Broadcast,
                                                                                                                      67%
     −   Streaming has challenges for sports: fragmented         3/28/21: NFL announces new broadcast deals running through
         audiences, consumer cost, technological issues          2033…preserving its custom of keeping all NFL contests on over-
                                                                 the-air television. (Source: NFL)
     −   Latest NFL media contract requires the NFL to be on
         broadcast through 2033
     −   Team owners looking to maximize their local
                                                                  9/20/22: KTLA 5 Will Exclusively Air 15 Clippers Games This Season
         audience, fans and franchise values, are returning to    and Produce Pre-game, Halftime, and Post-Game Programming
         broadcast television (e.g. Clippers on KTLA)             (Source: Nexstar)

     −   Adam Silver recently quoted saying that broadcasters
         may be an option for underserved NBA content                                                                                   7
Investor Presentation - Nexstar Media Group, Inc. January 2023 Perry A. Sook, Founder, Chairman & CEO Tom Carter, President & COO Lee Ann Gliha ...
Nexstar Content is Valuable
                Nexstar produced and programmed content drives its ratings and revenues.

         Valuable Network                          Nexstar Produces 300,000 Hours of Local Content Each Year
           Relationships
                                                        Nexstar Local Station                                  Nexstar Local Station
                                                        Content Viewership                                     Advertising Revenue
                                              •     Nexstar’s local news and other                     •   Nexstar’s local news and other local
                                                    produced/acquired content is                           and syndicated content accounts for
                                                    responsible for more than half of the                  approximately 70% of stations’ core
 •   #1, #2 or #3 affiliate for every major         viewership of its local stations.                      advertising revenue.
     broadcast network
                                              •     Local advertisers value the local
 •   Airing sports, news, lifestyle and
                                                    audiences Nexstar delivers.
     entertainment content
                                                  Four Book Average (July – Oct 2022) Nexstar              2021 Nexstar Station Advertising Revenue
         Owned Broadcast                          Station Viewership by Content Type                       by Content Type
            Networks                              Source: Nielsen

                                                                                                              Network
                                                        Network
                                                                                                              Content,                         Nexstar
                                                        Content,
                                                                                                                30%                            Content
                                                          34%
                                                                                                                                              (Local and
                                                                                                                                             Syndicated),
 •   Owns The CW, America’s 5th major                                                                                                            70%
     broadcast network                                                                    Nexstar
                                                                                          Content
 •   Owns and created Antenna TV (ranks
                                                                                         (Local and
     in top half of cable networks in terms
                                                                                        Syndicated),
     of viewership) and Rewind TV
                                                                                           66%
                                                                                                                                                            8
Investor Presentation - Nexstar Media Group, Inc. January 2023 Perry A. Sook, Founder, Chairman & CEO Tom Carter, President & COO Lee Ann Gliha ...
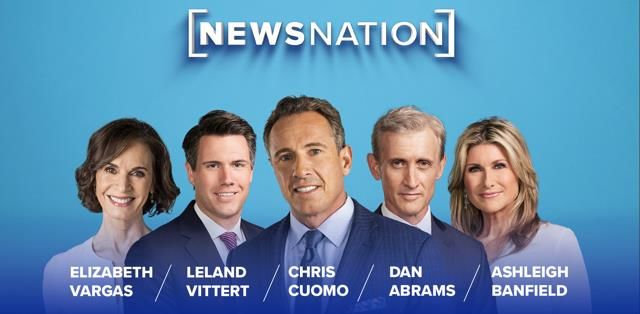
Record-Setting Revenue Trends
           Ten* of the last eleven quarters set all-time quarterly high levels of net revenue for Nexstar.

                                                                                                                                                    LTM 9/30 Net Revenue
 ✓ Continued execution on local and national                                                                            ($ in millions)
   television advertising sales with incentive
   plans geared to new business development in
   local markets                                                                                                                                                                                          $4,970
                                                                                                                                                                      $4,779

 ✓ Extensive footprint and focus on large political                                                                              $4,225
   advertising opportunity in even years

 ✓ Growth in internally-developed network
   businesses like NewsNation, Antenna TV and
   Rewind TV

 ✓ Ability to grow distribution rates in excess of
   MVPD subscriber attrition

 ✓ Focus on high growth digital revenue through
   organic execution and M&A

                                                                                                                            Q3 LTM 2020                          Q3 LTM 2021                         Q3 LTM 2022

 *The one quarter which did not set a record high was Q4 2021, not an election year quarter, in comparison to Q4 2020, a presidential election quarter; Reflects all quarters since the Tribune Media acquisition.
                                                                                                                                                                                                                     9
Investor Presentation - Nexstar Media Group, Inc. January 2023 Perry A. Sook, Founder, Chairman & CEO Tom Carter, President & COO Lee Ann Gliha ...
Diversified Revenue Composition
                         Nexstar’s revenue is contractual, diverse and predominantly local.

    LTM 9/30/22 Net Revenue Composition – By Type                  YTD 9/30/22 Core TV Ad. Rev. Composition – By Category
              Over 50% of LTM Revenue is from                      Approximately 2/3 is from categories which represent less
               contractual, distribution fees.                       than 5% of total, resulting in diverse revenue sources.

                                                                                                  Auto, 14%
                      Political Other
            Digital     5%       1%                                                                      Attorneys, 8%
              7%
                                                                                                              Medical/Healthcare, 6%
                                                 Core Television
                                                  Advertising                  Other, 66%                 Home Repair/Manuf., 6%
                                                      35%

                                                                      YTD 9/30/22 Core TV Ad. Rev. Composition – By Type
                                                                    ~70% of YTD Core Television Advertising Revenue is from
                                                                            more stable local advertising revenues.

                                                                          National, 31%

   Distribution
      52%

                                                                                                                Local, 69%
                                                                                                                                       10
“Local Moat” Protects and Drives Revenues
                ~70% of Nexstar’s core television advertising and the substantial majority of
                   political television advertising revenue is from resilient local sources.

          Local Assets                                                             Why is this important?

•   200 local broadcast                                                        •   Local advertising (generally
    stations each with a unique                              Engaging              more “call-to-action”) is
                                        200 Local
    local brand                        Broadcast             Live, Local           typically more resilient in a
                                      Stations and           News and              challenging economic
•   120 local websites                  120 Local              Sports              environment than national
                                        Websites              Content              advertising (generally more
•   Premium live sports, news
    and other entertaining and                                                     “brand” focused)
    engaging content                                                           •   Substantial majority of
•   #1 or #2 local news                                                            $4BN+ political television
    television viewership in 76%                                                   advertising market is spent
                                                               1,500+              locally
    of our markets                    Live, Local           Person Local
                                      Audiences              Salesforce        •   Ability to deliver local
•   Dedicated 1,500-person             at Scale             with 40,000+
    local sales force with long-                                                   audiences at scale with
                                                             Accounts
    term, established                                                              engaging live news and
    relationships with over                                                        sports content
    40,000+ local businesses                                                   •   You can’t sell local without
    and advertisers                                                                a local sales force

                                                                                                                   11
National Advertising is a Growth Opportunity
       The national television advertising market is twice the size of the local advertising market.

                  The Opportunity                          2022E U.S. Television Advertising Market Size

 •   Growing Nexstar national assets of
     NewsNation (the fastest growing cable news
     network), The CW and multicast networks of
     Antenna TV and Rewind TV
                                                                                             $46BN
                                                                                       National Television
                                                                                       Advertising Market

 •   Opportunities for local activation at national
     scale of local properties
                                                                                             $23BN
                                                                                        Local Television
                                                                                       Advertising Market

                                                          Source: Magna Global, June 2022
                                                                                                             12
Multiple Organic Opportunities for Outsized Long-Term Value Creation

                                                                                              ATSC 3.0
                                                                                         (NEXTGEN TV)

                                                  ABC, CBS, NBC and Fox are          High speed data transmission
       Fox News and CNN are expected
                                         2         expected to generate, on     3    applications could generate up
 1     to generate $2.9BN and $1.7BN ,
                                                 average, $5BN of revenue and         to $15BN of industry revenue.
        respectively of 2022 revenue.
                                                   $800MM of profit in 2022.
     Source: SNL Kagan.                      Source: SNL Kagan.                 Source: BIA Kelsey.
                                                                                                                  13
1                                                   America’s Fastest-Growing Cable News Network
       Leveraging our core competency in news, we are building a profitable and differentiated national news network.

• News networks are the most watched cable networks                                                                  First Class Programming
   ‒ Top 3 cable networks in 2022: #1 Fox News, #2 ESPN,
     #3 MSNBC (Source: Nielsen)

• NewsNation has comparable distribution to other cable
  news networks of Fox News, MSNBC and CNN and fills a hole
  in the cable news market for unbiased news

• NewsNation has been profitable from its launch

• Recent high-profile hires are accelerating ratings growth

• Expectation to transition to 24/5 news in 2023 and 24/7                                                            Multi-Platform Strategy
  news by 2024
                                                                                                                                                          NewsNation App

       NewsNation Serves the Independent Majority
                                                                                          Recognized by Watchdog Groups for Independent Content
Percentage of generation identifying as independent (Gallup Poll, August 2022)

 60%                                                       52%            52%
 50%                                       44%
 40%                        33%
 30%         26%
                                                                                      Rated NewsNation TV as              Gave NewsNation a           Rated NewsNation’s
 20%
                                                                                      “Most Reliable for News”             “Trust Score” of 100,       online property as
 10%                                                                                 with its political bias rated      the highest rating of any   “Center” for media bias
  0%                                                                                  as “Middle or Balanced”             cable news network                (9/2022)
           Silent      Baby Boomers    Generation X      Millenials   Generation Z             (1/2023)                          (1/2023)
         Generation                                                                                                                                                           14
2                           One of America’s Major Broadcast Networks
                 In September 2022, Nexstar acquired a 75% interest in The CW Network for no consideration.
                      Nexstar is the #1 CW affiliate* covering 32% of TVHH, including 5 of the top 10 DMAs.

                                                                                            The Nexstar - CW Opportunity
                                                                 ✓   Solidifies and Creates Better Revenue Opportunities for
                                                                     Nexstar CW Stations and Other CW Affiliates
                                                                         −     Protects existing television advertising and distribution
          The CW Network provides 14 hours of primetime                        revenue generated by Nexstar’s
         programming per week and 3 hours on Saturdays                         37 CW-affiliated stations
                                                                         −     Improved CW ratings will create opportunities to increase
                                                                               local advertising revenue
                                                                         −     Recently signed LIV Golf to an exclusive broadcast deal
                                                                 ✓   Positions Nexstar to Respond to Future Changes in the
    The CW Plus provides        CW Digital offers its network
                                                                     Network/Affiliate Ecosystem
    24/7 programming for       content and a library of third-
       smaller market           party content on cwtv.com                −     Owning our own network/content will provide Nexstar with
           affiliates           and all major OTT platforms                    additional leverage in future negotiations with producers,
                                with over 90MM downloads                       networks, MVPDs and vMVPDs
                                                                 ✓   Increases Nexstar’s Exposure to the Lucrative National
                       Path to Profitability
                                                                     Advertising Market
• Improve and diversify programming to align with audiences      ✓   Establishes Nexstar as a Player in AVOD
• Accelerate digital growth                                              −     The CW App is available on all major platforms with over
• Reduce costs and focus on execution                                          90 million downloads
• Achieve profitability by 2025                                  ✓   Value Creation Opportunity from Improving Profitability of the
     −   Interim losses primarily funded by recent real estate       Network
         asset sale net proceeds                                     *Including partner stations.                                           15
3 ATSC 3.0 (NEXTGEN TV) Opportunity
Nexstar is upgrading its spectrum to allow it to monetize it via B2B data transmission services and other opportunities.

   • Nexstar is nearing full utilization of its existing spectrum capacity                           Nexstar Leads the Way in ATSC 3.0 Deployment
     and conversion to NEXTGEN TV (e.g. ATSC 3.0) will increase revenue
     growth opportunities                                                        TV Households                                                                # of Markets

                                                                                   45,000,000                                                                       40

   • Nexstar expects to convert its stations to ATSC 3.0 reaching 50% of           40,000,000                                                                       35
                                                                                   35,000,000
     the population with consumer adoption of new standard TV sets to                                                                                               30
                                                                                   30,000,000
     follow                                                                        25,000,000
                                                                                                                                                                    25

                                                                                                                                                                    20
                                                                                   20,000,000
   • A BIA Advisory Services study estimated that broadcaster                      15,000,000
                                                                                                                                                                    15

     expansion into high-speed broadband data transmission                         10,000,000                                                                       10

     markets could generate up to $15.0 billion of revenue for the                  5,000,000                                                                       5

                                                                                              -                                                                     -
     industry by 2030 comparable to current industry retransmission
     revenues of $13.0 billion

                                                                                                          High-Speed Data Transmission Revenue
                       NEXTGEN TV Revenue Opportunities
                                                                                                         Could Rival Retransmission Revenue Levels

    Medium-Term TV Applications:        Long-Term B2B Data Applications:           NEXTGEN TV Revenue Projection
                                                                                   ($ in billions)

    •   Additional multicast channels   •   Agriculture                             $15.0
                                        •   Connected car                                            2020 Industry Retransmission Revenue: $13.0 BN
    •   Interactive television,                                                                                                                       $15.0
        including:                      •   Digital signage
                                                                                    $10.0
                                        •   Education and distance learning                                                                           $10.7
        − Targeted advertising
                                        •   GPS
        − Sports betting
                                        •   IoT                                      $5.0
    •   Signal encryption               •   Public safety for emergency alerts                                                    $5.0
                                                                                                                                                      $6.4

    •   Other                               and other features                                                    $1.7
                                                                                     $0.0
                                        •   Telecom for hybrid NextGen TV/5G
                                                                                                                  2025           2027                 2030
                                            network applications
                                        •   Telemedicine                                                                 Low   Middle    High
                                                                                      Source: BIA and SNL Kagan                                                              16
Long Term Industry Projections Imply Long Term Revenue Growth
                                                           Projected Local Broadcast Industry Advertising Revenue Growth
 ($ in millions)

  $30,000                                                                                                                                                                                             $26,754                                                                                              $26,851
                                                                                                   $25,951                                           $26,238                                                                                            $26,613
  $25,000                                        $21,453                                                                    $23,309                                           $23,770                                           $23,772                                          $23,958
                                                                          $22,508
                         $20,557
  $20,000
   $15,000
   $10,000
    $5,000
          $0
                           2021                     2022                     2023                    2024                     2025                     2026                     2027                     2028                     2029                     2030                     2031                     2032

                                                                                                                Core station revenues                       Digital/online                Political revenues

                                                                                       Illustrative Distribution Revenue Projection Scenarios
 MVPD/vMVPD Subscribers                                                                                                                                                                                            Historical and Illustrative Projected Nexstar Distribution Revenue
 (in millions)                                                                                                                                                                                                                                                           ($ in millions)

                                66% of TVHH and 73% of adults ages 45+ (representing over 50% of the adult population) have a Pay TV service.
 100.0                                                                                                                                                                                                                                                                                                             $5,000
                                                                                                                                                                                                                                                                                                     $4,359
                              9.2
  80.0                                                            12.7                                                                                                                                                                                                                                             $4,000
                                                                                                      14.9                                                                                                                                                                                            $3,677
                                                                                                                                          16.7
  60.0                                                                                                                                                                        17.9                                                                                                                    $3,078 $3,000
                                                                                                                                                                                                                  18.4                                 18.8                                19.2
                                                                                                                $2,473                              $2,572                                                                                                                                            $2,555 $2,000
  40.0                       80.0                                           $2,153
                                                                 72.9                                66.6
                                        $1,369                                                                                           59.8                                 54.0                                49.6                                46.2                                 43.3
   20.0                                                                                                                                                                                                                                                                                                            $1,000

      -                                                                                                                                                                                                                                                                                                            $0
                            2019                                2020                 2021                                       2022                                       2023                                 2024                                2025                                2026
                            MVPD Subscribers                       vMVPD Subscribers                            Nexstar Distribution Revenue                             20% Rate CAGR                        15% Rate CAGR                       10% Rate CAGR                       5% Rate CAGR
                            (-8% ‘22-’26 CAGR)                      (+4% ‘22-’26 CAGR)                         (14% Revenue CAGR Q419 – Q322)                            (14% Revenue CAGR)                  (9% Revenue CAGR)                   (5% Revenue CAGR)                   (0% Revenue CAGR)
                                       (Combined: -5% ‘22-’26 CAGR)
 Note: Nexstar Distribution Revenue for 2022 reflects the LTM 9/30/22 period.; Illustrative revenue projection scenarios are based on 68% penetration of MVPD/vMVPD subscribers based on Nexstar TVHH coverage by its television stations. Nexstar closed on its acquisition of Tribune Media in Q3 2019.
 Sources: Advertising and subscriber projections from SNL Kagan (6/22); Leichtman Research 10/22 and US census. These projections are presented for illustrative purposes and are based on a number of estimates and assumptions which are inherently subject to uncertainties and contingencies. These projections are not
 presented to represent actual expectations of what distribution revenue growth Nexstar may achieve but rather as a tool to assess what impact subscriber attrition may have on revenue based on a variety of growth rate assumptions for distribution fees per subscriber. There are many other factors such as timing and
 impact of contract renegotiations, the composition of MVPD and vMVPD subscribers which have different revenue characteristics, the impact of other distribution revenue generated from other sources, among others, which could materially impact timing and outcome of actual revenues. In addition, the Company’s
 ability to generate growth in future distribution revenues is subject to significant risks and will depend upon future events, many of which are not within the Company's control. Under no circumstances should such illustrative projections be construed as a representation or prediction that the Company will achieve any   17
 particular results.
Free Cash Flow and Capital Allocation
     Nexstar returned $892 million, or 64% of FCF to shareholders in the LTM period ended 9/30/22
                    and increased its 2023 dividend by 50% to $5.40 per share p.a.

                FCF and Shareholder Returns                                           Capital Allocation Priorities
 Adjusted Free Cash Flow                       % of Adjusted Free Cash Flow
 ($ in millions)                                  Returned to Shareholders
                                                                              •   Value enhancing operational initiatives
                                                       $1,400
 $1,400                                                              100%
                           $1,280                                             •   Accretive M&A
                                        $1,243
                                                                              •   Modest deleveraging
                                                                     80%      •   Shareholder returns: dividends and share
 $1,050
                                                                                  repurchases
                                                              64%
                                                                     60%
                                               53%                                     9/30/22 LTM FCF Allocation
  $700

                                                                     40%
              $439                                                                                   Dividends               10%
                                  30%
           29%
  $350
                                                                     20%                             Share Repurchases       54%

                                                                                                     Debt Repayment          27%
     $0                                                              0%
                2019       2020         2021       LTM 9/30/22                                       Other                    9%

          Free Cash Flow      % of FCF Returned to Shareholders
                                                                                                                                   18
Nexstar ESG Principles and Actions
              Ranked as #1 Best ESG for MidCap Media Companies in the Institutional Investor 2023 Survey
                      and Awarded an ESG rating of “Low Risk” by Morningstar Sustainanalytics
                                                      Environmental                                                                                                       Social                          Governance
   Key                                 •     Limit our impact on the                                                 •    Fact-based, unbiased journalism                                      •   Maximize shareholder value
                                             environment
   Principles                                                                                                        •    Community involvement                                                •   Provide opportunities for
                                                                                                                                                                                                   shareholders to make their
                                                                                                                     •    Diversity, equity and inclusion
                                                                                                                                                                                                   opinions known
                                                                                                                                                                                               •   Diversity, equity and inclusion

   Selected                            ✓ Core business of television                                                 ✓ Validated unbiased content at local level, NewsNation and               ✓ One of the best performing media
                                         broadcasting already has a                                                    The Hill by third party watchdog groups                                   stocks over the last year
   Highlights                            minimal impact on the
                                                                                                                     ✓ Community involvement by each of our stations with over                 ✓ Single class of stock (unlike many
   / Actions                             environment
                                                                                                                       1,675 initiatives each year                                               public media companies)
                                       ✓ Began process of collecting data
                                                                                                                     ✓ Nationwide “Feeding America” partnership                                ✓ Virtually entirely independent
                                         to measure our environmental
                                                                                                                                                                                                 Board of Directors (8 of 9*
                                         impact                                                                      ✓ Focus on treating employees fairly, ethically and fostering
                                                                                                                                                                                                 directors are independent)
                                                                                                                       positive work environments
                                       ✓ Plan to establish strategies to
                                                                                                                          −       Company-wide minimum wage above federal and                  ✓ Plan to declassify the Board
                                         reduce / limit our impact in the
                                         future                                                                                   state requirements                                           ✓ Improving Board diversity (2 of 9*
                                                                                                                          −       Established the Nexstar Employee Assistance Fund               directors are women)
                                                                                                                          −       Broad inclusion of management employees in equity            ✓ Active and accessible investor
                                                                                                                                  awards                                                         relations function
                                                                                                                     ✓ Dedicated diversity, equity and inclusion programs, hiring
                                                                                                                       practices and mentorships
                                                                                                                          −       Employees mirror the communities we represent(1)
                                                                                                                          −       Above average senior management diversity(2)
                                                                                                                          −       Effort to increase diversity through expansive recruiting
                                                                                                                                  efforts, support of diversity groups inside of Nexstar and
                                                                                                                                  mentorship programs

 (1) Nexstar Total: 74% White, 11% African American, 9% Hispanic, 3% Asian, 2% Two or More; National Average: 60% White, 12% African American, 18% Hispanic, 6% Asian, 3% Two or More
 (2) Nexstar senior management is 35% women versus C-suite National Average of 26% according to “Women in the Workplace 2022”, McKinsey
 *Dennis Miller recently resigned as director to become President, The CW Network; The Board of Directors has initiated a search for his replacement.                                                                                 19
Invest in Nexstar
          NXST has one of the best short and long-term stock price performances in media,
           one of the highest percentage return of free cash flow to shareholders in media,
                        solid long-term growth prospects, and a low valuation

    ✓ Strong Continued Financial and Stock Price Performance: YTD 2022, Nexstar generated all-
      time high net revenue and was one of the few stocks with a positive 1-year return in all of
      media

    ✓ High Free Cash Flow Generation: Nexstar’s business model is focused on free cash flow
      generation. Consensus estimates show we will generate $2.9BN of cash flow for the Q422 –
      Q424 period, representing just under 40% of our current market capitalization

    ✓ Returning Capital to Shareholders: We returned 64% of our LTM 9/30/22 free cash flow to
      shareholders in the form of dividends and stock repurchases; Increased 2023 dividend by
      50% to $5.40/share p.a., a 2.6% yield

    ✓ Strong Balance Sheet: Our credit rating is Ba3/BB and we have low leverage of 3.2x

    ✓ Excellent short-term visibility and multiple long-term material growth initiatives: 2023 and
      2024 will benefit from new retransmission consent deals and 2024 is a presidential political
      year; we have multiple organic initiatives including NewsNation, The CW and ATSC 3.0 roll-
      out that could generate material growth for Nexstar

                        The Opportunity: We are the largest company with top-tier operational performance
                                      in the sector but trade at a mid-teens ‘22/’23 FCF Yield
                                                                                                            20
Note: Stock price as of 1/27/23.
You can also read