Investor Presentation - (NYSE: HRTG) August 2021 - Heritage Insurance

Page created by Thelma Jordan
 
CONTINUE READING
Investor Presentation - (NYSE: HRTG) August 2021 - Heritage Insurance
Investor Presentation
                (NYSE: HRTG)
                 August 2021
Investor Presentation - (NYSE: HRTG) August 2021 - Heritage Insurance
SAFE HARBOR
Statements in this presentation that are not historical facts are forward‐looking statements that are subject to certain risks and uncertainties that could
cause actual events and results to differ materially from those discussed herein. Without limiting the generality of the foregoing, words such as “may,”
“will,” “expect,” “believe,” “anticipate,” “approximate,” “plan,” “intend,” “could,” “would,” “estimate,” or similar expressions are intended to identify
forward‐looking statements. Forward looking statements include, but are not limited to, statements about the Company’s expectations with regard to
net investment income, underwriting margins and capital to support future premium growth and expansion initiatives. These statements are not
guarantees of future performance and involve risks, uncertainties and assumptions that could cause the Company’s actual results to differ materially
from those expressed or implied by such forward‐looking statements. Such risks and uncertainties include, among other things, risks related to the
possibility that actual losses may exceed reserves; the concentration of the Company’s business in coastal states, which could be impacted by hurricane
losses or other significant weather‐related events such as northeastern winter storms; the Company’s exposure to catastrophic weather events;
increased costs of reinsurance, non‐availability of reinsurance, and non‐collectability of reinsurance; the Company’s failure to effectively manage its
growth and integrate acquired companies; increased competition, competitive pressures, and market conditions; the Company’s failure to accurately
price the risks it underwrites; the inherent uncertainty of the Company’s models and reliance on such models as a tool to evaluate risk; the failure of the
Company’s claims department to effectively manage or remediate claims; low renewal rates and failure of such renewals to meet the Company’s
expectations; the Company’s failure to execute its diversification strategy; failure of the Company’s information technology systems and unsuccessful
development and implementation of new technologies; a lack of redundancy in the Company’s operations; the Company’s failure to attract and retain
qualified employees and independent agents or loss of key personnel; the Company’s inability to generate investment income; the Company’s inability to
maintain its financial stability rating; effects of emerging claim and coverage issues relating to legal, judicial, environmental and social conditions; the
failure of the Company’s risk mitigation strategies or loss limitation methods; changes in regulations and the Company’s failure to meet increased
regulatory requirements; and other matters described from time to time by the Company in its filings with the Securities and Exchange Commission,
including, but not limited to, those set forth in its Annual Report on Form 10‐K for the year ended December 31, 2020 and subsequent Quarterly Reports
on Form 10‐Q (or such other reports that may be filed with the SEC). The Company undertakes no obligations to update, change or revise any forward‐
looking statement, whether as a result of new information, additional or subsequent developments or otherwise, except as required by law.
Non‐GAAP Financial Information: This presentation includes financial measures that are not presented in accordance with generally accepted
accounting principles in the U.S. (GAAP). A reconciliation of these non‐GAAP financial measures to the most directly comparable GAAP financial measure
can be found in the Appendix to this presentation on slide 25.
Note: This presentation also contains information regarding securities analyst consensus and other financial professionals’ estimates of certain financial
items for Heritage and other industry participants derived from reports of FactSet Research Systems (“FactSet”). These estimates are projections made
by securities analysts and other financial professionals who cover Heritage and other industry participants. Any opinions, forecasts, estimates,
projections or predictions regarding Heritage’s performance made by such third parties (and, therefore, such estimates) are theirs alone and do not
represent the opinions, forecasts, estimates, projections or predictions of Heritage or its management. By providing these estimates, Heritage does not
imply its adoption of, endorsement of or concurrence with such information, conclusions or recommendations. Heritage assumes no liability for the
accuracy of such estimates and undertakes no liability to update or revise such estimates based on new information or otherwise.

August 2021 Investor Presentation                                            2
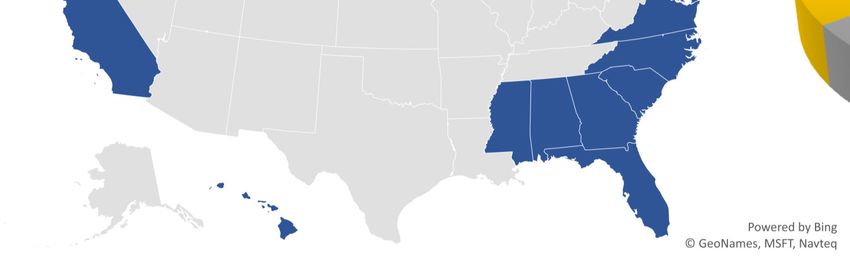
Investor Presentation - (NYSE: HRTG) August 2021 - Heritage Insurance
TABLE OF CONTENTS
                                                                       COMPANY OVERVIEW
Company snapshot……………………………………………………………………………………………………………………………………………………………………….          5
Timeline of events..……………………………………………………………………………………………………………………..……………………………………………….     6
Management team.………………………………………………………………………………………………………………………………………………………………………           7
Corporate structure..………………………………………………………………………………………………………………………………………………….……………......  8
Book of business……………………………………………………………………………………………………………………………………..……………………………………        9
In‐force metrics……………………………………………………………………………………………………………………………………………………………………………. 10
Distribution…………………………………………………………………………………………………………………………………………………………………………..........   11
Reinsurance program…………………………………………………………………………………………………………………………………………………………………… 12‐13
Investments……………………………………………………………………………………………………………………………………………………………………….……..…. 14

                                                              INVESTMENT CONSIDERATIONS
Value proposition………………………………………………………………………………………………………………………………………………………………….........                    16
Underwriting performance, capital management and underwriting leverage…………………………….………………………………………………... 17‐19
Diversification strategy…………………………....…………………………………………………………………………………………………………………………...…….. 20‐21
Book value per share growth, ROEs and valuation……………………………………………………………………………………………………………………….. 22‐24

Appendix: Reconciliation of GAAP and non‐GAAP measures………………………………………………………………………………………………….……..          25
Investor relations contact details………………..……………………………………………………………………………………………………..………………….………             26

Note 1: all market data as of the close on 8/16/2021 unless otherwise noted
Note 2: all non‐market data as of 6/30/2021 unless otherwise noted
August 2021 Investor Presentation                                             3
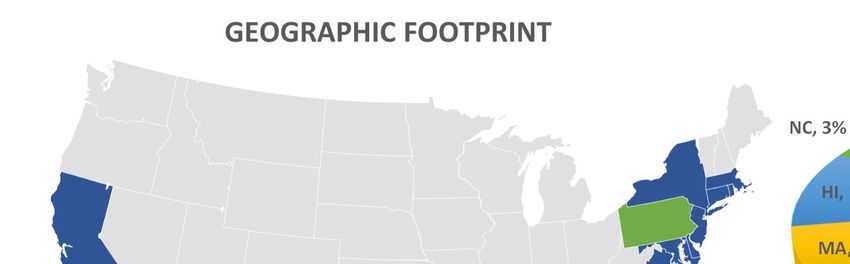
Investor Presentation - (NYSE: HRTG) August 2021 - Heritage Insurance
Company overview
          Heritage Insurance
Investor Presentation - (NYSE: HRTG) August 2021 - Heritage Insurance
COMPANY SNAPSHOT
What we do: Heritage Insurance Holdings, Inc. is a super‐regional property and casualty insurance holding company
with over $1 billion of personal/commercial residential and commercial general liability premium across its multi‐state
footprint.
                                    QUICK FACTS                                           MARKET/FINANCIAL DATA
 Personal residential insurer in 15 US states & licensed                NYSE: HRTG
  in 3 additional states
                                                                         Market Cap/Stock Price: $189 million/$6.76
         19th largest homeowners’ insurer nationwide (as of
          12/31/2020)                                                    Annual Dividend/Yield Per Share: $0.24/3.6%
 Commercial residential insurer in FL, NY & NJ                          Remaining share repurchase authorization: $50.0 million
       4th largest non‐liability commercial multiple peril (CMP)        Total Equity/BVPS: $424.9 million/$15.20
        insurer in FL (as of 12/31/2020)
                                                                         Total Assets: $2.4 billion
 Vertically integrated structure with in‐house
  underwriting, actuarial, customer service, claims                      In‐Force Premiums: $1.2 billion
  processing and adjusting functions (3rd parties used as                Financial Strength Ratings:
  needed)
                                                                             Demotech: HPCIC (A), NBIC (A), ZIC (A Prime)
 636 employees (620 full‐time)                                              Kroll: HPCIC (BBB+), NBIC (A‐), ZIC (BBB+)
 Founded in 2012, followed by IPO in 2014                               Investment grade issuer rating (Kroll: “BBB‐”)
 Headquartered in Clearwater, FL
August 2021 Investor Presentation                                   5
Investor Presentation - (NYSE: HRTG) August 2021 - Heritage Insurance
THE HERITAGE STORY
Founded in 2012, Heritage has quickly grown into a leading coastal US P&C insurer.

      2012                              2015                        2017                                  2019
    Company inception                   Initiated                  Began writing PRES in GA and AL      Began writing PRES in VA
    Started writing voluntary            quarterly                  Sawgrass Mutual policy               Began writing CRES in NJ
     personal residential (PRES)          cash                        assumption                            (first CRES expansion
     business in FL                       dividend                   Acquired NBIC, a coastal HO           outside FL)
    Participated in first personal                                   insurer in NY, NJ, CT, RI & MA       Expanded product
     residential assumption from                                                                            offering in Hawaii
     FL Citizens

    2014                                 2016                                  2018                                    2020
 HRTG IPO (NYSE):                     Began writing PRES in NC & SC,      Received KBRA financial                 Surpassed $1B of
  $11/share                             beginning of multi‐state             strength and investment                  premiums in‐
 Sunshine State policy                 expansion                            grade issuer ratings                     force
  assumption                           Acquired Zephyr, a wind‐only        CAN expansion to non‐FL                 Began writing
 Launched commercial                   HO insurer in HI                     states                                   PRES in CA, DE,
  residential (CRES) division          Launched GL insurance in FL         GEICO relationship expands               MD and MS
  and participated in first            Commenced Nat Gen                   Commenced Safeco (Liberty               Commenced
  commercial residential                partnership                          Mutual) partnership                      partnership with
  assumption from FL                   AoB begins to meaningfully          Eliminated majority of                   The Hartford
  Citizens                              impact results                       convertible debt used to
                                       Final year Heritage participated     acquire NBIC
                                        in Citizens assumptions
August 2021 Investor Presentation                                          6
Investor Presentation - (NYSE: HRTG) August 2021 - Heritage Insurance
EXPERIENCED MANAGEMENT TEAM
                   Ernie Garateix: Chief Executive Officer      Kirk Lusk: Chief Financial Officer   Arash Soleimani: Executive Vice President
                    Has been in his current role since          Has been in his current role        Has been in his current role since
                     2020, prior to which he served as            since 2018.                          2018.
                     Chief Operating Officer since 2014.
                     Before that, he served as Executive         Joined Heritage in 2017 via the     Prior to Heritage, Mr. Soleimani was a
                     Vice President since the company’s           acquisition of NBIC Holdings,        sell‐side equity research analyst
                     2012 founding.                                                                    covering the P&C insurance sector at
                                                                  Inc., where Mr. Lusk was also
                    Prior to Heritage, Mr. Garateix              Chief Financial Officer.             Keefe, Bruyette & Woods (KBW) and
                     served as Vice President of                                                       Stifel Financial.
                     Operations at American Integrity            Before that, Mr. Lusk was
                     Insurance Group.                             International Chief Financial       Before that, Mr. Soleimani worked in
                                                                  Officer of Aetna, Inc., Chief        Deloitte’s Audit & Enterprise Risk
                    Before that, Mr. Garateix was                Financial Officer of Alea Group      Services division.
                     Associate Vice President of IT at            Holdings Bermuda Ltd. and
                     FCCI Insurance Group.
                                                                  Chief Financial Officer of GE       Mr. Soleimani is a CFA charterholder
                                                                  ERC Global Casualty and GE           and a licensed CPA.
                                                                  Capital Auto Warranty Services.

                   Tim Moura: President, NBIC                   Tim Johns: President, Zephyr         Randy Jones: President, Commercial Division

                    Has been in his current role since 2017,    Has been in his current role        Has been in his current role
                     prior to which he served as SVP of           since 2018.                          since 2014.
                     Marketing, Agency, and Client Services
                                                                 Prior to Zephyr, Mr. Johns was      Prior to Heritage, Mr. Jones
                     since 2014.
                                                                  Chief Consumer Officer at the        was SVP of American Strategic
                    Prior to NBIC, Mr. Moura served as Vice      Hawaii      Medical     Service      Insurance’s (ASI) commercial
                     President of Business Development            Association, the largest health      division.
                     and Commercial Lines for Tower Group         insurer in Hawaii.
                     Companies.                                                                       Before that, Mr. Jones served
                                                                 Before that, Mr. Johns held          in management at other
                    Before that, Mr. Moura was Vice              multiple executive leadership        insurance enterprises.
                     President, Underwriting and Product          roles within private, public
                     Management, Personal Lines, at               and non‐profit enterprises in       Mr. Jones holds the American
                     OneBeacon Insurance Group.                   Hawaii.                              Risk Manager (ARM) and
                                                                                                       Certified Property Insurance
                                                                                                       Adviser (CPIA) designations.
August 2021 Investor Presentation                                       7
Investor Presentation - (NYSE: HRTG) August 2021 - Heritage Insurance
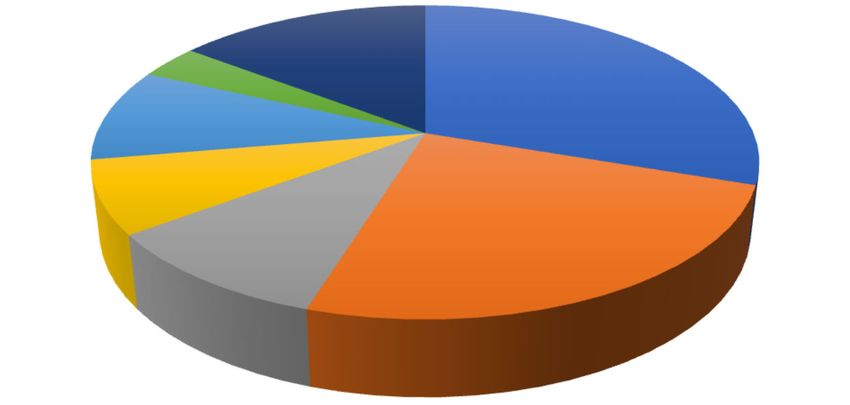
VERTICALLY INTEGRATED STRUCTURE
   Unique, vertically integrated structure reduces our reliance on third parties, benefiting our loss, LAE and
    operating expenses, while also serving as a hedge during catastrophe years.
   Vertically integrated structure reduces our earnings volatility, supporting P/E‐based valuation for HRTG.
   MGA structure allows us to meet holding company capital needs (e.g., debt servicing, share repurchases,
    M&A, etc.)

                                                                                             ORGANIZATIONAL STRUCTURE
  Risk bearing entity                                                                                      Heritage Insurance
  (AL, CA, GA, FL, MS, NC, SC)                                                                               Holdings, Inc.
                                                                                                              (NYSE: HRTG)

Heritage Property &                                                                                                                               Contractors’                             First Access
                                                                        Zephyr Acquisition                               Heritage Insurance                                                                     Skye Lane
Casualty Insurance         NBIC Holdings, Inc                                                    Heritage MGA, LLC                             Alliance Network     Osprey Re Ltd.      Insurance Group,
                                                                            Company                                         Claims, LLC                                                                       Properties, LLC
 Company (HPCIC)                                                                                                                                     (CAN)                                      LLC

                                                                                                      Provides HPCIC & ZIC with               Mitigation and        Captive reinsurer                      Subsidiary that owns
     NBIC Financial          NBIC Service             Westwind
                                                                             HI Holdings, Inc.        underwriting, personnel                 construction                                                 Heritage’s corporate
     Holdings, Inc.           Company              Underwriters, Inc.
                                                                                                      and other services                      division, serves as                                          headquarters
                                                                                                                                              a hedge in
                                 Provides NBIC with                                                                                           catastrophe years
        Narragansett Bay
                                 underwriting, personnel                     Zephyr Insurance
           Insurance                                                                                   Risk bearing entity (HI)
                                 and other services                         Company, Inc. (ZIC)
        Company (NBIC)

   Risk bearing entity (CA, CT, DE, MA, MD, NY, NJ, RI, VA)

August 2021 Investor Presentation                                                                                    8
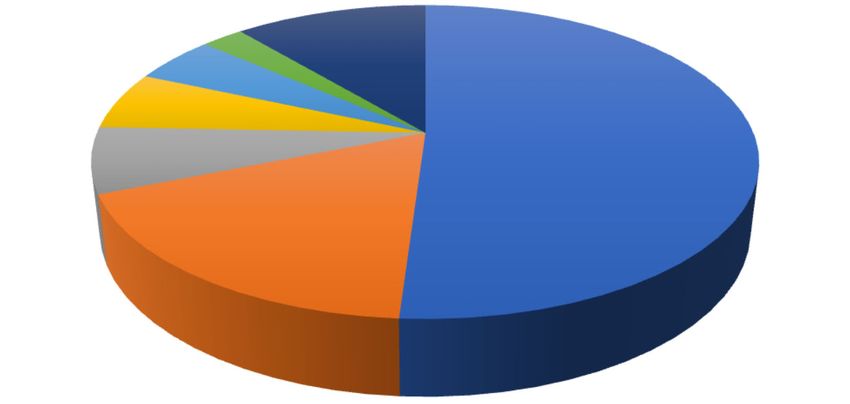
Investor Presentation - (NYSE: HRTG) August 2021 - Heritage Insurance
BOOK OF BUSINESS
Heritage has $1.2 billion of premiums in‐force across three statutory insurance entities (Heritage/NBIC/Zephyr) and primarily writes personal residential
(PRES) insurance. Heritage also writes commercial residential (CRES) insurance and a small amount of commercial general liability (CGL) insurance.
Heritage is actively writing in sixteen states, but has licenses in seventeen.
                                                                    TOTAL INSURED VALUE (PROPERTY)                                                       GROSS PREMIUMS‐IN‐FORCE
                                                                                                                                                            Other*, 11%
                                                                                                                                                NC, 2%
                                                           NC, 3%          Other*, 15%
                                                                                                           FL, 30%                                 HI, 5%
                                                                                                                                               MA, 6%
                                                              HI, 10%                                                                                                                             FL, 51%
                                                                                                                                             NJ, 7%
                                                             MA, 8%

                                                                        NJ, 10%                                                                       NY, 18%
                                                                                                       NY, 25%

                                    = actively writing                  *Other includes AL, CA, CT, DE, GA, MD, MS, RI, SC, & VA
                                    = licensed                          PRES = personal residential • CRES = commercial residential • CGL = commercial general liability • TIV = total insured value

                                                                                                                     CA, CT, DE, MA, MD,
                                                                         AL, CA, FL, GA,
                                                                                                                     PA, NJ, NY, RI, VA                          HI
                                                                         MS, NC, SC

                    3 Statutory Insurance Entities:

August 2021 Investor Presentation                                                         9
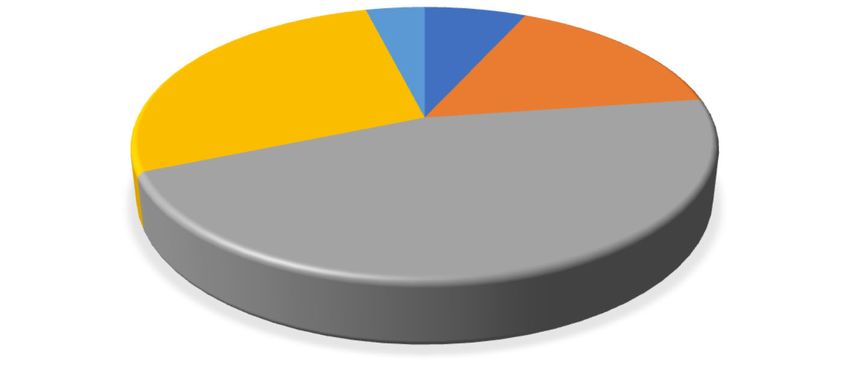
Investor Presentation - (NYSE: HRTG) August 2021 - Heritage Insurance
IN‐FORCE METRICS
Florida property insurance only accounts for 30% of Heritage’s property total insured value (TIV), but reflects 51% of premiums in‐force – the
$510 Florida personal residential (PRES) insurance average premium per $100,000 of TIV is more than double the $205 non‐Florida average
(Florida’s more expensive policies reflect its higher hurricane and litigation risk), while the $407,224 Florida PRES average insured value is well
below the $793,554 average for non‐Florida states (property values in Florida trail those in Heritage’s northeast US states).

                                                                                                                                                             IN‐FORCE METRICS ($ in millions )
                                                Premium/$100k TIV                                                                                                             Premiums In‐Force
                                                                                                                                                   YE2015    YE2016      YE2017    YE2018     YE2019       YE2020     2Q2021
      1,200                                                                                                                                PRES      $478      $516        $850      $837       $861         $969     $1,044
                                             $1,056
                                                                                                                                           CRES      $113      $119         $90       $83        $73         $104       $119
      1,000                                                                                                                                CGL         $0        $1          $2        $4         $6           $9        $10
                                                                                                                                           Total     $592      $635        $942      $924       $941       $1,082     $1,174
        800
                                                                                                                                                                                Policies In‐Force
        600       $510                                                                              $496                                          YE2015      YE2016     YE2017      YE2018       YE2019    YE2020     2Q2021
                                                           $417          $406                                     $382                     PRES 253,726      318,824    518,957    508,424      522,442    568,068    579,126
        400                                                                                                                                CRES    3,405       3,625      3,100       2,973        2,533     3,074      3,144
                                                                                       $249                                                CGL         0         852      2,393       4,289        6,970     9,904     11,516
                                $205
        200                                                                                                                                Total 257,131     323,301    524,450    515,686      531,945    581,046    593,786

          0                                                                                                                                                              Total Insured Value (Property)
                 FL PRES    Non‐FL PRES    FL PRES TC FL PRES ex‐TC     FL CRES    Non‐FL CRES   FL CRES TC FL CRES ex‐TC                          YE2015     YE2016     YE2017      YE2018     YE2019      YE2020    2Q2021
                                                                                                                                           PRES    $72,102   $109,888   $289,974 $296,432 $316,075         $353,780   $371,847
             FL PRES    Non‐FL PRES FL PRES TC           FL PRES ex‐TC       FL CRES     Non‐FL CRES      FL CRES TC     FL CRES ex‐TC     CRES    $22,764    $26,367    $22,832     $23,038     $20,958    $27,851    $29,742
 TIV/PIF $407,224           $793,554        $368,193          $414,697    $9,584,675       $6,784,932   $11,345,725          $9,192,613    Total   $94,866   $136,256   $312,806 $319,470 $337,033         $381,632   $401,589
TIV = total insured value • PIF = policies in‐force • PRES = personal residential • CRES = commercial residential • TC = Tri‐County (FL)

August 2021 Investor Presentation                                                                                    10
DISTRIBUTION
        Overview                    • Robust organic growth engine via independent agency relationships and auto carrier
                                      partnerships across our multi‐state platform

                                    • Over 2,700 actively writing retail independent agents
                                    • 25% of voluntary premium is written by agents affiliated with eight large agency networks that
        HPCIC                         have master agency agreements with HPCIC
                                    • CRES policies are written through roughly 400 independent agents
                                    • Relationships with multiple auto carriers

                                    • Roughly 500 retail independent agents representing approximately 800 agency locations
        NBIC
                                    • 8 wholesale relationships that have access to 1,500 retail locations

                                    • Relationships with 70 actively writing independent agencies
        Zephyr
                                    • 51% of voluntary premium is written by agents affiliated with three large agency networks

August 2021 Investor Presentation                                        11
CATASTROPHE REINSURANCE PROGRAM
            Heritage has a conservative 2021‐2022 catastrophe reinsurance program, protecting the
            Company against hurricanes and severe weather events and reducing earnings volatility.

             Substantial severity and frequency protection.
             First event reinsurance tower exhaustion point of $1.4 billion and total limit of $2.5 billion in the
              southeast.
             Reinstatement premiums for all layers with a reinstatement available have been prepaid.
             Within the reinsurance tower, we have no co‐participation above our regional retentions.
             First event retentions in the southeast and Hawaii of $32.0 million, accounting for 7.5% of 2Q2021
              GAAP equity (pre‐tax). First event retention in the northeast of $20.7 million, accounting for 4.9%
              of 2Q2021 GAAP equity (pre‐tax).
             Total cost to Heritage of $312 million, accounting for 27% of 2Q2021 premiums in‐force.
             Heritage’s third‐party reinsurers are rated “A‐” or higher by A.M. Best or S&P or are fully
              collateralized.

August 2021 Investor Presentation                                   12
CONSERVATIVE REINSURANCE LOSS RETENTION
                                   AFTER‐TAX FIRST EVENT FLORIDA LOSS RETENTION AS % OF 2Q2021 GAAP EQUITY
          18%

                                                                                                                                                                            15.9%
          16%

                                                                                                                                               13.8%
          14%

          12%
                                                                                                                  10.4%
          10%

           8%                                                                         7.4%

           6%                                            5.6%
                            4.7%

           4%

           2%

           0%
                            UIHC                         HRTG                         UVE                     FL peer median                   FNHC                             HCI

  Note 1: Based on 2021‐2022 catastrophe reinsurance programs.
  Note 2: Assumes a modeled 1‐in‐100‐year first event for HPCIC (HRTG) based on 8/31/2021 projections (AIR v8, hurricane only, long term view with demand surge).
  Note 3: Excludes income from vertically integrated operations.
  Note 4: Assumes HCI’s first event retention equals the sum of $16M at HCPCIC and $8M at TIC, plus $23.1M of collateral at Claddaugh. UVE loss retention includes both UPCIC
  & APPCIC and FNHC loss retention includes FNIC, MNIC and Maison.
  Note 5: Calculation based on 21.0% and 5.5% US federal and Florida statutory corporate income tax rates, respectively.
  Source: Peer company reports.

August 2021 Investor Presentation                                                                   13
INVESTMENT PORTFOLIO
Heritage has a very conservative investment portfolio, consisting predominantly of low duration, fixed income
securities. As of 2Q2021, duration was 2.8 years, 0.9 years below 1Q2021’s 3.7 years and 0.3 years below
2Q2020’s 3.1 years.

        INVESTMENT PORTFOLIO BREAKDOWN (2Q2021)                                                                         NET INVESTMENT INCOME PERFORMANCE
                                    Other, 4%                                                          $700                                                                                                 3.0%
                                                US government, 7%
                                                                                                                                                                                     2.6%

                                                                                                                                                                                                                   Net investment income yield
   Industrial & misc.                                       Munis, 16%                                 $600                                                               2.4%

                                                                         Investments ($ in millions)
                                                                                                                                                                                                            2.5%
      bonds, 27%
                                                                                                                                                                                                  2.1%
                                                                                                       $500                         2.0%
                                                                                                                                                   1.8%       1.9%                                          2.0%

                                                                                                       $400              1.6%
                                                                                                              1.4%                                                                                          1.5%
                                                                                                       $300

                                                                                                                                                                                                            1.0%
                                                                                                       $200

                                                Special revenue                                                                                                                                             0.5%
                                                                                                       $100

                                                                                                                          $331.2

                                                                                                                                     $400.1

                                                                                                                                                    $603.0

                                                                                                                                                               $567.0

                                                                                                                                                                           $528.6

                                                                                                                                                                                      $595.2

                                                                                                                                                                                                   $589.0
                                                                                                               $136.2
                                                  bonds, 46%
                                                                                                         $0                                                                                                 0.0%
                                                                                                              2013       2014       2015           2016       2017        2018       2019         2020

                                                                                                                         Investments (left axis)             Net investment income (right axis)

August 2021 Investor Presentation                                                                  14
Investment considerations
                  Heritage Insurance
VALUE PROPOSITION
   Compelling              • Currently trading at significant discount to peers, despite attractive relative ROE and income metrics
   financial metrics       • Consistent track record of book value growth
                           • Vertically integrated structure provides a hedge in catastrophe years, reducing loss retention and
   Business model designed   further reducing earnings volatility, supporting use of P/E‐based valuation for HRTG
   to reduce earnings
   volatility              • Solid reinsurance program, including lowest reinsurance retention in FL peer group as a % of equity;
                             protects against hurricanes and other severe events, reducing earnings volatility
                           • Organic premium growth, fueled by relationships with independent agents and auto carriers
   Growth &                • Diversification initiatives and recent re‐underwriting and de‐risking efforts should benefit
   underwriting              underwriting margins
   outlooks
   improving
                           • Commercial residential business serves as an AoB‐hedge in Florida and provides us with additional
                             growth opportunities

                                    • Investment grade debt rating provides easy access to capital, allowing nimble response to market
                                      opportunities as they arise
   Prudent capital
   management                       • Below‐peer operating leverage = ample capital to fuel our growth
                                    • Track record of capital return via share repurchases and regular dividend
                                    • Successful M&A execution provides synergies and access to new markets
   Management and
                                    • Significant insider ownership aligns management’s and BoD’s interests with shareholders
   BoD have significant
   skin in the game                      • Total insider ownership = 9% of outstanding shares

August 2021 Investor Presentation                                        16
PREMIUM GROWTH
Heritage has experienced significant premium growth since inception, most recently stemming from organic
growth, while earlier growth stemmed from Citizens depopulation transactions and M&A.
    Heritage’s premium growth is unprecedented, reaching over $1 billion of premiums in‐force 8 years after the company’s founding. The modest
    premium decline in 2018 and low premium growth in 2019 stemmed from Tri‐County FL exposure reduction efforts that were completed in 3Q2019.

                                                                   IN‐FORCE PREMIUM
                 $1,200                                                                                                        $1,173.8

                                                                                                                   $1,082.3      56.7

                                                                                                                     54.4
                 $1,000                                                                $942.4            $940.6
                                                                                                $923.7
                                                                                        55.4     53.5     53.5                  434.0
                                                                                                                    398.6
                  $800

                                                                                        331.5            356.3
                                                                                                337.2
                                                                      $635.3
                                                          $591.5
                  $600                                                 58.1

                                              $461.3

                  $400
                                                                                                                                683.1
                                                          591.5                                                     629.2
                                                                       577.2            555.5   533.0    530.8
                                    $200.1     461.3
                  $200

                            $51.6   200.1
                             51.6
                    $0
                            2012    2013       2014       2015         2016             2017    2018     2019       2020        2Q21

                                                                    HPCIC      NBIC   Zephyr

August 2021 Investor Presentation                                              17
UNDERWRITING PERFORMANCE (CONTINUED)
Heritage’s underwriting operation has outperformed peers every year since inception.
                                                                           SOLID UNDERWRITING MARGINS
         120%                                                                                                                                                                  118.0%
                                                                                                                                                          106.5%                                  120%
                                                                                                              98.5%                 96.7%                                      107.0%
                                                                                           93.3%                                                                                                  100%
         100%          80.8%                                       78.4%                                      94.1%                                        96.5%
                                            74.8%                                                                                   90.4%
                                                                                          92.8%                                                                                                   80%
                                                                                                                                                                                38.5%
                                                                                                                                                                                                  60%
          80%          72.9%                71.4%                                         34.8%                                                            39.4%
                                                                                                              41.0%                 38.1%                                                         40%
                                                                   65.0%

          60%                                                                                                                                                                                     20%
                       32.4%                31.3%
                                                                   27.5%                                                                                                                          0%

          40%                                                                                                                                                                                     ‐20%
                                                                                                                                                                                68.5%
                                                                                          58.0%                                                            57.1%
                                                                                                                                                                                                  ‐40%
                                                                                                              53.1%                 52.3%
          20%          40.5%                40.1%                  37.5%                                                                                                                          ‐60%
                                                                                                                                                                                                  ‐80%
           0%                                                                                                                                                                                     ‐100%
                       2013                  2014                  2015                   2016                2017                  2018                   2019                 2020
                                                                                   Tornadoes, Hurricanes    Hurricane Irma &    Hurricanes Lane,       Southeast hail and   Hurricanes Isaias, Sally and
                                                                                   Hermine & Matthew, AOB   AoB                 Florence &             wind storms,         Eta, Southeast hail,
                            Citizens takeouts benefit HRTG’s margins
                                                                                                                                Michael, AoB           Hurricane Dorian     tornado and wind storms

                                                          Loss ratio (left axis)            Expense ratio (left axis)           Peer average (right axis)
                                                                                                                Note 1: Peers include FNHC, HCI, KINS, UIHC & UVE
                                                                                                                Source: FactSet and peer company reports

August 2021 Investor Presentation                                                                     18
CAPITAL MANAGEMENT & OPERATING LEVERAGE
Heritage has been a responsible steward of shareholder capital and currently has $50.0 million remaining on its
share repurchase authorization. Since 2015, the Company has returned $114.0 million to shareholders through
common share repurchases and dividends.
Heritage’s ratio of trailing‐twelve‐month (TTM) gross premiums written to 2Q2021 equity is only 2.8x , among the
lowest in its peer group, which is indicative of its conservative balance sheet. Looking ahead, Heritage has
adequate capital to fuel its premium growth and multi‐state expansion initiatives.
                                     DISCIPLINED CAPITAL MANAGEMENT                                                                                                                     CONSERVATIVE GROSS OPERATING LEVERAGE
                   $70                                                                                                  40%                                                8.0

                                                                                                                                   Gross operating leverage (GPW/Equity)
                                             35%                                                                                                                                                                                                        7.3
                   $60                                                                                                  35%                                                7.0
   $ in millions

                                                                                                                        30%                                                6.0
                   $50                                      27%

                                                                          23%                                           25%                                                5.0
                             $32.6                                                        22%              22%                                                                                                                                   4.2
                   $40
                                                                                                                                                                           4.0                                                         3.4
                                                                                                                        20%                                                                                            3.0
                                            $28.1                         $23.3                                                                                                                           2.8
                   $30                                                                                                                                                     3.0                  2.6
                              18%                                                                                       15%                                                      1.9
                              25.6                                                                                                                                         2.0
                   $20                                                                   $16.8
                                             21.6                                                                       10%
                                                                          16.1                                                                                             1.0
                                                           $8.4
                   $10                                                                                                  5%
                                                            2.0                                            $3.4                                                            0.0
                              7.0            6.5            6.4            7.1                                                                                                   KINS           HCI      HRTG      Peer median         UVE       UIHC   FNHC
                    $0                                                                                     3.4          0%
                             2016           2017           2018           2019          2020              2Q21                                                                           KINS    HCI   HRTG     Peer median      UVE     UIHC   FNHC
                              Dividends              Share repurchases             Debt‐to‐capital ratio (right axis)
                   Note: Debt‐to‐capital calculated as debt principal divided by the sum of debt principal and                                                     Note: Based on the ratio of 2Q2021 TTM gross premiums written (GPW) to 2Q2021 GAAP equity.
                   stockholders’ equity                                                                                                                            Source: Peer company reports.

August 2021 Investor Presentation                                                                                             19
DIVERSIFICATION STRATEGY UNDERWAY
                                    % OF CONSOLIDATED PROPERTY TOTAL INSURED VALUE (TIV) IN FLORIDA

                     100.0%         100.0%          100.0%          100.0%
          100%
                                                                                                          Heritage has been reducing its exposure to Florida’s
                                                                                                          Tri‐County region and diversifying to new states,
           90%
                                                                                                          resulting in a better spread of risk, better claims
                                                     34.0%                                                trends and lower reinsurance costs.
           80%
                                                                                    70.6%
           70%        58.9%                                          57.1%
                                    67.6%
           60%
                                                     25.7%
           50%                                                                      41.3%

           40%
                                                                     15.4%                        32.1%           31.6%         30.1%         31.3%          30.2%
           30%
                                                                                    11.5%
           20%        41.1%                          40.3%                                        21.7%           23.3%         23.7%          25.8%         25.3%
                                    32.4%
                                                                     27.5%
           10%                                                                      17.8%          3.8%            2.9%         2.0%
                                                                                                   6.6%            5.5%                        1.9%              1.5%
             0%                                                                                                                 4.3%           3.5%              3.3%
                       2012          2013            2014             2015          2016           2017            2018         2019           2020              2Q21

                                             Personal Residential: Tri‐County, FL     Commercial Residential: Tri‐County, FL     Other FL

August 2021 Investor Presentation                                                           20
FAVORABLE CLAIMS TRENDS
Heritage’s Tri‐County, FL (TC) exposure reduction efforts have benefited claims trends, as the region’s contribution
to open non‐hurricane claim counts has generally declined since year‐end 2017 for both litigated and non‐litigated
claims. This is benefiting overall claims trends – beginning with 1Q18, litigated claims have generally been
accounting for a smaller percentage of Heritage’s non‐hurricane open claims inventory.
                        Tri‐County, FL (TC) claims are typically more expensive                                                                                                                                          A general decline in litigated claims as a % of open
                        given the prevalence of assignment of benefits and                                                                                                                                               claims should benefit underwriting margins, given that
                        litigation abuse in the region                                                                                                                                                                   litigated claims are typically more expensive to resolve

                                TRI‐COUNTY FL NON‐HURRICANE CLAIMS TRENDS                                                                                                                                           LITIGATED NON‐HURRICANE OPEN CLAIMS AS % OF TOTAL
                                                                                                                                                                                                                               OPEN NON‐HURRICANE CLAIMS
          84%

                                82%
                 82%

                                       82%
                         81%

                                                     80%

                                                                          79%
                                                            79%
                                                                   79%
                                              79%

   90%
                                                                                 79%
                                                                                        78%
                                                                                               77%
                                                                                                      73%

   80%                                                                                                                                                                                            70%
                                                                                                             67%
                                                                                                                    66%

                                                                                                                                                                                                                                                                                 59%
                                                                                                                                                                                                                                                                                        59%
                                                                                                                                                                                                                                                                          58%
                                                                                                                                                                                                                                                                   58%
                                                                                                                           63%

                                                                                                                                                                                                                                                                                               55%
                                                                                                                                  61%

                                                                                                                                                                                                                                                                                                      54%
                                58%

                                                                                                                                         59%
   70%

                                                                                                                                                58%
                                                            56%
                                                                   55%
                                                                          55%
                                       55%

                                                                                                                                                                                                                                                            51%
                                                                                 55%
                                                     54%

                                                                                                                                                                                                                                       51%
                                                                                                                                                                                                  60%

                                                                                                                                                                                                                                              50%
                                                                                                                                                                                                                                                     50%
                                                                                                                                                       54%
                                              52%

                                                                                        51%
          51%

                                                                                                                                                              52%
                                                                                               49%

                                                                                                                                                                     50%

                                                                                                                                                                                                                                                                                                             46%
   60%
                 47%
                         46%

                                                                                                                                                                            47%

                                                                                                                                                                                                                                                                                                                                                                            44%
                                                                                                                                                                                                                                                                                                                                                       44%
                                                                                                                                                                                                                                44%
                                                                                                                                                                                                                         43%

                                                                                                                                                                                                                                                                                                                                                                                          43%
                                                                                                      44%

                                                                                                                                                                                   46%

                                                                                                                                                                                                                                                                                                                                                                                   42%
                                                                                                                                                                                                                                                                                                                                                41%
                                                                                                                                                                                          44%
                                                                                                                                                                                                  50%

                                                                                                                                                                                                           41%

                                                                                                                                                                                                                                                                                                                                         41%

                                                                                                                                                                                                                                                                                                                                                              40%
                                                                                                             41%

                                                                                                                                                                                                                                                                                                                                                                     40%
                                                                                                                                                                                                                  40%
                                                                                                                    39%
                                                                                                                           38%

   50%

                                                                                                                                                                                                                                                                                                                                  36%
                                                                                                                                                                                                                                                                                                                           34%
                                                                                                                                                                                                  40%
                                                                                                                                  27%

   40%

                                                                                                                                                                                                                                                                                                                    28%
                                                                                                                                                                            22%
                                                                                                                                                                     22%
                                                                                                                                         21%
                                                                                                                                                21%
                                                                                                                                                       20%

                                                                                                                                                                                   18%
   30%                                                                                                                                                                                            30%

                                                                                                                                                                                          17%
                                                                                                                                                              17%
   20%                                                                                                                                                                                            20%
   10%
                                                                                                                                                                                                  10%
    0%
          1Q15
                 2Q15
                         3Q15
                                4Q15
                                       1Q16
                                              2Q16
                                                     3Q16
                                                            4Q16
                                                                   1Q17
                                                                          2Q17
                                                                                 3Q17
                                                                                        4Q17
                                                                                               1Q18
                                                                                                      2Q18
                                                                                                             3Q18
                                                                                                                    4Q18
                                                                                                                           1Q19
                                                                                                                                  2Q19
                                                                                                                                         3Q19
                                                                                                                                                4Q19
                                                                                                                                                       1Q20
                                                                                                                                                              2Q20
                                                                                                                                                                     3Q20
                                                                                                                                                                            4Q20
                                                                                                                                                                                   1Q21
                                                                                                                                                                                          2Q21
                                                                                                                                                                                                      0%

                                                                                                                                                                                                           1Q15
                                                                                                                                                                                                                  2Q15
                                                                                                                                                                                                                         3Q15
                                                                                                                                                                                                                                4Q15
                                                                                                                                                                                                                                       1Q16
                                                                                                                                                                                                                                              2Q16
                                                                                                                                                                                                                                                     3Q16
                                                                                                                                                                                                                                                            4Q16
                                                                                                                                                                                                                                                                   1Q17
                                                                                                                                                                                                                                                                          2Q17
                                                                                                                                                                                                                                                                                 3Q17
                                                                                                                                                                                                                                                                                        4Q17
                                                                                                                                                                                                                                                                                               1Q18
                                                                                                                                                                                                                                                                                                      2Q18
                                                                                                                                                                                                                                                                                                             3Q18
                                                                                                                                                                                                                                                                                                                    4Q18
                                                                                                                                                                                                                                                                                                                           1Q19
                                                                                                                                                                                                                                                                                                                                  2Q19
                                                                                                                                                                                                                                                                                                                                         3Q19
                                                                                                                                                                                                                                                                                                                                                4Q19
                                                                                                                                                                                                                                                                                                                                                       1Q20
                                                                                                                                                                                                                                                                                                                                                              2Q20
                                                                                                                                                                                                                                                                                                                                                                     3Q20
                                                                                                                                                                                                                                                                                                                                                                            4Q20
                                                                                                                                                                                                                                                                                                                                                                                   1Q21
                                                                                                                                                                                                                                                                                                                                                                                          2Q21
                        Tri‐County, FL open litigated claims as % of total open litigated claims (non‐hurricane)
                        Tri‐County, FL open non‐litigated claims as % of total open non‐litigated claims (non‐hurricane)                                                                                   Note: Excludes ALAE only claims.

Note: Data in both charts excludes NBIC.
August 2021 Investor Presentation                                                                                                                                                                21
SOLID BOOK VALUE PER SHARE GROWTH
Since inception, Heritage has provided investors with solid book value per share growth. Including cumulative dividends
declared, Heritage’s book value per share compound annual growth rate (CAGR) is 21% since the Company’s 2012 inception.
                                             SOLID GROWTH IN BOOK VALUE AND CUMULATIVE DIVIDENDS PER SHARE
            $18                                                                                                                       $17.19
                                                                                                                           $16.67                $16.57
                                                                                                                                      $1.25
            $16                                                                                                            $1.01
                                                                                                $15.20         $15.20                            $1.37
                                                                                                 $0.53          $0.77
            $14
                                                                            $12.70
                                                              $11.76         $0.29
            $12
                                                               $0.05

            $10
                                                $8.56
              $8                    $7.20

              $6

              $4       $3.38

              $2
                                                                $11.71

                                                                                 $12.41

                                                                                                   $14.67

                                                                                                                 $14.43

                                                                                                                             $15.66

                                                                                                                                        $15.94

                                                                                                                                                   $15.20
                         $3.38

                                     $7.20

                                                  $8.56

              $0
                       2012         2013         2014          2015          2016                2017           2018       2019       2020       2Q21
                                                          Book Value Per Share            Cumulative Dividends Per Share

August 2021 Investor Presentation                                                         22
ABOVE‐PEER ROE, BUT BELOW‐PEER VALUATION
    SOLID ROE PERFORMANCE, EVEN IN HURRICANE YEARS                                                                                TRADING AT A MEANINGFUL DISCOUNT TO PEERS
                                           RETURN ON EQUITY (ROE)                                                                                               PRICE/BOOK VALUE
          Citizens depopulation transactions benefit ROEs           Active northeast US
                                                                    weather & Hurricanes                                  2.5x
       35%                                                          Lane, Florence & Michael
                                30.3%     Severe 1Q16 FL                                                                  2.0x
       30%       28.1%
                                          tornadoes, Hurricanes                           Southeast        Most
       25%                                Hermine & Matthew                               hail/wind        active
                                                                                                                          1.5x
                                                                                          storms,          weather
       20%
                                                       Hurricane Irma                     Hurricane        year in
       15%                                                                                                                1.0x               0.9x                                0.8x
                                                            11.1%                         Dorian           company
                                               9.5%                                                                                                                  0.6x
       10%                                                                 6.7%             6.6%           history                0.4x                   0.5x
                                                                                                            2.8%          0.5x
        5%
                                                                                                                                                                                             0.9x        4.2x             5.5x
        0%                                                                                                                0.0x
                 2014           2015           2016         2017*          2018             2019            2020                 HRTG     Peer median    UIHC       FNHC        KINS         UVE            HCI           PLMR
                                                                    FL litigation abuse
                     2018‐2020 AVERAGE RETURN ON EQUITY VS. PEERS                                                                                               PRICE/2022E EPS
      14%                                                                          HRTG’s average 2018‐2020               30x                                                                       27.5x
                                                               11.5%               ROTE has outperformed by
      12%                                                                                                                 25x
                                                                                   1,000 bps.
      10%           HRTG’s average 2018‐2020 ROE has                                                                      20x
                    outperformed by 280 bps.                                                       HRTG*
        8%
                                                                                                   Peer Average           15x                                                            12.7x
        6%               5.1%                                                                                                               10.1x
                                                                                                                          10x                                      7.3x       7.5x
                                                                                                                                 6.6x                   5.7x
        4%
                                   2.3%

                                                                                                                                                                                                                  99.2x
                                                                            1.5%                                           5x
        2%
                                                                                                                           0x
        0%
                                                                                                                                 HRTG    Peer median    UVE        FNHC      UIHC        KINS       PLMR          HCI
                    Average Return on Equity           Average Return on Tangible Equity
 *HRTG’s 2017 return on equity (ROE) and return on tangible equity (ROTE) metrics are non‐GAAP and adjusted to exclude a $42.2 million non‐cash, non‐tax deductible charge related to the mark‐to‐market of a
 derivative liability associated with the Company’s convertible debt. The derivative liability was reclassified to equity in 4Q17.
 Note: ROE represents net income for the period (annualized for 3Q2019 YTD) divided by average stockholders’ equity during the period. The ROTE calculation excludes goodwill and other intangible assets from equity.
 Source: FactSet and peer company reports
August 2021 Investor Presentation                                                                                    23
HIGHLY ATTRACTIVE VALUATION RELATIVE TO PEERS
                                                          P/E               P/BV                                   Return on Equity                                            Return on Tangible Equity
         Ticker     Company                              2022E   Current    2021E      2022E      2016       2017*      2018          2019     2020     2021E       2016      2017*      2018       2019      2020
         HRTG       Heritage Insurance Holdings, Inc.      6.6    0.44        0.4        0.4       9.5%      11.1%        6.7%         6.6%     2.1%      1.2%      10.7%     20.0%      16.9%      13.5%      4.1%
         FNHC       FedNat Holding Company                 7.3    0.56        0.5        0.5       0.5%        3.7%       7.0%         0.4%   -35.5%    -47.5%       0.5%       3.7%      7.0%       0.4%    -36.4%
         HCI        HCI Group, Inc.                       99.2    4.23        4.4        4.5      12.1%       -3.1%       9.4%        14.5%     4.1%      4.5%      12.2%      -3.2%      9.7%      14.8%     19.4%
         UIHC       United Insurance Holdings Corp.        7.5    0.52        0.5        0.5       2.4%        2.6%       0.1%        -5.8%   -21.5%    -12.1%       2.5%       3.2%      0.1%      -7.3%    -36.5%
         UVE        Universal Insurance Holdings, Inc.     5.7    0.92        0.9        0.8      29.9%      26.4%       24.9%         9.3%     4.1%     15.5%      30.0%     26.5%      25.0%       9.4%      5.4%
         KINS       Kingstone Companies Incorporated      12.7    0.82        0.8        0.8      17.5%      13.2%        3.4%        -8.4%     3.0%      6.1%      18.0%     13.4%       3.4%      -8.4%      1.4%
         PLMR       Palomar Holdings, Inc.                27.5    5.55        5.1        4.3       9.0%        5.0%      20.9%         6.7%     2.1%     15.8%       9.1%       5.0%     21.0%       6.8%      2.2%
         Coastal Property Peer Median                     10.1    0.87        0.8        0.8      10.6%        4.4%       8.2%         3.6%     2.6%      5.3%      10.7%       4.4%      8.3%       3.6%      1.8%
         Source: FactSet and peer company reports

*HRTG’s 2017 net income and ROE are non‐GAAP and adjusted to exclude a $42.2 million non‐cash, non‐deductible charge related to the mark‐to‐market of a derivative liability associated with the Company’s
convertible debt. The derivative liability was reclassified to equity in 4Q17. Please see slide 24 for a reconciliation of HRTG’s non‐GAAP measures to their comparable GAAP measures.
August 2021 Investor Presentation                                                                             24
APPENDIX: NON‐GAAP RECONCILIATIONS
                                    RECONCILIATION OF GAAP AND NON‐GAAP MEASURES
                                    $ in millions
                                                                                              2017
                                    GAAP Net income (loss)                                $   (1.1)
                                    Conversion option liability fair value                    42.2
                                    Non‐recurring business acquisition related expenses         ‐
                                    Tax impact                                                  ‐
                                    Adjusted net income                                   $   41.1

                                                                                               2017
                                    GAAP ROE                                                  ‐0.3%
                                    Conversion option liability fair value                    11.4%
                                    Non‐recurring business acquisition related expenses        0.0%
                                    Tax impact                                                 0.0%
                                    Adjusted ROE (non‐GAAP)                                   11.1%

August 2021 Investor Presentation                                     25
ADDITIONAL INFORMATION
Arash Soleimani, CFA, CPA
Executive Vice President
asoleimani@heritagepci.com
727.871.0206

Website: investors.heritagepci.com
You can also read