Investor Presentation - Second Quarter 2021 June 1, 2021 - Scotiabank Global Site
←
→
Page content transcription
If your browser does not render page correctly, please read the page content below
Investor
Presentation
Second Quarter 2021
June 1, 2021
Caution Regarding Forward-Looking Statements

From time to time, our public communications often include oral or written forward-            changes to accounting standards, rules and interpretations on these estimates; global
looking statements. Statements of this type are included in this document, and may be          capital markets activity; the Bank’s ability to attract, develop and retain key executives;
included in other filings with Canadian securities regulators or the U.S. Securities and       the evolution of various types of fraud or other criminal behaviour to which the Bank is
Exchange Commission, or in other communications. In addition, representatives of the           exposed; disruptions in or attacks (including cyber-attacks) on the Bank’s information
Bank may include forward-looking statements orally to analysts, investors, the media           technology, internet, network access, or other voice or data communications systems
and others. All such statements are made pursuant to the “safe harbor” provisions of           or services; increased competition in the geographic and in business areas in which we
the U.S. Private Securities Litigation Reform Act of 1995 and any applicable Canadian          operate, including through internet and mobile banking and non-traditional
securities legislation. Forward-looking statements may include, but are not limited to,        competitors; exposure related to significant litigation and regulatory matters; the
statements made in this document, the Management’s Discussion and Analysis in the              occurrence of natural and unnatural catastrophic events and claims resulting from such
Bank’s 2020 Annual Report under the headings “Outlook” and in other statements                 events; the emergence of widespread health emergencies or pandemics, including the
regarding the Bank’s objectives, strategies to achieve those objectives, the regulatory        magnitude and duration of the COVID-19 pandemic and its impact on the global
environment in which the Bank operates, anticipated financial results, and the outlook         economy and financial market conditions and the Bank’s business, results of
for the Bank’s businesses and for the Canadian, U.S. and global economies. Such                operations, financial condition and prospects; and the Bank’s anticipation of and
statements are typically identified by words or phrases such as “believe,” “expect,”           success in managing the risks implied by the foregoing. A substantial amount of the
“foresee,” “forecast,” “anticipate,” “intend,” “estimate,” “plan,” “goal,” “project,” and      Bank’s business involves making loans or otherwise committing resources to specific
similar expressions of future or conditional verbs, such as “will,” “may,” “should,”           companies, industries or countries. Unforeseen events affecting such borrowers,
“would” and “could.”                                                                           industries or countries could have a material adverse effect on the Bank’s financial
                                                                                               results, businesses, financial condition or liquidity. These and other factors may cause
By their very nature, forward-looking statements require us to make assumptions and            the Bank’s actual performance to differ materially from that contemplated by forward-
are subject to inherent risks and uncertainties, which give rise to the possibility that our   looking statements. The Bank cautions that the preceding list is not exhaustive of all
predictions, forecasts, projections, expectations or conclusions will not prove to be          possible risk factors and other factors could also adversely affect the Bank’s results, for
accurate, that our assumptions may not be correct and that our financial performance           more information, please see the “Risk Management” section of the Bank’s 2020 Annual
objectives, vision and strategic goals will not be achieved.                                   Report, as may be updated by quarterly reports.

We caution readers not to place undue reliance on these statements as a number of              Material economic assumptions underlying the forward-looking statements contained
risk factors, many of which are beyond our control and effects of which can be difficult       in this document are set out in the 2020 Annual Report under the headings “Outlook”,
to predict, could cause our actual results to differ materially from the expectations,         as updated by quarterly reports. The “Outlook” sections are based on the Bank’s views
targets, estimates or intentions expressed in such forward-looking statements.                 and the actual outcome is uncertain. Readers should consider the above-noted factors
                                                                                               when reviewing these sections. When relying on forward-looking statements to make
The future outcomes that relate to forward-looking statements may be influenced by             decisions with respect to the Bank and its securities, investors and others should
many factors, including but not limited to: general economic and market conditions in          carefully consider the preceding factors, other uncertainties and potential events. Any
the countries in which we operate; changes in currency and interest rates; increased           forward-looking statements contained in this document represent the views of
funding costs and market volatility due to market illiquidity and competition for              management only as of the date hereof and are presented for the purpose of assisting
funding; the failure of third parties to comply with their obligations to the Bank and its     the Bank’s shareholders and analysts in understanding the Bank’s financial position,
affiliates; changes in monetary, fiscal, or economic policy and tax legislation and            objectives and priorities, and anticipated financial performance as at and for the
interpretation; changes in laws and regulations or in supervisory expectations or              periods ended on the dates presented, and may not be appropriate for other purposes.
requirements, including capital, interest rate and liquidity requirements and guidance,        Except as required by law, the Bank does not undertake to update any forward-looking
and the effect of such changes on funding costs; changes to our credit ratings;                statements, whether written or oral, that may be made from time to time by or on its
operational and infrastructure risks; reputational risks; the accuracy and completeness        behalf.
of information the Bank receives on customers and counterparties; the timely
development and introduction of new products and services; our ability to execute our          Additional information relating to the Bank, including the Bank’s Annual Information
strategic plans, including the successful completion of acquisitions and dispositions,         Form, can be located on the SEDAR website at www.sedar.com and on the EDGAR
including obtaining regulatory approvals; critical accounting estimates and the effect of      section of the SEC’s website at www.sec.gov.
                                                                                                                                                                                             2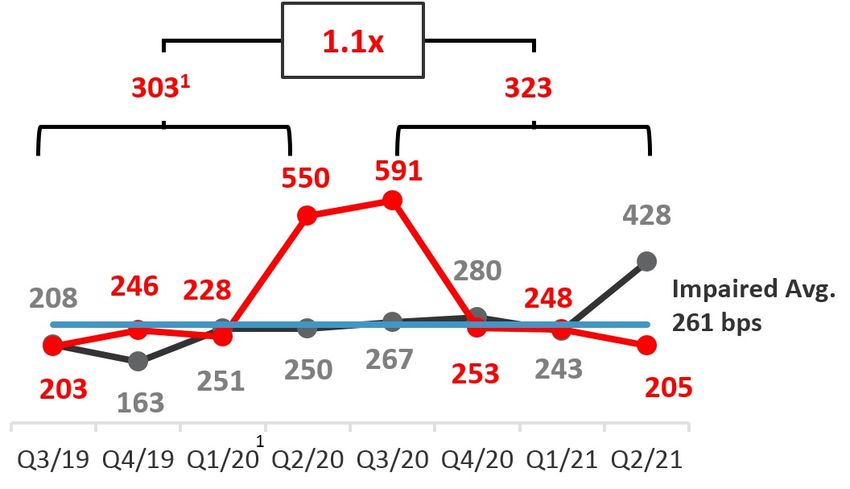
Steady improvement in financial
                  performance

Opening
Remarks           Improving economic conditions
                  and a more positive outlook

Brian Porter
President & CEO   Recognition for customer service
                  and commitment to ESG

                                                     3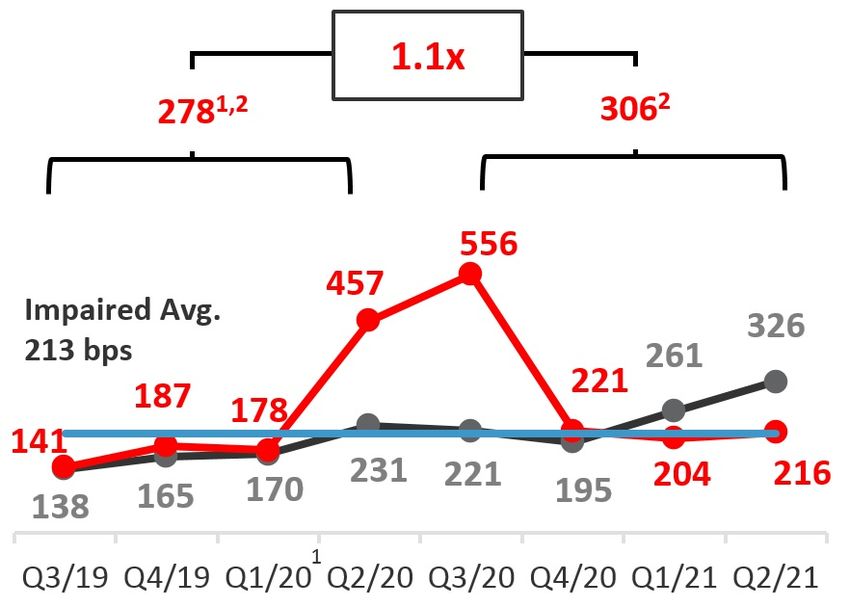
Q2/21
Financial
Results
Raj Viswanathan
Group Head & CFO

                   4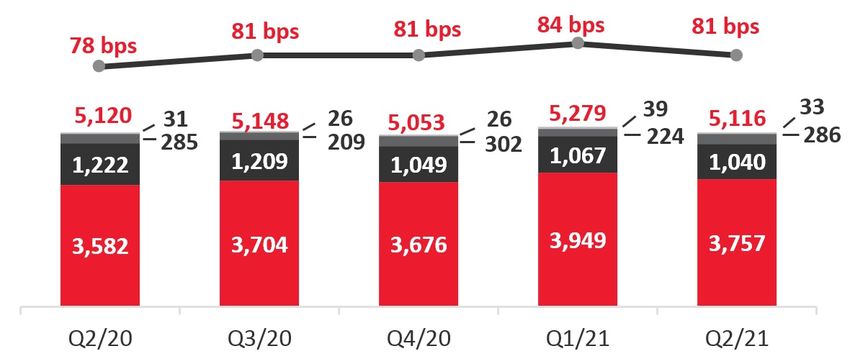
Q2 2021 Financial Performance
           $MM, except EPS                                   Q2/21                Y/Y                 Q/Q
    Reported
                                                                                                                          YEAR-OVER-YEAR HIGHLIGHTS
                             Net Income                      $2,456              85%                    2%       •   Adjusted EPS2 +83%
             Pre-Tax, Pre-Provision Profit                   $3,694               3%                   (4%)
                             Diluted EPS                      $1.88              88%                    1%
                                                                                                                 •   Adjusted pre-tax, pre-provision profit2 +2%
                                 Revenue                     $7,736              (3%)                  (4%)      •   Adjusted revenue2 -3%
                                Expenses                     $4,042              (7%)                  (4%)          o Net interest income down 5% driven by lower margins
                       Productivity Ratio                    52.2%            (260 bps)              10 bps
                    Core Banking Margin                      2.26%              (9 bps)               (1 bp)         o Non-interest income up 1%
                               PCL Ratio1                    33 bps            (86 bps)             (16 bps)     •   Core banking margin -9 bps (-1 bp Q/Q)
            PCL Ratio on Impaired Loans1                     80 bps             24 bps               31 bps          o Decline primarily driven by central bank rate cuts, business
    Adjusted2                                                                                                          mix changes and lower margin liquid assets
                             Net Income                      $2,475              81%                   2%
                                                                                                                 •   Adjusted expenses2 -7%
             Pre-Tax, Pre-Provision Profit                   $3,720               2%                  (4%)
                             Diluted EPS                      $1.90              83%                   1%        •   YTD adjusted operating leverage2 of +3.4%
                                 Revenue                     $7,736             (3%)                  (4%)       •   Strong ROE2 of 14.9%, up 670 bps (+50 bps Q/Q)
                                Expenses                     $4,016             (7%)                  (4%)
                       Productivity Ratio                    51.9%            (210 bps)              10 bps

            ADJUSTED NET INCOME2 YEAR-OVER-YEAR ($MM)                                                           ADJUSTED NET INCOME2,3 BY BUSINESS SEGMENT ($MM)

1 Includes provision for credit losses on certain assets – loans, acceptances and off-balance sheet exposures
2 Refer to Non-GAAP Measures on slide 37 for adjusted results
3 Attributable to equity holders of the Bank                                                                                                                                      5
4 Y/Y growth rate is on a constant dollar basis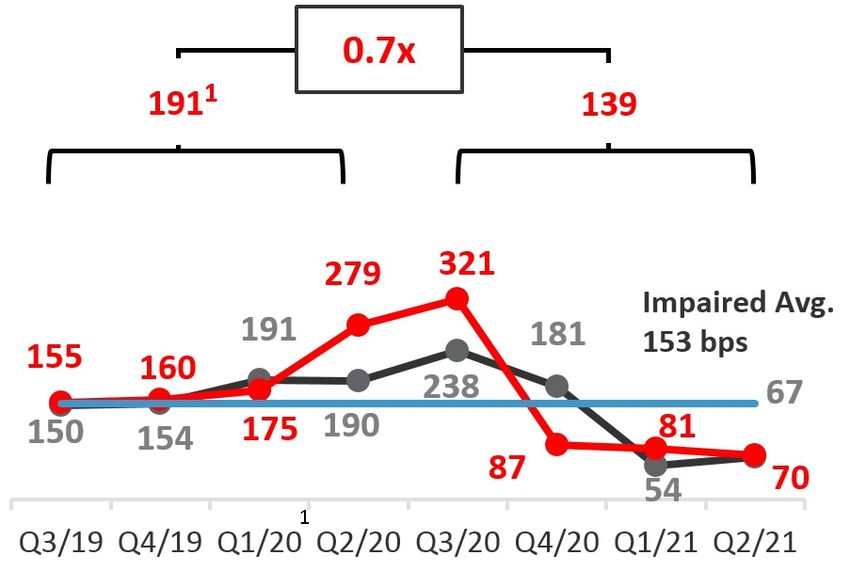
Strong Capital Position
            CET1 ratio of 12.3%

            • CET1 ratio +140 bps Y/Y, +10 bps Q/Q
            • Strong internal capital generation partly offset by solid growth in RWA (+$6 billion) from business lending and
              retail mortgages, excluding the negative impact from foreign currency translation
            • Pension remeasurement benefit – increased discount rate
            • Q3/21 impact of ~25 bps – increase in SVaR multiplier and increased ownership in Scotiabank Chile

1   Includes ~ 14 bps benefit from OSFI’s partial inclusion of stage 1 and 2 allowances
                                                                                                                                6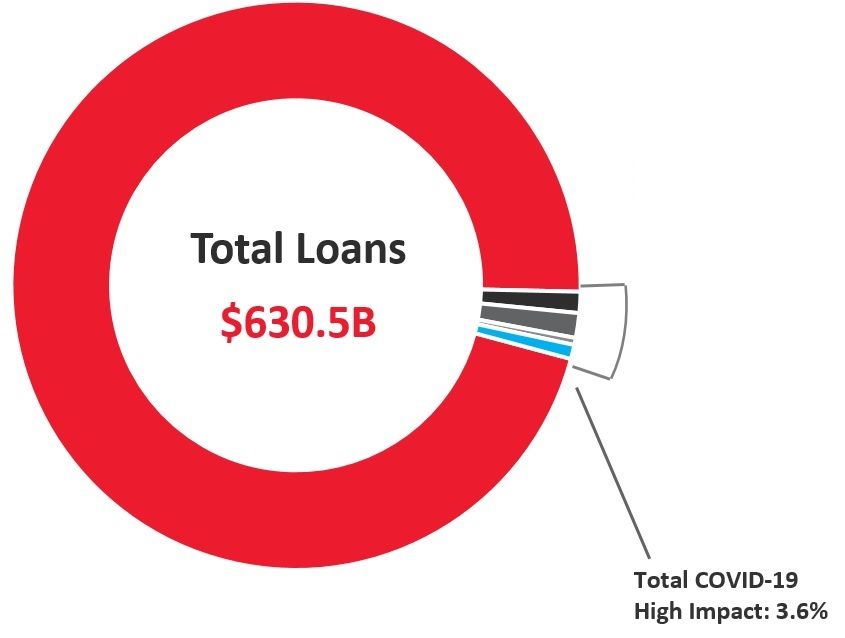
Canadian Banking
                        $MM                                   Q2/21                Y/Y                 Q/Q                   YEAR-OVER-YEAR HIGHLIGHTS
 Reported                                                                                                       •   Adjusted net income1,3 +94% (+2% Q/Q)
                              Net         Income1             $927                  95%                 2%
                                                                                                                     o Pre-Tax, Pre-Provision profit +7%
              Pre-Tax, Pre-Provision Profit                  $1,395                  7%                (3%)
                                  Revenue                    $2,624                  4%                (1%)
                                                                                                                     o PCLs down 78% from improving credit quality and
                                 Expenses                    $1,229                  1%                 2%
                                                                                                                       macroeconomic outlook
                                     PCLs                     $145                 (78%)              (32%)     •   Revenue +4% (-1% Q/Q)
                        Productivity Ratio                   46.8%              (150 bps)            130 bps         o Non-interest income up 20% as fee income rebounded
                       Net Interest Margin                   2.26%                (7 bps)                -             alongside an improving economy and transaction volumes
                                PCL Ratio2                   16 bps              (61 bps)            (7 bps)         o Net interest income down 1% due to lower margins
             PCL Ratio on Impaired Loans2                    27 bps               (9 bps)             4 bps
                                                                                                                •   Adjusted expenses3 +1%
 Adjusted3
                              Net Income1                     $931                 94%                  2%      •   YTD adjusted operating leverage3 +1.6%
              Pre-Tax, Pre-Provision Profit                  $1,400                 7%                 (3%)     •   Loan growth of +4%
                                 Expenses                    $1,224                 1%                  2%          o Residential mortgages +8%
                        Productivity Ratio                   46.6%              (150 bps)            130 bps
                                                                                                                    o Business loans +4%
                                                                                                                •   Deposit growth of +17%
                                                                                                                    o Personal +11%, Non-personal +31%
                                                                                                                •   NIM -7 bps (flat Q/Q)
                                                                                                                    o Changes in business mix and Bank of Canada rate cuts
                                                                                                                                                  1,3
                                                                                                                      ADJUSTED NET INCOME ($MM) AND NIM (%)

1 Attributableto equity holders of the Bank
2 Includes provision for credit losses on certain assets – loans, acceptances and off-balance sheet exposures                                                                7
3 Refer to Non-GAAP Measures on slide 37 for adjusted results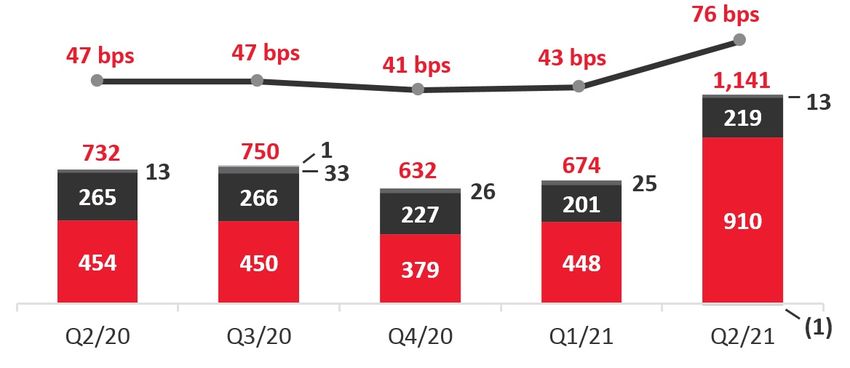
Global Wealth Management
          $MM, except AUM/AUA                                     Q2/21       Y/Y        Q/Q              YEAR-OVER-YEAR HIGHLIGHTS
      Reported                                                                                   •   Adjusted net income2 +21%
                                 Net         Income1               $372       23%       (11%)        o Canadian wealth management +25%
                 Pre-Tax, Pre-Provision Profit                     $506       23%       (12%)
                                     Revenue                      $1,308      16%        (6%)
                                                                                                 •   Revenue +16% driven by:
                                    Expenses                       $802       12%        (2%)        o Higher brokerage fees from elevated iTRADE volumes
                                        PCLs                       ($2)       nmf        nmf         o Higher mutual fund fees
                           Productivity Ratio                     61.3%    (210 bps)   250 bps       o Strong volume growth in Private Banking
                                    AUM ($B)                       $332       19%         6%
                                                                                                 •   Adjusted expenses2 +14% (volume driven)
                                    AUA ($B)                       $571      20%          4%
      Adjusted2                                                                                  •   Adjusted YTD operating leverage2 +5.4%
                                 Net Income1                       $378       21%       (11%)        o Six consecutive quarters of positive operating leverage
                 Pre-Tax, Pre-Provision Profit                     $516       20%       (11%)    •   Adjusted productivity ratio2 improved 130 bps
                                    Expenses                       $792       14%       (2%)     •   AUM +19% and AUA +20%
                           Productivity Ratio                     60.6%    (130 bps)   250 bps
                                                                                                      o Strong net sales and market appreciation

                      AUM                                                     AUA

                                                                                                                                1,2                  2
                                                                                                     ADJUSTED NET INCOME ($MM) AND ROE (%)

1   Attributable to equity holders of the Bank                                                                                                               8
2   Refer to Non-GAAP Measures on slide 37 for adjusted results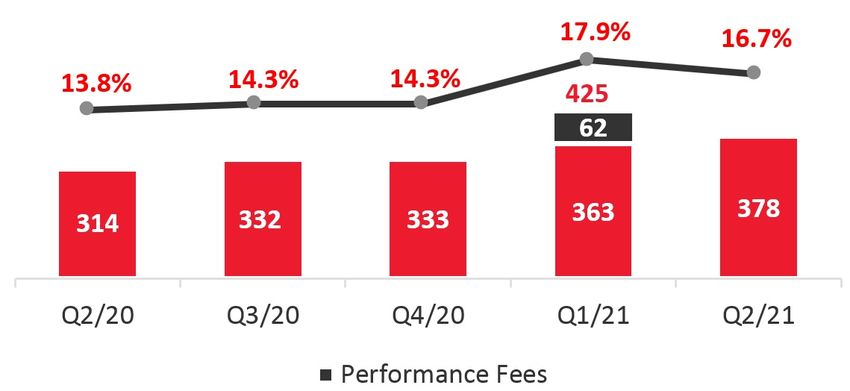
Global Banking and Markets
                             $MM                                  Q2/21                 Y/Y                 Q/Q               YEAR-OVER-YEAR HIGHLIGHTS
      Reported                                                                                                       •   Net income -1%
                                  Net Income1                       $517                 (1%)                (5%)
                                                                                                                          o Lower net income in Capital Markets following the wind-
                  Pre-Tax, Pre-Provision Profit                     $624                (26%)               (14%)
                                                                                                                            down of the metals business, largely offset by a release in
                                      Revenue                      $1,257               (14%)                (6%)           provisions for credit losses.
                                     Expenses                       $633                  3%                  3%
                                         PCLs                       ($43)                nmf                 nmf     •   Revenue -14%
                            Productivity Ratio                     50.3%              810 bps             430 bps         o Net interest income -9%
                                   PCL Ratio2                     (18 bps)            (72 bps)            (26 bps)        o Non-interest income3 -16%
                    PCL Ratio Impaired Loans2                       5 bps              (4 bps)              (1 bp)
                                                                                                                     •   Loan growth, excluding foreign exchange, +1% Q/Q
                                                                                                                     •   Deposits +28%
                                                                                                                     •   Expenses +3%
                                                                                                                     •   Productivity ratio in line with investor day guidance
                                                                                                                     •   PCL ratio2 of -18 bps

                                                                                                                                                      1,3                  3
                                                                                                                         ADJUSTED NET INCOME ($MM) AND ROE (%)

1 Attributable  to equity holders of the Bank
2 Includes   provision for credit losses on certain assets – loans, acceptances and off-balance sheet exposures                                                                    9
3   Refer to Non-GAAP Measures on slide 37 for adjusted results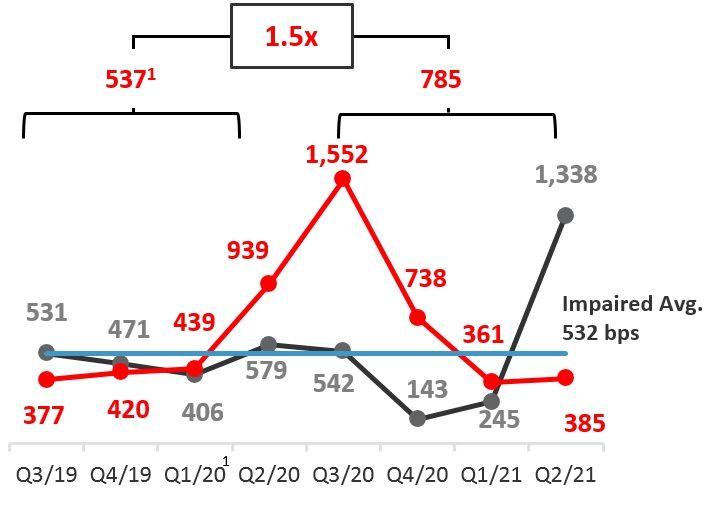
International Banking
                           $MM                                 Q2/21                Y/Y1                Q/Q1                       YEAR-OVER-YEAR HIGHLIGHTS1
    Reported                                                                                                             •   Adjusted net income2,4 +165% (+11% Q/Q)
                                 Net        Income2            $420                203%                  12%
                                                                                                                              o PCLs down 59% supported by improved credit quality
                 Pre-Tax, Pre-Provision Profit                $1,084                (5%)                 (4%)
                                     Revenue                  $2,378                (6%)                 (5%)            •   Revenues down 6% (-5% Q/Q)
                                    Expenses                  $1,294                (6%)                 (5%)                 o Lower non-interest income and margin compression
                                        PCLs                   $396                (59%)                (22%)            •   NIM down 33 bps (-8 bps Q/Q)
                           Productivity Ratio                  54.4%               30 bps             (34 bps)                o Business mix changes, impact of liquidity and rate cuts
                          Net Interest Margin                  3.95%              (33 bps)             (8 bps)
                                   PCL Ratio3                 118 bps            (160 bps)            (31 bps)
                                                                                                                         •   Loans down 2% (up 1% Q/Q driven by commercial and
                                                                                                                             mortgages)
                   PCL Ratio Impaired Loans3                  281 bps             136 bps              131 bps
    Adjusted4                                                                                                                 o Pacific Alliance Loan Growth
                                 Net Income2                    $429               165%                  11%                         o Mortgages +8% (+2% Q/Q)
                 Pre-Tax, Pre-Provision Profit                 $1,095               (8%)                (4%)                         o Credit cards and personal loans -10% (-3% Q/Q)
                                    Expenses                   $1,283               (4%)                (5%)                         o Commercial loans -1% (+1% Q/Q)
                                        PCLs                    $396               (59%)               (22%)
                           Productivity Ratio                  53.9%              146 bps             (30 bps)
                                                                                                                         •   Adjusted expenses4 down 4%
                                                                                                                         •   YTD adjusted operative leverage4 of -2.3%
                                                                                                                         •   Q2/21 adjusted PTPP4 down 8% (-4% Q/Q)

                                                                                                                                                         2,4
                                                                                                                             ADJUSTED NET INCOME ($MM) AND NIM (%)

1 Y/Y and Q/Q growth rates (%) are on a constant dollar basis, while metrics and change in bps are on a reported basis
2 Attributableto equity holders of the Bank
3 Includes provision for credit losses on certain assets – loans, acceptances and off-balance sheet exposures
                                                                                                                                                                                      10
4 Refer to Non-GAAP Measures on slide 37 for adjusted results
Other
1, 2, 3
ADJUSTED NET INCOME ($MM) YEAR-OVER-YEAR HIGHLIGHTS
• Increase was driven by:
o Lower expenses, mainly related to the metals
business charge in the prior year
o Higher contribution from asset/liability
management activities
QUARTER-OVER-QUARTER HIGHLIGHTS
• Increase was driven by:
o Lower expenses as a result of the investment in the
SCENE loyalty program in the prior quarter
o Higher investment gains
1 Represents smaller operating segments including Group Treasury and corporate adjustments
2 Attributable to equity holders of the Bank 11
3 Refer to Non-GAAP Measures on slide 37 for adjusted resultsRisk
Review
Daniel Moore
Group Head & CRO
12Credit Quality
GILs1 ($MM) AND GIL RATIO1 HIGHLIGHTS
• GIL ratio improved 3 bps Q/Q driven by the impact of
foreign currency translation and higher write-offs in
International Retail Banking
• GILs in Business Banking were stable, with new
formations driven mainly by two accounts
NET WRITE-OFFS ($MM)2 AND NET WRITE-OFFS RATIO2,3 HIGHLIGHTS
• Increased write-offs driven by International Retail
Banking
• Business Banking write-offs were stable and trending
towards pre-pandemic levels
• Peak quarter for write-offs
1 As a percentage of period end loans and acceptances
2 Net write-offs are net of recoveries
3 As a percentage of average net loans and acceptances
13Credit Performance
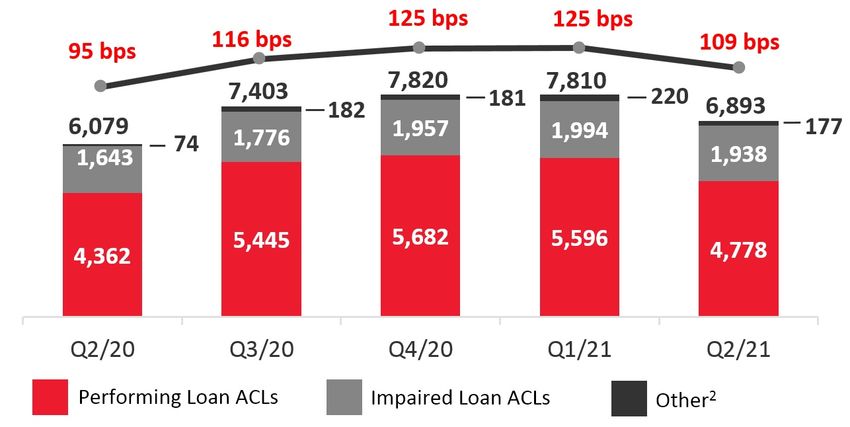
TOTAL ACLs ($MM) AND ACL COVERAGE RATIO1 HIGHLIGHTS
• $6.9 billion in total ACLs (35% above pre-pandemic
levels)
• Performing loan ACLs decreased 15% from the
prior quarter
• Total ACLs represents ~10 quarters of net write-
offs
• Total ACL coverage ratio of 109 bps
TOTAL PCLs ($MM)3,4 AND PCL RATIO HIGHLIGHTS
• Total PCL ratio of 33 bps decreased 86 bps Y/Y
and 16 bps Q/Q
• The Q/Q improvement was driven mainly by
performing ACL releases due to a more favourable
credit quality and macroeconomic outlook and
migration to Stage 3 PCL
1 ACL coverage ratio defined as period end ACLs divided by gross loans
2 Includes ACLs on off-balance sheet exposures and ACLs on acceptances, debt securities and deposits with financial institutions
3 Includes provision for credit losses on debt securities and deposit with banks in International Banking (Q1/20: -$1 million, Q2/20: $1 million, Q4/20: -$1 million), in Global Banking and Markets (Q3/20: $1 million,
Q4/20: -$1 million), in Global Wealth Management (Q3/20: -$1 million) and in Other (Q1/20: $1 million , Q2/20: -$2 million, Q4/20: $2 million) 14
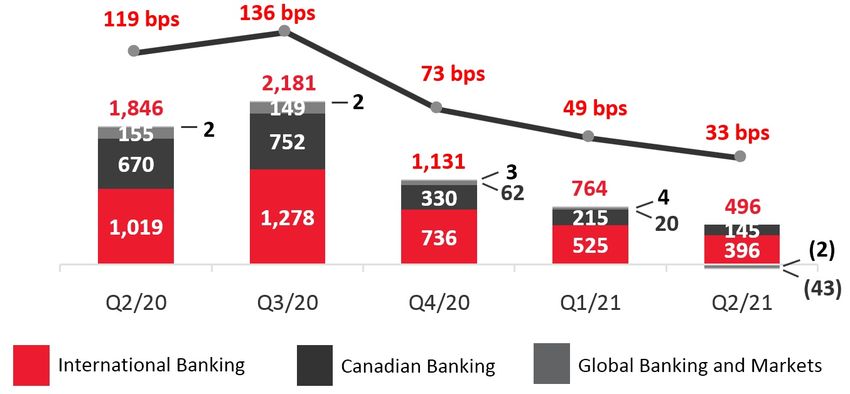
4 Other includes provisions for credit losses in Global Wealth Management of -$2 million (Q2/20: $2 million, Q3/20: $1 million, Q4/20: $3 million, Q1/21: $4 million)PCLs - Impaired and Performing
HIGHLIGHTS
PCLs ($MM) Q2/20 Q3/20 Q4/20 Q1/21 Q2/21
All-Bank YEAR-OVER-YEAR
Impaired 870 928 835 762 1,192
• Lower PCLs driven mainly by lower performing PCLs.
Performing 9761 1,2531 2961 2 (696) Total PCLs of $496 million was down 73% and 35%
Total 1,8461 2,1811 1,1311 764 496 Q/Q
Canadian Banking
o Performing PCLs net reversal of $696 million
Impaired 313 317 238 214 242
Performing 357 435 92 1 (97) o Release driven by a more favourable credit
Total 670 752 330 215 145 quality and macroeconomic outlook and
migration
International Banking
Impaired 531 573 561 528 941 o Impaired PCLs of $1,192 million was driven
largely by International Retail Banking due to
Performing 4881 705 1751 (3) (545)
expiring deferrals
Total 1,0191 1,278 7361 525 396
Global Wealth Management QUARTER-OVER-QUARTER
Impaired 1 - 1 5 (3) • Impaired PCLs increased $430 million, driven largely
Performing 1 11 2 (1) 1 by International Retail Banking
Total 2 11 3 4 (2) • Performing PCLs declined $698 million due to the
Global Banking and Markets more favourable credit quality and macroeconomic
outlook and migration to stage 3 PCL to support
Impaired 25 38 34 15 12
higher write-offs
Performing 130 1111 281 5 (55)
Total 155 1491 621 20 (43)
Other -1 1 -1 - -
1Includes provision for credit losses on debt securities and deposit with banks in International Banking (Q1/20: -$1 million, Q2/20: $1 million, Q4/20: -$1 million), in Global Banking and
Markets (Q3/20: $1 million, Q4/20: -$1 million), in Global Wealth Management (Q3/20: -$1 million) and in Other (Q1/20: $1 million , Q2/20: -$2 million, Q4/20: $2 million) 15Improving economic outlook
Closing Similar trends across core markets
Remarks Strong gains in digital banking
Brian Porter
President & CEO Positive factors support growth in
Pacific Alliance:
- 6.5% GDP growth in 2021
- Strong balance sheets
- Rising commodity prices
16Appendix
17Digital Progress: All-Bank
• Canada: Continued growth in self-serve transactions driven by higher mobile and online usage
• Pacific Alliance: Significant mobile user growth across all geographies, particularly in Peru and Mexico
Digital Adoption (%)1
Active Digital
Users (#’000)
Active Mobile
Users (#’000)2
Digital Sales (%)
Self-Serve
Transactions
(%)3
1 CB Digital Adoption definition was updated in Q1/21 to reflect new addressable customer base, excluding indirect-channel acquisitions
2 2018 and 2019 use historical estimation based on available mobile user data for Colombia and Chile
3 Prior periods from 2018 to 2020 have been restated in Q2/21 to align with current methodology
18Digital Progress: Canada
Digital Adoption (%)1
Active Digital
Users (#’000)
Active Mobile
Users (#’000)
Digital Sales (%)
Self-Serve
Transactions
(%)
Definitions
Digital Sales (% of retail unit sales using Digital platforms, excluding auto, broker originated mortgages and mutual funds)
Digital Adoption (% of customers with Digital login (90 days) / Total addressable Customer Base)
Digital Users: # of customers who logged into website and/or mobile in the last 90 days
Mobile Users: # of customers who logged into mobile in the last 90 days
Self-serve Transactions: % of Financial transactions through Digital, ABM, IVR
1 CB Digital Adoption definition was updated in Q1/21 to reflect addressable customer base, excluding indirect-channel acquisitions 19Digital Progress: Pacific Alliance
Digital Adoption (%)
Active Digital
Users (#’000)
Active Mobile
Users (#’000)1
Digital Sales (%)
Self-Serve
Transactions
(%)2
Definitions
Digital Sales (% of retail unit sales using Digital platforms)
Digital Adoption (% of customers with Digital login (90 days) / Total addressable Customer Base)
Digital Users: # of customers who logged into website and/or mobile in the last 90 days
Mobile Users: # of customers who logged into mobile in the last 90 days
Self-serve Transactions: % of Financial transactions through Digital, ABM, IVR, POS
1 2018
2 Prior
and 2019 use historical estimation based on available mobile user data for Colombia and Chile 20
periods from 2018 to 2020 have been restated in Q2/21 to align with current methodologyEconomic Outlook in Core Markets
Real GDP Growth Forecast (2021–2022)
Real GDP (Annual % Change)
Forecast1, 2
2010–19
Country 2020 2021 2022
Average
Q1E Q2F Q3F Q4F Year Q1F Q2F Q3F Q4F Year
Canada 2.2 -5.4 0.2 14.0 6.8 5.6 6.4 5.0 5.0 3.5 3.1 4.1
U.S. 2.3 -3.5 0.3 12.3 7.0 7.5 6.6 6.8 5.3 3.3 2.1 4.3
Mexico 2.7 -8.2 -3.8 15.9 4.7 2.9 4.9 2.7 3.3 1.4 1.2 2.2
Peru 4.5 -11.1 3.2 30.1 5.3 2.2 8.7 1.4 5.9 5.0 3.7 4.0
Chile 3.3 -5.8 0.3 17.1 10.8 4.0 7.5 3.8 3.2 3.1 4.0 3.5
Colombia 3.7 -6.8 1.1 12.1 5.7 1.1 5.0 4.2 3.9 3.8 4.2 4.0
PAC Average3 3.6 -8.0 0.2 18.8 6.6 2.6 6.5 3.0 4.1 3.3 3.3 3.4
Source: Scotiabank Economics
1 Forecasts for Canada and U.S. as of the April 22, 2021 - Scotiabank Global Forecast Tables
21
2 Forecasts for PAC countries as of the May 21, 2021 - Scotiabank Latam Weekly
3 Simple averageMacroeconomic Scenarios
Select Macroeconomic Variables used to estimate Expected Credit Losses
Alternative Scenario - Alternative Scenario - Alternative Scenario –
Base Case Scenario
Optimistic Pessimistic Pessimistic Front Loaded
As at As at As at As at As at As at As at As at
Next 12 months
April 30, 2021 January 31, 2021 April 30, 2021 January 31, 2021 April 30, 2021 January 31, 2021 April 30, 2021 January 31, 2021
Canada
Real GDP growth, Y/Y % change 7.8 4.6 9.9 6.5 2.8 -0.6 -3.5 -6.8
Unemployment rate, average % 6.7 7.9 6.1 7.4 9.3 10.1 12.2 13.0
US
Real GDP growth, Y/Y % change 8.2 4.3 10.3 5.7 4.8 0.9 0.9 -2.9
Unemployment rate, average % 5.0 6.2 4.5 5.8 6.7 7.4 8.0 8.7
Global
WTI oil price, average USD/bbl 62 48 70 54 54 41 50 38
Quarterly breakdown of the projections for the above macroeconomic variables:
Base Case Scenario
Calendar Quarters Average Calendar Quarters Average
Q2 Q3 Q4 Q1 April 30 Q1 Q2 Q3 Q4 January 31
Next 12 months 2021 2021
2021 2021 2021 2022 2021 2021 2021 2021
Canada
Real GDP growth, Y/Y % change 14.1 6.6 5.3 5.2 7.8 -2.2 11.8 4.2 4.6 4.6
Unemployment rate, average % 7.7 7.0 6.4 5.9 6.7 8.4 8.2 7.7 7.3 7.9
US
Real GDP growth, Y/Y % change 11.8 6.6 7.3 7.0 8.2 -1.2 10.1 3.8 4.3 4.3
Unemployment rate, average % 5.8 5.3 4.8 4.2 5.0 6.1 6.1 6.2 6.3 6.2
Global
WTI oil price, average USD/bbl 60 61 65 61 62 44 47 49 52 48
Source: Scotiabank Economics, forecasts as of March 10, 2021 22Revenue Growth
Canadian Banking International Banking1, 2, 3
Global Wealth Management Global Banking and Markets4
1 May not add due to rounding
2 Y/Y growth rates are on a constant dollar basis
3 Excluding impact of divestitures and on a constant dollar basis, revenue growth in international banking was -5% Y/Y (Latin America -5%, C&CA -8%, Asia -4%)
4 GBM LatAm revenue contribution and assets are reported in International Banking’s results 23Deposit Growth
Canadian Banking International Banking1,2,3
Global Banking and Markets3 Global Wealth Management
1 May not add due to rounding
2 Y/Y growth rates are on a constant dollar
3 Includes deposits from banks
4 Average deposits declined 7% Y/Y on a reported basis. Excluding impact of divestitures and on a constant dollar basis, deposits declined 1% Y/Y
24
5 Excluding impact of divestitures and on a constant currency basis, non-personal deposits declined 5% Y/Y and personal deposits increased 7% Y/YHistorical PCL Ratios on Impaired Loans
1
ALL BANK
1
CANADIAN BANKING
1
INTERNATIONAL BANKING
1 Provision for credit losses on certain assets – loans, acceptances and off-balance sheet exposures
25Canadian Retail: Loans and Provisions 1
MORTGAGES AUTO LOANS
LINES OF CREDIT2 CREDIT CARDS
Loan Balances Q2/21 Mortgages Auto Loans Lines of Credit2 Credit Cards Total
Spot ($B) $257 $39 $32 $6 $3353
% Secured 100% 100% 64% 2% 94%4
1 Includes Wealth Management. PCL excludes impact of additional pessimistic scenario
2 Includes Home Equity Lines of Credit and Unsecured Lines of Credit
3 Includes Tangerine balances of $6 billion and other smaller portfolios 26
4 82% secured by real estate; 12% secured by automotiveInternational Retail: Loans and Provisions
MEXICO CHILE CARIBBEAN & CA
Markets with
Greater
Weighting to
Secured
Markets with PERU COLOMBIA
Greater
Weighting to
Unsecured
• Higher impaired PCLs in Peru
and Colombia are driven by
the expiry of deferral
programs and the higher
unsecured balances. This has
been appropriately provided
for in prior quarters.
Loan Balances Q2/21 Mexico Peru Chile Colombia Caribbean & CA Total3
Secured ($B) $10 $3 $21 $2 $8 $45
Unsecured ($B) $2 $5 $5 $4 $3 $19
Spot Total ($B) $12 $8 $26 $6 $11 $64
1 PCL excludes impact of additional pessimistic scenario
2 Excludes impact of divested operations
3 Total includes other smaller portfolios
27International Banking: Pacific Alliance
1,2,3
FINANCIAL PERFORMANCE AND METRICS ($MM)
Q2/21 Q1/21 Q2/20 Q/Q Y/Y
Revenue ($MM) 1,709 1,882 1,899 (7%) (5%)
Expenses ($MM) 807 861 880 (4%) (5%)
PTPP ($MM) 902 1,020 1,019 (9%) (6%)
Net Income1 ($MM) 358 358 170 2% 146%
NIM 4.04% 4.17% 4.32% (13 bps) (29 bps)
Productivity Ratio 47.2% 45.8% 46.3% 144 bps 88 bps
GEOGRAPHIC DISTRIBUTION4,5
1 Attributable to equity holders of the Bank
2 Y/Y and Q/Q growth rates (%) are on a constant dollar basis, while metrics and change in bps are on a reported basis
3 Refer to Non-GAAP Measures on slide 37 for adjusted results
4 For the 3 months ended April 30, 2021 28
5 May not add due to roundingRetail 90+ Days Past Due Loans
CANADA1 Q2/202 Q3/202 Q4/202 Q1/212 Q2/212
Mortgages 0.21% 0.19% 0.15% 0.17% 0.16%
Personal Loans 0.72% 0.63% 0.51% 0.54% 0.51%
Credit Cards 1.12% 0.81% 0.70% 0.98% 0.75%
Secured and Unsecured Lines of Credit 0.26% 0.23% 0.19% 0.22% 0.18%
Total 0.30% 0.26% 0.21% 0.23% 0.21%
INTERNATIONAL Q2/202 Q3/202 Q4/202 Q1/212 Q2/212
Mortgages 3.05% 2.94% 2.70% 2.76% 2.67%
Personal Loans 4.04% 4.02% 4.19% 5.79% 5.29%
Credit Cards 3.35% 2.72% 2.61% 7.08% 5.83%
Total 3.36% 3.18% 3.05% 4.05% 3.69%
1 Includes Wealth Management
29
2 Does not reflect impact of payment deferral programsSectors Most Impacted by COVID-191
Most Impacted Sectors as a % of Total Loans Real Estate:
Office and Retail
$B %IG
Office REIT 1.1 70%
Office Real Estate 3.7 52%
Retail REIT 1.0 100%
Retail Real Estate 2.9 43%
Total2 8.8 57%
Hospitality and Leisure
Energy – E&P and
$B %IG
Oilfield Services: 1.1% Hotels 3.6 17%
Real Estate – Office
Cruise Lines 0.3 0%
and Retail: 1.4%
Transportation – Air Gaming 0.7 0%
Travel: 0.4%
Total2 4.6 13%
Hospitality and
Leisure: 0.7%
Transportation:
Air Travel
$B %IG
Aircraft Finance 0.7 98%
Airlines 0.3 4%
Airports 1.2 48%
1 Sectors which have experienced the greatest disruption in normal business activities and impact to
revenue due to the COVID-19 pandemic (including, but not limited to, government-mandated closures) Total2 $2.2 59%
relative to other sectors
2 May not add due to rounding 30COVID-19 Response in Core Markets
United
Canada Mexico Peru Chile Colombia
Policy Action States
Policy Rate Cuts1 150 bps 150 bps 300 bps 200 bps 125 bps 250 bps
(Since March 1, 2020)
Fiscal
& Financial Measures 17.5% 22.3% 0.7% 20.0%2 17.5%2 2.8%
(% of GDP)
Liquidity program
Wage and payroll
support programs
-
Selected
Key Payment deferral
Measures programs
Small business and
sectoral programs
Vaccine Coverage3 794% 416% 123% 173% 253% 60%
(% of possible population covered)
Vaccine Deployment4 44.79 79.14 17.05 6.86 84.99 13.46
(Vaccine doses administered per 100 people)
COVID-19 Incidence Rate4
(Cumulative confirmed cases per 100k people) 3,483 9,914 1,839 5,658 6,594 5,992
Sources: Scotiabank Economics, Duke University, Johns Hopkins University, Our World in Data and national reports as of May 12, 2021, unless otherwise indicated
1 As of May 12, 2021
2 Includes pension withdrawals and deposit relief
3 Internationally comparable Duke University data adjusted for national reports; excludes doses via COVAX
31
4 As of May 12, 2021. Source: Our World in DataTrading Results
TRADING REVENUE
ZERO TRADING LOSS DAYS (Q2/21) AND ONE-DAY TOTAL VAR (Q2/21)
32Net Income and Adjusted Diluted EPS
Net Income ($MM) and
Q2/20 Q1/21 Q2/21
EPS ($ per share) Quarterly diluted common shares
1 outstanding may be impacted by dilutive
Net Income attributable to common shareholders $1,243 $2,265 $2,289
effect of put options sold by the bank in the
Dilutive impact of share-based payment options following legal entities:
($22) $41 $13
and others
- Colpatria
Net Income attributable to common shareholders
$1,221 $2,306 $2,302 - BBVA Chile
(diluted)
- Canadian Tire Financial Services
Weighted average number of common shares
1,212 1,212 1,213
outstanding
Dilutive impact of share-based payment options
1
10 25 10
and others
Weighted average number of diluted common
1,222 1,237 1,223
shares outstanding
Reported Basic EPS $1.03 $1.87 $1.89
Dilutive impact of share-based payment options
($0.03) ($0.01) ($0.01)
and others
Reported Diluted EPS $1.00 $1.86 $1.88
Impact of adjustments on diluted earnings per
$0.04 $0.02 $0.02
share1
Adjusted Diluted EPS $1.04 $1.88 $1.90
1 Refer to Non-GAAP Measures on Slide 37 for adjusted results 33Adjusting Items – Pre-Tax
Adjusting Items (Pre-Tax) ($MM) Q2/20 Q1/21 Q2/21
Acquisition-Related Costs
Integration Costs 41 - -
International Banking 33 - -
Global Wealth Management 8 - -
1
Amortization of Intangibles 27 28 26
Canadian Banking 6 6 5
International Banking 12 13 11
Global Wealth Management 9 9 10
Total (Pre-Tax) 68 28 26
34
1 Excludes amortization of intangibles related to software (pre-tax)Adjusting Items – After-Tax and NCI
Q2/21
After-Tax
Adjusting Items (After-Tax and NCI) ($MM) Q2/20 Q1/21 Tax NCI
and NCI
Acquisition-Related Costs
Integration Costs 20 - - - -
International Banking 15 - - - -
Global Wealth Management 5 - - - -
1
Amortization of Intangibles 20 20 7 - 19
Canadian Banking 4 4 1 - 4
International Banking 9 9 2 - 9
Global Wealth Management 7 7 4 - 6
Total (After-Tax and NCI) 40 20 7 - 19
35
1 Excludes amortization of intangibles related to software (after-tax)Other Items Impacting Financial Results
1
(Pre-Tax) ($MM) Q2/20 Q3/20 Q4/20 Q1/21 Q2/21
International Banking
Impact of closed divestitures (1) 1 3 4 -
Total (1) 1 3 4 -
Global Wealth Management
Performance fees - - - 84 -
Total - - - 84 -
Other
Metals business charges (217) - - - -
SCENE loyalty program - - - (66) -
Total (217) - - (66) -
Total (Pre-Tax) (217) 1 3 18 -
1
(After-Tax and NCI) ($MM) Q2/20 Q3/20 Q4/20 Q1/21 Q2/21
International Banking
Impact of closed divestitures (3) - 2 3 (1)
Total (3) - 2 3 (1)
Global Wealth Management
Performance fees - - - 62 -
Total - - - 62 -
Other
Metals business charges (212) - - - -
SCENE loyalty program - - - (49) -
Total (212) - - (49) -
Total (After-Tax and NCI) (215) - 2 12 (1)
Impact on diluted earnings per share ($0.18) - - $0.01 -
Prior periods have been restated to conform with current presentation 36
1 Items on this page have not been formally adjusted for determining the Bank’s Adjusted Net Income and Adjusted Diluted EPSNon-GAAP Measures
The Bank uses a number of financial measures to assess its performance. Some of these measures are not calculated in accordance with
Generally Accepted Accounting Principles (GAAP), which are based on International Financial Reporting Standards (IFRS) as issued by the
International Accounting Standards Board (IASB), are not defined by GAAP and do not have standardized meanings that would ensure
consistency and comparability among companies using these measures. The Bank believes that certain non-GAAP measures are useful in
assessing ongoing business performance and provide readers with a better understanding of how management assesses performance. These
non-GAAP measures are used throughout this report and defined below.
Adjusted results and diluted earnings per share
The following table presents reconciliations of GAAP Reported financial results to non-GAAP Adjusted financial results.
The adjustments summarized below are consistent with those described in the Bank’s 2020 Annual Report. For a complete description of the
adjustments, refer to the Non-GAAP Measures section in the Bank’s 2020 Annual Report:
Adjustments impacting current and prior periods:
• Amortization of acquisition-related intangible assets, excluding software
Adjustments impacting prior periods only:
• Acquisition and divestiture-related costs – Include costs related to integrating acquired operations and net (gain)/loss on divestitures
• Valuation-related adjustments, recorded in Q1 2020 – Relate to the inclusion of an additional scenario in the measurement of
allowance for credit losses, fair value methodology change relating to uncollateralized OTC derivatives, and a software-related
impairment loss
37Investor Sophia Saeed, Vice-President
416-933-8869
Relations sophia.saeed@scotiabank.com
Contact Mark Michalski, Director
Information 416-866-6905
mark.michalski@scotiabank.com
Rene Lo, Director
416-866-6124
rene.lo@scotiabank.com
38You can also read