Is Ireland really the most prosperous country in Europe? - Patrick Honohan Vol 2021, No. 1 - Better Regulation
←
→
Page content transcription
If your browser does not render page correctly, please read the page content below

Is Ireland really the most
 prosperous country in Europe?
 Patrick Honohan
 Vol 2021, No. 1

T: +353 (0)1 224 6000
E: patrick.honohan@gmail.com
www.centralbank.ie             February 2021
Is Ireland really the most prosperous country in Europe? Central Bank of Ireland Page 1 Is Ireland really the most prosperous country in Europe? Patrick Honohan The well-known distortions affecting Ireland’s GDP complicate international comparisons. Ireland is a prosperous country, but per capita GDP data mislead by placing it second only to Luxembourg in the EU. Other measures, such as the Human Development Index, are also marred. Modified data provide an indication of the extent of the re-ranking that it is warranted. Most people know that Ireland is not really the most prosperous economy in Europe. Yet, if we ignore the small city state of Luxembourg, Ireland has the highest GDP per head, even adjusted for differences in price levels. So whereabouts does Ireland really rank in terms of average economic prosperity? Of course, no single indicator like GDP can really give an adequate answer to such a question. Any serious study will want to take account of multiple dimensions on social and environmental indicators, such as are targeted in the Sustainable Development Goals of the United Nations. Still, it is extremely common for a single indicator to be used in international league tables, and when it is, either Gross Domestic Product (GDP) or Gross National Income (GNI) is usually the measure used, despite well-known deficiencies in these as measures of wellbeing. Even when alternative single number measures are used, such as the UNDP’s Human Development Index, it is generally a composite in which GDP or GNI has a large weight. It is not straightforward even to compare GDP across countries, because of the widely differing pattern of relative prices (and different preferences) that prevails in different countries. Each country’s GDP needs to be adjusted for these cross-country price differences. A major data collection exercise has been conducted at six yearly – now moving to three-yearly – intervals to Patrick Honohan was Governor of the Central Bank of Ireland from 2009 to 2015. He is an Honorary Professor of Economics at Trinity College Dublin and a Non-resident Senior Fellow at the Peterson Institute for International Economics. The views expressed in this paper are those of the author only and do not necessarily reflect the views of the Central Bank of Ireland. Patrick.Honohan@gmail.com.
Is Ireland really the most prosperous country in Europe?   Central Bank of Ireland   Page 2

enable this price adjustment (known as purchasing power parity); the latest
data (for 2017) was recently published by the World Bank.

In these latest statistics Ireland’s per capita GDP comes in at fifth highest of
the 182 countries in the data, or third (after Qatar and Singapore) if we
exclude countries with population of less than half a million – and first in
Europe.

Although Ireland’s economy has stalled again in the pandemic recession, its
GDP has probably done better in 2020 than most other advanced economies.
This will consolidate Ireland’s apparent GDP leadership position in Europe.

This seeming strength is largely due to the continued increase in exports of
pharmaceuticals and IT generated by multinational corporations
(MNCs/MNEs) and masks the sharp collapse in employment and economic
activity in most sectors.

But anyone who has been following the Irish economy is well aware that
there are acute shortcomings of GDP as a measure of economic welfare
especially because of the activities of multinationals.

So, this first-in-class ranking is clearly misleading. Where, then, could Ireland
be more accurately ranked? When we dig into the available data in the more
relevant parts of per capita income and consumption, we find that Ireland’s
relative international position is somewhere between 8th and 12th in the
European Union – a lot lower than is commonly presumed. The lower ranking
comes not only from removing the distortions from multinationals but also
from taking account of the fact that consumer prices in Ireland are relatively
high.

Distortions from the activities of foreign Multi-
National Corporations
The large profits being reported by foreign multinational corporations
(MNCs) have tended to flatter Irish GDP growth rates for years. But most of
these profits were attributable to foreign parents. They did not distort
another standard international measure, GNI, where the N stands for
National, and which accordingly excludes profits going to foreign owners.

But two other large and even more volatile distortions induced by the
activities of multinationals have grown substantially in recent years. These
affect GNI as well as GDP. The biggest of these distortions relates to the very
large capital assets owned by multinationals operating in Ireland. Some of
these are intellectual property (IP) assets (such as patents) of information
technology companies; the large aircraft fleets of resident leasing companies
are also relevant. It is not that the acquisition of these assets from abroad
contributes to GDP; it does not. But once acquired, the depreciation of the
Is Ireland really the most prosperous country in Europe?   Central Bank of Ireland   Page 3

assets must be included in GDP and GNI, because depreciation is exactly
what the G (for Gross) means. It was the jump in depreciation during 2015,
following MNC decisions to move a large block of IP into the ownership of
resident affiliates, that led to the 26 per cent GDP growth rate in that year.

The other GNI distortion relates to multinationals that have re-domiciled (i.e.
moved their global headquarters) to Ireland, despite having little domestic
economic activity in Ireland. Their undistributed profits – which already
exceeded 5 per cent of GNI in 2012 before falling back somewhat – are also
included in GNI even though their shareholders are mostly non-resident.

In order to help in analysis of the Irish macroeconomy, a special measure,
GNI*, which excludes these distorting factors, has been calculated by the
Central Statistics Office (2016).1 In 2019, GNI* was about 40 per cent below
the level of GDP, whereas GDP and GNI are about equal in most countries.
The available data for GNI* now goes back to 1995, when the modified series
was already 8 per cent lower than GDP. If we simply substitute this modified
series for GDP (or GNI) to make an international comparison we find that
Ireland in 2019 was not in second place in the EU (behind Luxembourg) but
instead appears in eighth place. That is a somewhat crude procedure, but it
indicates the scale of the adjustment that needs to be made. Ireland is not
even in the top quarter of EU countries, when the comparison is made in this
way.

But that is not all.

    Figure 1 | Ireland’s Rank Among the 28 Countries of the 2019 EU, using
    GDP and Actual Individual Consumption at Purchasing Power Parities,
    but substituting GNI* for Ireland’s GDP.

1
 GNI* subtracts from GNI factor income (mainly profits) of re-domiciled companies,
depreciation on aircraft leasing and on imported intellectual property (R&D service
imports and trade in IP); Lane (2017) describes the components of GNI* in detail.
Note that there is no subtraction for IP produced in Ireland by MNCs.
Is Ireland really the most prosperous country in Europe? Central Bank of Ireland Page 4
Ireland's rank in EU28
1 GDP/GNI* per head
3
Consumption (AIC) per
5
head
7
9
11
13
15
Source: Author’s calculations based on Central Statistics Office, Ireland and Eurostat
“Actual individual consumption”
An alternative aggregate national indicator of household welfare used in
international comparisons is known as “actual individual consumption” (AIC).
This measure is part of GDP; in essence it adds together consumption by
households and consumption spending by government on individual services
such as healthcare, education and housing. AIC does not include collective
government spending (such as that on defence, policing, debt service and the
like), nor does it include capital formation (spending on X), whether by
households, government or businesses. So it is far from being a
comprehensive characterization of the macroeconomy. On average across
the world, AIC includes about two-thirds of GDP, but the ratio varies widely.
Still, if one is going to use one of these available national data series as a
rough measure of current living standards of households, AIC, adjusted for
price differentials across countries, seems a good option..
The international data collection exercise mentioned above, leading to
purchasing power parities, does present AIC data adjusted for those
differences in international prices. Ireland ranks less high on this measure.2
Ireland’s AIC rank in the EU28, having jumped from 11th in the late 1990s to
6th in 2007, fell precipitously to 14th in 2009, after which it recovered, but
only to 12th place by 2019. On this measure, then, Ireland falls behind not
only the UK but all six of the original founder members of the EEC, along with
Austria and the three Nordic member states.
Indeed, Ireland’s AIC per capita is only about 95 per cent of the EU average,
down from 115 per cent in 2006-7. No wonder many questioned the quality
and extent of economic recovery even before the pandemic hit. Of course
2
Ireland’s AIC represented 58.3% of GDP in 2011; 40.3% in 2017.Is Ireland really the most prosperous country in Europe? Central Bank of Ireland Page 5 growth in per capita consumption resumed, cumulatively totalling 15 per cent in the five years 2014-9, but other countries were growing also. Several factors have diverted some of the national economic recovery away from consumption. Part of the reduction reflects the fact that government borrowing had to be reined in: Government net saving, boosted by a sizable increase in taxation, has increased substantially. Household saving is also somewhat higher now than it was before the 2008 crisis. These savings have, of course, strengthened the ability of households to cope with the financial consequences of the pandemic. But an additional factor only becomes evident when we look at differences in the average level of prices for consumption in Ireland and elsewhere. Although, thanks to the weakness of sterling since the Brexit referendum, Irish prices in 2019 were only about 10 per cent higher than those in the UK, much larger differences emerge from a wider comparison with the euro area (where exchange rate movements are not a distracting factor). While Irish prices (as collected for the international comparisons) were about equal to the average of those in the other euro area countries when the ECB was founded in 1998, they rose progressively to 27 per cent higher than the average by 2008. Although they subsequently fell back (to about 16 per cent above the euro area average by 2012), Irish prices then resumed their acceleration relative to other euro area countries and were back around their previous peak by 2019 (largely due to the surge in the price of housing as measured in the PPP). No wonder returning emigrants find Ireland expensive – and not just for housing. The wider world What about Ireland in the wider world? The International Comparison Program, on which most of these consumption and price indicators ultimately depend, has been running now for several decades and data is available going back to 1950.3 Ireland’s position relative to the US moved little for the first four decades, and indeed it fell relative to the average of the main countries in Western Europe as they recovered from war into the “three glorious 3 For more than 20 years, the ICP has been managed by the World Bank, which has produced comprehensive updates for the benchmark years 2005, 2011 and 2017. Earlier years were covered by a team based at the University of Pennsylvania; their Penn World Tables (PWT), which draw on the same underlying price data but use somewhat different approach to the calculation of purchasing power parities, and interpolate between benchmark years, run to 2017, but have not yet been updated with the 2017 benchmark price data. Eurostat and the OECD also calculate PPPs on a slightly different basis; their data series runs from 1995 to 2019. As an indication that the difference matter little for Ireland, AIC (GDP) relative to US=100 for 2017 was 59.9 (130.5) for PWT; 59.9 (130.4) for ICP; 59.7 (129.6) in Eurostat. For 2011 the figures were 60.4 (88.5); 61.9 (90.1) and 61.8 (90.0). The methodological differences are discussed in Neary (2004) and Deaton and Heston (2011). See also Honohan (2020).
Is Ireland really the most prosperous country in Europe?   Central Bank of Ireland   Page 6

decades”. Taking the US as a reference point and again concentrating on the
AIC per person consumption measure (adjusted for purchasing power) we
find that Ireland began at about 47 per cent of the US level in 1950; the same
figure was recorded in 1993. There had been just a brief few years 1978-81
when unsustainable borrowing enabled Irish consumption levels to exceed
50 per cent of the US benchmark. After 1993, though, there was a steady
increase to 68 per cent (by 2007) before the borrowing binge of the early
2000s came to an end, after which the ratio came down to 60 per cent. At
this level, Ireland’s average per capita consumption ranks 21 in the world
(ignoring countries of less than a million population). Ahead of Ireland are the
EU countries mentioned above as well as Norway and Switzerland, along with
four “Anglo” countries (US, Canada, Australia and New Zealand), and four
jurisdictions in East Asia (Hong Kong, Japan, Singapore and Taiwan). Spain,
Cyprus and a handful of Gulf oil-producing countries have been ahead of
Ireland from time to time in recent years, but not at the latest data.

 Figure 2 | Actual Individual Consumption per Capita: Ireland Relative to
 Average of Main Western European Countries (AT, BE, CH, DE, DK, ES, FI,
 FR, IT, GB, NL, NO, SE), 1950-2019.

  Ratio of Ireland AIC to Western Europe AIC
 1.05
 1.00
 0.95
 0.90
 0.85
 0.80
 0.75
 0.70
 0.65
 0.60
        1950
        1953
        1956
        1959
        1962
        1965
        1968
        1971
        1974
        1977
        1980
        1983
        1986
        1989
        1992
        1995
        1998
        2001
        2004
        2007
        2010
        2013
        2016

 Source: Penn World Tables.

Human Development Index
As mentioned, many other single number measures of economic performance
are also contaminated by the distortions induced by the activities of
Is Ireland really the most prosperous country in Europe? Central Bank of Ireland Page 7
multinationals, because among the ingredients in the formula generating
such measures we typically find either GDP or GNI. A prime example is the
UNDP’s Human Development Index (HDI), which combines income with
health and education indicators. In the 2020 HDI Ireland ranks second in the
world, behind Norway. But here too the MNC-distortion matters, as the ICP
numbers for GNI are also used in the HDI. Scaling down GNI by the ratio of
GNI* to GNI (0.759 in the relevant year) reduces Ireland’s HDI score and
moves Ireland down the global ranking from second to ninth place.4 A similar
effect applies to the Inequality-adjusted HDI and the Gender Development
Index.5
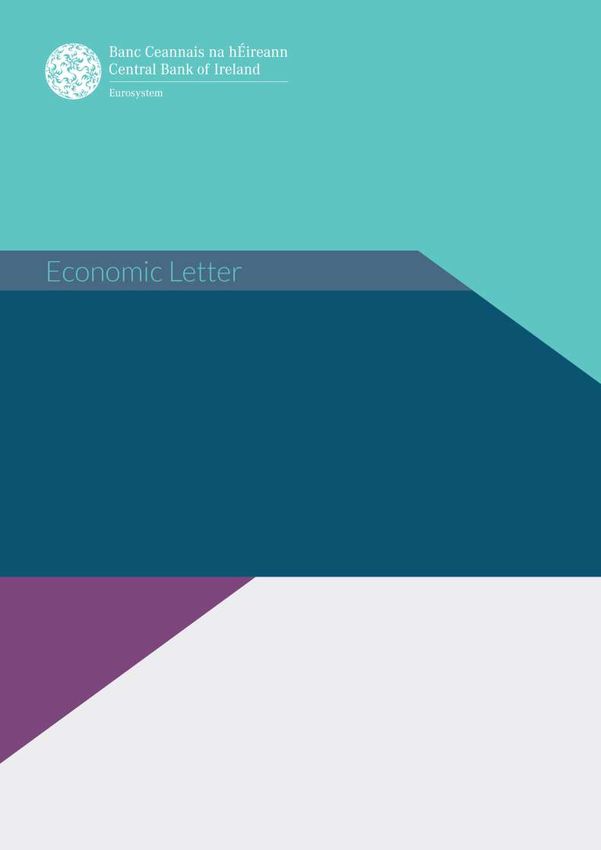
Figure 3 | Actual Individual Consumption per Head in 2017 for the 25 Countries
with Populations of over One Million, Index Measured at Purchasing Power
Parities with United States = 100.
United States
Hong Kong SAR, China
Norway
Switzerland
Germany
Australia
Austria
Canada
United Kingdom
Denmark
Belgium
Singapore
Netherlands
Finland
Sweden
France
Taiwan, China
Italy
New Zealand
Japan
Ireland
Cyprus
United Arab Emirates
Spain
Saudi Arabia
0 20 40 60 80 100
AIC per head @ PPP US=100
Source: World Bank (ICP 2017 index.xslx)
4
Using the formula set out in the 2019 Human Development Report technical note.
5
Though not to the Multidimensional Poverty Index which is published with the HDI.Is Ireland really the most prosperous country in Europe? Central Bank of Ireland Page 8 Conclusion Ireland is a prosperous country, but not as prosperous as is often thought because of the inappropriate use of misleading, albeit conventional statistics. There is less consumption per capita than in the United Kingdom, and on this metric we are closer to New Zealand, Israel and Italy, than to the United States, Switzerland or Norway (which is where the GDP comparison would put Ireland). The same conclusion is drawn if GDP is replaced with the Ireland-specific GNI* indicator. Using GDP as a measure can mislead analysis of such matters as debt, carbon-intensity and inequality. References Central Statistics Office. 2016. Report of the Economic Statistics Review Group, Coyle, Diane. 2014. GDP: A Brief but Affectionate History. (Princeton University Press). Deaton, Angus. 2020. “Why the World’s Richest Countries Are Not All Rich.” Financial Times. October 5. Deaton, Angus and Alan Heston. 2010. “Understanding PPPs and PPP-based National Accounts.” American Economic Journal: Macroeconomics. 2(4):1-35. Fitz Gerald, John. 2018. “National Accounts for a Global Economy: the Case of Ireland.” Quarterly Economic Commentary (Dublin: Economic and Social Research Institute). Honohan, Patrick. 2020. “Using Purchasing Power Parities to Compare Countries: Strengths and Shortcomings.” Peterson Institute for International Economics Policy Brief 20-16. Lane, Phillip. 2017. “The Treatment of Global Firms in National Accounts.” Economic Letter Series, Central Bank of Ireland, Vol. 2017, No. 1. Neary, J. Peter. 2004. “Rationalizing the Penn World Table: True Multilateral Indices for International Comparisons of Real Income.” American Economic Review. 94(5): 1411-28.
T: +353 (0)1 224 6000
E: patrick.honohan@gmail.com
www.centralbank.ie
You can also read