EXPERIMENTAL DETERMINATION OF THE ZERO POWER TRANSFER FUNCTION OF THE AKR-2
←
→
Page content transcription
If your browser does not render page correctly, please read the page content below
EPJ Web of Conferences 247, 21009 (2021)                                                               https://doi.org/10.1051/epjconf/202124721009
PHYSOR2020

                   EXPERIMENTAL DETERMINATION OF THE ZERO POWER
                          TRANSFER FUNCTION OF THE AKR-2

                                         Sebastian Hübner1, Alexander Knospe1,
                                  Marco Viebach1, Carsten Lange1, and Antonio Hurtado1
                                           1
                                            Technische Universität Dresden (TU Dresden)
                                                         01062 Dresden

                       sebastian.huebner@tu-dresden.de, alexander.knospe@tu-dresden.de,
            marco.viebach@tu-dresden.de, carsten.lange@tu-dresden.de, antonio.hurtado@tu-dresden.de

                                                                   ABSTRACT

                 The transfer function is a basic characteristic of every nuclear reactor. It describes how a
                 perturbation at a given place and time influences the neutron flux. In case of a known
                 perturbation, the determination of characteristic reactor parameters is possible. The present
                 paper shows an experimental method to determine the gain of the zero-power reactor transfer
                 function (ZPTF) of the AKR-2 reactor at TU Dresden and the comparison to the theoretical
                 shape of the ZPTF derived from kinetic parameters simulated with MCNP. For the experiments,
                 a high-precision linear motor axis is used to insert an oscillating perturbation acting at
                 frequencies smaller than the lower bound of the plateau region of the ZPTF. For higher
                 frequencies, a rotating absorber is used. This device emulates an absorber of variable strength.
                 The reactor response is detected with a He-3 counter.
                 The data evaluation shows good agreement between measured and corresponding theoretical
                 values of the gain of the ZPTF.

         KEYWORDS: transfer function, zero-power reactor, noise analysis, training reactor, MCNP simulation

                                                            1. INTRODUCTION

         The transfer function is a basic characteristic of every nuclear reactor. It describes how a perturbation at a
         given place and time influences the reactor’s state variables [1]. The concept of a transfer function is reliably
         applicable as long as the system’s behavior can be approximated by a linear time-invariant dynamical
         system. The knowledge of the transfer function may allow determining the type of the perturbation from
         the measurements of the induced fluctuations of the neutron flux or, in case the perturbation is known, the
         determination of characteristic reactor parameters [2]. The determination of the reactor transfer functions
         has been performed since the early days of reactor research [3]. Nevertheless, in current safety research,
         the inversion of the transfer function as a method of incident detection is of particular interest [4].
         In this context, the gain of the transfer function of the AKR-2 reactor at TU Dresden is experimentally
         determined by use of a vibrating absorber and an absorber of variable strength. Since thermal feedback
         effects in the AKR-2 core can be neglected during normal operation, the AKR-2 can be assumed to be a
         zero-power reactor. Moreover, the dynamical behavior of the AKR-2 can be described by the point-kinetic
         approximation. In such conditions, the transfer function is determined by the zero power transfer function
         (ZPTF), with the applied perturbation converted into its reactivity effect. For the experiments, a high-
         precision linear motor axis is used to insert an oscillating perturbation acting at frequencies smaller than

  © The Authors, published by EDP Sciences. This is an open access article distributed under the terms of the Creative Commons Attribution License 4.0
  (http://creativecommons.org/licenses/by/4.0/).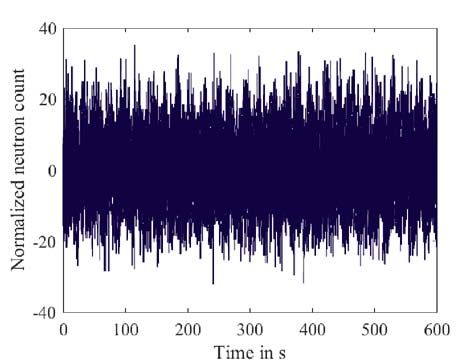
EPJ Web of Conferences 247, 21009 (2021)                                                   https://doi.org/10.1051/epjconf/202124721009
PHYSOR2020

         the lower bound of the plateau region of the ZPTF. For higher frequencies, a rotating absorber is used. This
         device emulates an absorber of variable strength. The reactor response is detected with a He-3 counter
         placed inside the reactor. Using this setup, the gain of the ZPTF of the AKR-2 is measured through the
         analysis of the input signals (movement of the absorber) and the output signals (induced fluctuations in
         neutron flux). For an assessment of the measured ZPTF, it is compared with the theoretical shape of the
         ZPTF derived from kinetic parameters that were simulated with an MCNP model of the reactor.
         Based on the knowledge of the ZPTF, the investigation of neutron flux fluctuations using the same
         experimental setup will be possible in the future. Conceivable research fields could be the generation of
         high-precision data with a high level of fidelity for the validation of computer codes, inducing one or more
         perturbations. Additionally, a direct evaluation of unknown cross sections of different materials with the
         pile-oscillator method would be possible.

                               2. THEORY OF ZERO POWER TRANSFER FUNCTION

         The transfer function () describes the transfer behavior of a system, which reacts to an input signal
         replying with a corresponding output signal in the frequency domain. For a nuclear reactor, the input signal
         is a reactivity deviation that leads to a local or global deviation of the reactor’s state variables. As for a zero
         power reactor thermal and other feedback effects are neglected. Input and output are coupled just with the
         ZPTF [5]. The input signal is a deviation of the reactivity (), which leads to a change in the neutron flux
         (). This transfer is coupled via the transfer function ().
         Mathematical description of the ZPTF is derived from the point kinetic approximation. The derivation is
         widely described in many publications [1,2]. The following formulation is the transfer function in frequency
         domain:


                                            () =                                .                                      (1)
                                                      +
                                                                           +

         Where  is the fraction of delayed neutrons,  is the decay constant of the precursors, both for the i-th group
         of precursors, and l the generation time of the prompt neutrons. The initial neutron number ( ) is
         commonly used as normalization factor. The gain of the ZPTF is represented by the absolute value of ().
         For a sinusoidal perturbation is  = .

                                 3. DESCRIPTION OF THE EXPERIMENTAL SETUP

         The experiments to determine the ZPTF were carried out at the AKR-2 reactor with experimental equipment
         that was developed in the context of the European project CORTEX [4] for the validation of simulation
         tools. The low frequency range (0.05 Hz to 1 Hz) was examined with a vibrating absorber and the higher
         frequencies (0.5 Hz to 12 Hz) with an absorber of variable strength. In the following, the reactor is briefly
         introduced, as well as the two different experimental setups.

         3.1. The AKR-2 reactor

         The AKR-2 reactor [6], located at TU Dresden, is a thermal, zero-power reactor with an allowed maximum
         thermal power of 2 W. It is used mainly for training and teaching purposes, and additionally for research.
         The core has cylindrical shape with a diameter of 250 mm and a height of 275 mm. The disk-shaped fuel
         elements consist of a homogeneous dispersion of polyethylene moderator and uranium oxide, which is
         enriched to 19.8 %. For security reasons the core is separable, whereas the lower half is movable. For the
         basic start-up procedure, the core halves are brought together. The operation is controlled via three control
         and safety rods installed next to the fuel zone, consisting of cadmium sheets on polyethylene blocks. A
         graphite reflector with approx. 32 cm thickness surrounds the core. The biological shield consists of two

                                                                 2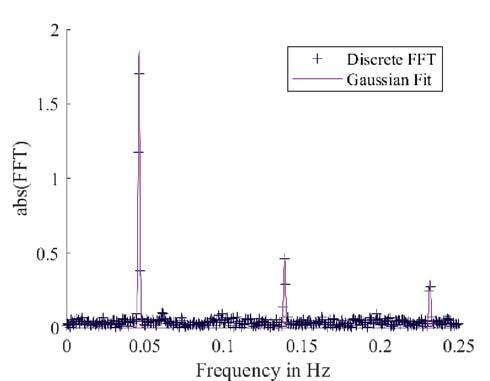
EPJ Web of Conferences 247, 21009 (2021) https://doi.org/10.1051/epjconf/202124721009
PHYSOR2020
cylindrical walls of 15 cm and 58 cm thickness, made of paraffin and heavy concrete. The reactor is
accessible through seven horizontal and two vertical experimental channels. The setup of the AKR-2 is
illustrated in Figure 1.
Figure 1. Vertical and horizontal cross section of the AKR-2.
3.2. Vibrating absorber
The vibrating absorber triggers a repetitive perturbation in the reactor. For the AKR-2 this is realized with
the help of a linear motor axis that moves a shaft containing a cadmium absorber within the experimental
channel 1-2. The absorber is a cadmium cylinder with a diameter of 12.7 mm and a height of 1.016 mm. It
consist of 99.9656 % natural cadmium and minor impurities of other metals. The setup can be seen in
Figure 2 a). The linear motor axis can effect different motion profiles with a maximum amplitude of
15.5 cm with a positioning accuracy of 10 m and a repositioning accuracy of 10 m. Because of safety
limitations of the driver software of the axis, a repeatable motion profile can only be guaranteed up to a
frequency of 1 Hz. Frequencies lower than realized in the shown experiments are not possible due to the
reactor response, which would exceed the reactor’s safety (power) margins. For the experiments, a
rectangular motion shape was chosen with an amplitude of 2 cm (between 7 cm and 11 cm from core
center). This assures the movement of the absorber inside a zone with a linear decrease of the neutron flux,
resulting in a linear transfer of the reactivity perturbation. The induced reactivity over the absorber position
is shown in Figure 2 b). The reactivity difference between the maximum and the minimum position of the
absorber is 0.055 $. The reactivity influence over the movement path was determined via compensation-
method with help of one the control and safety rods. The movement of the axis is controlled and recorded
by the programmable logic controller of the linear motor axis via an absolute position encoder.
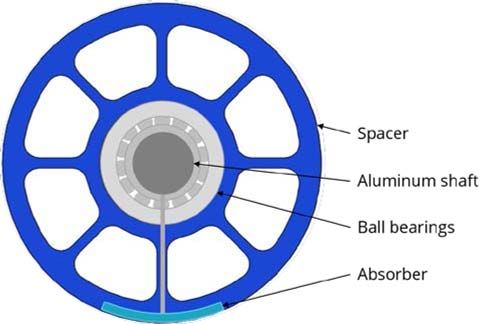
3.3. Absorber of variable strength
The absorber of variable strength inserts a local reactivity perturbation. For the AKR-2, this is realized with
the help of an absorber, rotating in the experimental channel 3-4 and driven by a stepper motor. The absorber
is a bent rectangular cadmium sheet with size of 25 cm x 2 cm x 0.02 cm with a bending and rotation radius
of 2.98 cm. The largest dimension is parallel to the experimental channel. The material of the absorber is
natural cadmium with unknown impurities.
3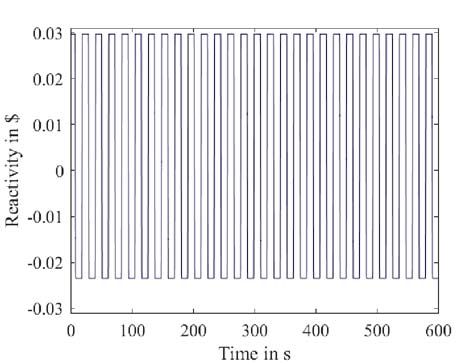
EPJ Web of Conferences 247, 21009 (2021)                                              https://doi.org/10.1051/epjconf/202124721009
PHYSOR2020

          a)                                                       b)

                       Figure 2. a) Schematic and b) Reactivity influence of the vibrating absorber.

         The stepper motor induces a motion profile with a constant angular velocity. Frequencies range from 1 Hz
         to 12 Hz. The perturbation is started in the position closest to the ground level (as can be seen in Figure 3
         a). This position is referenced as angle 0°. The movement starts towards the reactor core. The difference of
         the minimum and maximum reactivity of a whole repetition of the absorber is 0.011 $. The reactivity
         influence was determined in the same way as the one for the other absorber type. The reactivity over the
         angle is illustrated in Figure 3 b). In the present case, it was not possible to track the movement of the
         stepper-motor. This led to the assumption of a continuous movement with constant angular velocity, which
         was checked by a time control for the lower frequencies and a sound noise analysis for the higher
         frequencies.

          a)                                                       b)

                Figure 3. a) Schematic and b) Reactivity influence of the absorber of variable strength.

                                                              4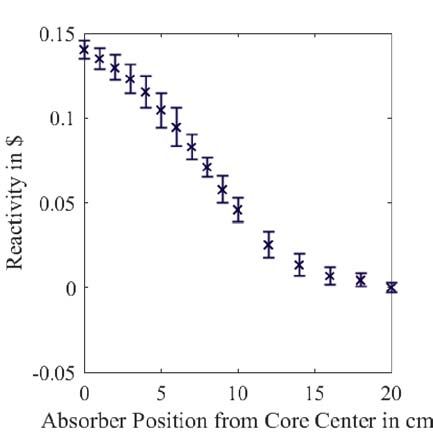
EPJ Web of Conferences 247, 21009 (2021)                                                 https://doi.org/10.1051/epjconf/202124721009
PHYSOR2020

         3.4. Measurement setup with detector position

         The used detector was a He-3 counter in pulse mode operation. The volume of the effective, helium-filled
         zone was determined via computed tomography: V = 12.441 cm3 (+ 0.638 cm3 / – 0.181 cm3). The signal
         was amplified and then recorded with an ORTEC multi-channel-scaler. The position of the detector and of
         the perturbations during the experiments is shown in Figure 4.

                        Figure 4. Partial cross section of the AKR-2 with the experimental setup:
            Cross section mesh-up of three cross sections of the AKR-2 (-8 cm, 0 cm, +8 cm in vertical direction,
            regarding the core center). The experimental channels 1, 3, 5 can be seen as well as the location of
            the detector (dark blue) and the perturbation locations (light blue). The vibrating absorber is located
            in channel 1, the absorber of variable strength in channel 3 and the detector in channel 5.

                                      4. MEASUREMENTS AND DATA ANALYSIS

         The measurements were performed at four different days with a displayed power for each measurement of
         1.5 W. The chosen perturbation frequencies range from 0.01 Hz and 12 Hz. For an assessment of the
         uncertainties of the measurement, experiments were repeated for some of the chosen frequencies.
         The input signals for the analysis of the transfer function are the reactivity influences of the absorbers. They
         are obtained by adjusting the recorded motion profiles with the measured reactivity influence information
         in reference to the absorber positions (compare Figure 2 b) and Figure 3 b).
         The output signals are the recorded neutron counts. With limited time for each measurement, it was difficult
         to always obtain a perfect critical state before starting the recording. To control whether the critical state is
         reached, the decay of the majority of the precursors has to be waited for after a movement of the control
         and safety rods. In case of a decrease or an increase of the reactor power, the reactor state has to be adjusted
         recursively. This would have exceeded the available measurement time. To overcome this challenge, for
         each measurement, the baseline of the recorded output data was fitted with a polynomial of second order.
         Subsequently, the fit curve was subtracted from the signal. The fits represent the increase or decrease of the
         power due the influence of the precursors with the larger half-life. The concentration of these precursors
         are not influenced by the relatively high frequencies of the current experiment. The applicability of this
         method on the decay of precursors was shown for pile-oscillator experiments [7].

                                                                5
EPJ Web of Conferences 247, 21009 (2021)                                             https://doi.org/10.1051/epjconf/202124721009
PHYSOR2020

          a)                                                  b)

          c)                                                  d)

             Figure 5. a)-d) Signal example for measurement with vibrating absorber with perturbation
                                                 frequency of 0.05Hz:
          Input signal (a) with corresponding discrete FFT with Gaussian peak fits (b) and output signal with
          corresponding (c) discrete FFT with Gaussian peak fits (d).

         A Fast Fourier Transform (FFT) transfered both, input and output data separately, to the frequency domain.
         The FFT was performed using a periodic Hamming window [8]. The main peaks for every frequency
         domain data set were identified and fitted with a Gaussian peak function in an automated manner. The peak
         heights in frequency domain are an equivalent representation of the amplitude of the signals of the input
         and of the output, respectively. This assumption is reliable, as the peak shapes are not overlapping. The
         described method is illustrated in Figure 5 showing an example measurement analysis of the vibrating
         absorber at a perturbation frequency of 0.05 Hz.
         The ratio of the peak height value of the output signal in frequency domain to the peak height value of the
         input signal in frequency domain is the gain of the ZPTF for the given frequency.
         The errors of each measurement point are just evaluated with the standard deviations of the fit functions.
         Failures of the data acquisition system, the absorber movement, and the determination of the reactivity
         influences via the compensation method are neglected, because these errors are an order of magnitude lower
         than the errors of the fit functions. An assessment of this assumption is shown in [9].

                                                             6
EPJ Web of Conferences 247, 21009 (2021)                                                  https://doi.org/10.1051/epjconf/202124721009
PHYSOR2020

                                       Table I. Simulated precursor parameters:
           Precursor group fractions ( ), fraction of all precursor groups ( ) and corresponding lifetimes ( )
                           with standard deviation (Std. dev.) derived from MCNP calculations.
                                   Group of                                                    Std. dev.
                                                                Std. dev.
                                   precursor                                     in s-1          in s-1
                                       1           0.00027         0.00001     0.01334         0.00001
                                           2       0.00137         0.00002     0.03273         0.00001
                                           3       0.00133         0.00002     0.12079         0.00001
                                           4       0.00296         0.00003     0.30293         0.00001
                                           5       0.00123         0.00002     0.85011         0.00001
                                           6       0.00050         0.00001     2.85508         0.00003
                                      Sum          0.00766         0.00004         -               -

         The reactor kinetic parameters were determined with an MCNP 6.0 [10] model of the AKR-2 and the
         ENDF/B-VIII.0 data library [11] for six groups of precursors. Where  = 57.2956  10 s with a
         standard deviation of 8.50  10 s. The other parameters can be seen in Table I.
         The measurements including the error-bars and the theoretical shape of the ZPTF derived by the simulation
         can be seen in Figure 6. The larger errors for the absorber of variable strength in comparison with the
         vibrating absorber result from the comparably small reactivity effect of the absorber of variable strength.
         In future measurements, using larger output signal lengths, can reduce the errors.

                   Figure 6. Comparison of the measurements and the theoretical shape of the ZPTF.

                                                               7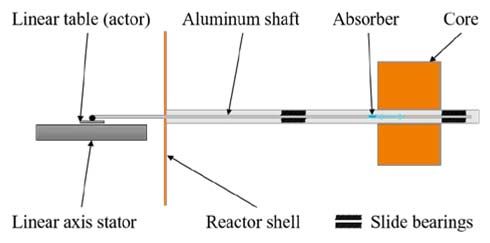
EPJ Web of Conferences 247, 21009 (2021)                                                 https://doi.org/10.1051/epjconf/202124721009
PHYSOR2020

         Over all, a good agreement of the theoretical shape of the ZPTF and the measurement data can be stated.
         For a final proof of the used methods, it would be useful to extend the frequency range to frequencies up to
         100 Hz, to observe the reactor’s behavior on frequencies higher than the upper bound of the plateau region
         of the ZPTF. It is also necessary to install a position encoder at the drive of the absorber of variable strength
         to reduce the error of the corresponding measurement points. This will also allow the investigation of the
         phase of the ZPTF, assuming a timely tied data acquisition of input and output signals.

                                                     5. CONCLUSIONS

         The gain of the ZPTF of the AKR-2 was experimentally determined. Two absorbers of different kinds were
         used in overlapping frequency ranges. The measured data was analyzed with the help of discrete FFT. The
         obtained data was compared with the theoretical shape of the ZPTF, derived with the help of MCNP
         generated kinetic reactor parameters. The applicability of the used experimental setups could be shown
         within some limitations. For future experiments, a broadening of the used frequency range should be
         applied. A synchronized recording of the input and output signals would enable the evaluation of the phase
         of the ZPTF.

                                                  ACKNOWLEDGMENTS

         The authors want to thank L. Beyer, M. Fussan and M. Krautz from the Institute of Complex Materials,
         Leibniz IFW Dresden for the CT of the detector. The research leading to these results has received funding
         from the Euratom research and training program 2014-2018 under grant agreement No 754316.

                                                        REFERENCES

         1. D. L. Hetrick, Dynamics of Nuclear Reactors, Chapter 3, The University of Chicago Press, Chicago
             and London (1971).
         2. I. Pázsit and C. Demazière, “Noise Techniques in Nuclear Systems,” in Handbook of Nuclear
             Engineering, D. G. Cacuci, Ed. Boston, MA: Springer US, pp. 1629–1737 (2010).
         3. J.M. Harrer, R.E. Boyar and D. Krucoff, Measurements of CP-2 Reactor Transfer Function, Argonne
             National Laboratory, Chicago (1952).
         4. C. Demazière, P. Vinai, M. Hursin, S. Kollias, and J. Herb, “Overview of the CORTEX project,” in
             Proceedings of PHYSOR 2018, pp. 2971–2980 (2018).
         5. R. Schröder, Zum kinetischen Verhalten des BER, Report, p. 8, Hahn-Meitner-Institut für
             Kernforschung, Berlin (1964).
         6. B. Boehmer, M. Grantz, W. Hansen, D. Hinke, J. Konheiser, H.-C. Mehner, K. Noack, R. Schneider, I.
             Stephan and S. Unholzer, “Investigation of Gamma and Neutron Energy Fluences in Iron-Water
             Benchmark Configurations for the Verification of Monte Carlo Calculations and their Application in
             Reactor Material Dosimetry,” J. Nucl. Sci. Technol., vol. 39, no. sup2, pp. 947–950 (2002).
         7. P. S. Christensen, A Description of the Pile Oscillators at DR 1, Technical report, The Danish Atomic
             Energy Comission Research Establishment Risö (1966).
         8. “Mathworks MatLab,” https://de.mathworks.com/help/signal/ref/hamming.html (2019).
         9. S. Hübner, Neuauslegung, Inbetriebnahme und Test eines Pile-Oszillators für den AKR-2, Thesis, TU
             Dresden, Dresden (2018).
         10. T. Goorley, et al., “Initial MCNP6 Release Overview”, Nuclear Technology, vol. 180, pp 298-315
             (2012).
         11. D.A. Brown et al., “ENDF/B-VIII.0: The 8th Major Release of the Nuclear Reaction Data Library with
             CIELO-project Cross Sections, New Standards and Thermal Scattering Data”, Nuclear Data Sheets,
             vol. 148, pp. 1-142 (2018).

                                                                8
You can also read