OPACITY EMISSION INSPECTION FROM THE EXHAUST PIPE ON DUTY VEHICLES IN BELO HORIZONTE, MINAS GERAIS, BRAZIL.
←
→
Page content transcription
If your browser does not render page correctly, please read the page content below
Proceedings of COBEM 2005                                       18th International Congress of Mechanical Engineering
Copyright © 2005 by ABCM                                        November 6-11, 2005, Ouro Preto, MG

  OPACITY EMISSION INSPECTION FROM THE EXHAUST PIPE ON DUTY
      VEHICLES IN BELO HORIZONTE, MINAS GERAIS, BRAZIL.

Elisete Gomides Dutra
Fundação Estadual de Meio Ambiente de Minas Gerais – FEAM/MG. Av. Prudente de Morais, 1671, Bairro Santa Lúcia, Belo Horizonte
- MG, CEP: 30.380.000. Tel: (31)3298-6445.
E-mail: eliseteg@feam.br.

Ramon Molina Valle
Departamento de Engenharia Mecânica - Universidade Federal de Minas Gerais – UFMG. Av. Avenida Antônio Carlos, 6627, Pampulha,
Belo Horizonte – MG, CEP: 31.270.901. Tel: (31)34995140.
E-mail: Ramon@demec.ufmg.br

Edwan Fernandes Fioravante
Fundação Estadual de Meio Ambiente de Minas Gerais – FEAM/MG. Av. Prudente de Morais, 1671, Bairro Santa Lúcia, Belo Horizonte
- MG, CEP: 30.380.000. Tel: (31)3298-6445.
E-mail: edwanf@feam.br

Luis Roberto D. Chaves
Secretaria Municipal de Meio Ambiente e Saneamento da Prefeitura de Belo Horizonte – SMMAS/PBH. Av. Afonso Pena, 4000, 6º
andar, centro, Belo Horizonte - MG, CEP: 30.110.100. Tel: (31)3277-5207.
E-mail: luis.pbh@terra.com.br

Márcio Cerqueira Batitucci
Empresa de Transporte e Trânsito de Belo Horizonte – BHTRANS. Av. Engenheiro Carlos Goulart, 900, Buritis, Belo
Horizonte – MG, CEP: 30.455.700, Tel: (31) 3379-5735
E-mail: batitucci@pbh.gov.br

Ely Dias Duarte Júnior
Empresa de Transporte e Trânsito de Belo Horizonte – BHTRANS. Av. Engenheiro Carlos Goulart, 900, Buritis, Belo
Horizonte – MG, CEP: 30.455.700, Tel: (31) 3379-5735
E-mail: elyddjunior@ig.com.br

Daniela Aparecida Oliveira
Departamento de Engenharia Mecânica - Universidade Federal de Minas Gerais - UFMG. Av. Avenida Antônio Carlos, 6627,
Pampulha, Belo Horizonte – MG, CEP: 31.270.901. Tel: (31) 34995140.
E-mail: daniap@brfree.com.br

Abstract.

    Opacity inspections were realized at the exhaustion pipe of 200 Diesel heavy vehicles (bus and trucks) of the circulating
fleet in Belo Horizonte, Minas Gerais, Brazil. The inspections were realized following the procedures of evaluation of the
smoke indexes (opacity) of Diesel cycle vehicles in use, by the free acceleration method, according to the Brazilian standard
NBR 13037 and with what was established by the CONAMA Resolution Nº 251 of 1999. This methodology involves at first a
visual inspection, to verify if the vehicle engine shows an irregular functioning, apparent emptying, violation of the sealing
of supply pump, alterations in the exhausting system, in the air admission system, as well as emission of blue smoke; a
rotation test, that is necessary to keep the engine mechanical integrity, and, finally, the opacity test of the exhaustion gas.
From the analyzed sample, the total percentage of disapproval was around 86%, where 8,5% at the visual inspection, 59%
at the measurement tests of maximum rotation and 18,5% at the opacity test. The high percentage of disapproval at the
rotation tests shows that a significant parcel of the fleet on study falls in with an adulterated fuel supply system. The
disapproval at the visual tests and at the opacity tests, totalizes 27%; they can be directly related with general maintenance
state of the vehicles. The operational difficulties for the implementation of the proposed measurement methodology, defined
by the National Council of Environment – CONAMA, are also presented and discussed.
1. Introduction

    The population many times testifies the emission of black smoke above the acceptable limits emitted by Diesel vehicles.
This smoke contributes too much for the high concentration of inhale particles in big urban centers, being the major
responsible for the increase of the death rate and diseases caused by respiratory illness, especially of children and elders.
The pollutants emitted by the exhaustion of the Diesel vehicles are constituted basically of fuel particles that weren’t burned
(soot); however, they can be minimized by an adequate maintenance of the fuel supply system and the exhaustion system of
these vehicles.
    With the objective of the reduction of these indexes and also to stimulate the technological development at the
automotive area, in 1986 the Federal Government instituted the Program of Control of Air Pollution by Automotive
Vehicles – PROCONVE. The actuation of PROCONVE had the objective of controlling the emissions of the new and used
vehicles.
    The control of emissions of atmospheric pollutants by the exhaustion of the new vehicles began in 1986, with National
Council of Environment - CONAMA Resolution Nº 18. The opacity maximum limit of 2.5m-1 was certified for urban bus
manufactured on October 1st 1987 and by other vehicles manufactured on January 1st 1989 (phase 1 of PROCONVE). The
pollutants emission control of exhaust gas started on January first of 1994 with introduction and gradual reduction of the
limits of emission of CO, HC and NOx (phases II, III and IV of PROCONVE). The CONAMA stablished, by the Resolution
Nº 8 of 1993, that since march 1st 1994 all homologation process and Diesel engine certification must include the smoke
index on free acceleration specified by manufacturers, so guarantying the correct engine regulation. Since January 1st of
2000, starting phase IV, it was not more specified a single value for smoke emission maximum limit to these vehicles. Table
1 shows the gradual reduction phase of pollutants emission limits for new duty Diesel cycle vehicles.

                       Table 1 - Pollutants emission limits through exhaust pipe of new duty
                       Diesel cycle vehicles.
                        PROCONVE          Implantation    CO       HC       NOx      Smoke
                           Phases             Date     (g/kWh) (g/kWh) (g/kWh)        (m-1)
                       Phase I             1/10/1987       -         -        -        2,5
                       Phase II            1/01/1994     11,2      2,45    14,40
                       Phase III           1/01/1996      4,9      1,23     9,00
                       Phase IV            1/01/2000      4,0      1,10     7,00        -
                      Source: CONAMA Resolution Nº 8/1993.

    For vehicles in circulation, the PROCONVE established the implantation of the Program I/M – Program of Maintenance
and Inspection of Vehicles in Use by the environment institutes of each state and city, linked to the annual license of
vehicles. The Program I/M consists on maintenance condition inspection of vehicles to guarantee the certificate pollutants
emission levels. The Program I/M for Diesel vehicles involves the smoke index measurement (opacity) in free acceleration
and the comparison of these measurements with the established maximum limits by the National Council of Environment -
CONAMA. For vehicles manufactured until 1995, the maximum limits are established in the CONAMA Resolution Nº 251
of 1999; for vehicles that have been manufactured since 1996, the maximum limits are declared by the manufacturer
(IBAMA, 2005).
    The Environment Foundation of Minas Gerais State – FEAM associated with the City Hall of Belo Horizonte
(Environment and Sanitation Bureau; Transport and Transit Company of Belo Horizonte – BHTRANS) and Federal
University of Minas Gerais State (Mechanical Engineering Department) to obtain technical qualification for measuring
emissions of pollutants. This technical cooperation resulted in the research project “Vehicular Inspection: Qualification and
Initial Evaluation” that has been developed since 2003, measuring the emissions of the circulating fleet of Belo Horizonte.
The partial results of the Diesel heavy vehicles measurements are presented in this article.

2. Methodology

    The inspections are realized following the procedures of measurement of the smoke index (opacity) of used Diesel
heavy vehicles using the method “Free Acceleration”, according to the Brazilian Standard NBR 13037 that was established
by the CONAMA Resolution Nº 251 of 1999. By this resolution, the inspection must be made in three stages: firstly it is
realized the visual inspection to verify if the vehicle engine shows any irregular functioning, apparent emptying, violation of
the sealing of supply pump, alterations in the exhausting system and in the air admission system, as well as emission of blue
smoke (carbon particles, lubricant oil and fuel partially burned). If the vehicle presents some of these irregularities, it will be
reproved at the visual inspection, ending the procedure of inspection.
    For the vehicles approved at the visual inspection, the next test is the measurement of rotation. For measurement of
rotation of low gear and maximum free rotation it is used a sensor of universal type manufactured by MAHA. This sensor
measures the rotation by the noise emitted by the engine. In places where background noise intervenes in the measurement
of rotation, it is used an inductive sensor coupled to the injector tube. Test of rotation is necessary to keep the engine
mechanical integrity. In this test, the normal work temperature of the engine and the normal operation conditions must be
kept. The temperature of engine is measured through oil temperature. The software (developed by NAPRO, 2001, in
accordance with the NBR 13037 and CONAMA Resolution Nº 251 of 1999) registers the angular speed both in slow gear
and in maximum free acceleration. The speed of maximum free acceleration is obtained accelerating the engine slowly until
it reaches the maximum angular speed without load, so certifying the stability of the engine. These two measurements must
be inside the recommended zone by the vehicle manufacturer, respecting a tolerance of ±100 rpm. Otherwise the vehicle
will be reproved. If some abnormality occurs during the engine acceleration, the vehicle will be also reproved.
If the vehicle is approved in both tests (visual and rotation), the last test (opacity) will be realized according to the
Brazilian Standard NBR 13037. This Standard describes the method for measuring the exhausting gas opacity of Diesel
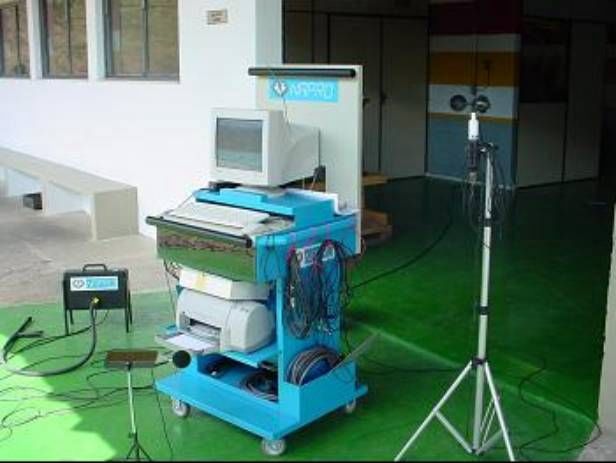
vehicles, in free acceleration, using the opacymeter. The opacymeters of partial flow, LCS2100 model, manufactured by
Sensors, were used. In this procedure, the smoke is collected by a sounding lead of capitation introduced into the exhaust
pipe; this sounding lead conducts this smoke to the opacymeter. The opacymeter, temperature and rotation sensors are
attached to a computer for data acquisition, as showed in Figure 1.
Figure 1 - Photos of equipment with assessorial of mobile and fixed units of vehicular emission inspection.
The opacity test is realized according to the following procedure: the engine in low gear is accelerated in a continuous
and fast way until it reaches the end of the accelerator course, reaching the maximum free rotation. The maximum free
rotation must be held for a maximum of 5 seconds, after that the software will register the opacity value. After the first
measurement, the accelerator will be released and the engine will be stabilized, so the software will request a new
acceleration and will register the second opacity value. The procedure will be repeated 10 times or less and will identify the
maximum value of opacity. At the end, the sounding lead of capture will be taken off from the exhaust pipe to obtain the
zero value of opacity and the test will be validated. The software will discard the first three measurements of opacity, while
the other measurements will be considered valid just when, in four consecutive measurements, the difference between the
maximum and minimum values will not be bigger than 0.25m-1and these measurements can’t have a decreasing order. The
final result is the arithmetic average of the four consecutive values considered valid.
From the Diesel heavy vehicles that circulate in Belo Horizonte, a sample of 200 vehicles was inspected. The results
presented in this article aren’t conclusive since the number of sampled vehicles doesn’t represent the fleet of Diesel heavy
vehicle of Belo Horizonte yet. Currently, Belo Horizonte has a fleet of 32.938 Diesel heavy vehicles registered
(DENATRAN, 2005).
3. Results and analysis
3.1 Definition of the sampling size
Analyzing the results of the inspections of opacity, we decided to group the vehicles into 5 bands of manufacture: until
1987, 1988-1993, 1994-1995, 1996-1999, 2000-2003. These bands were defined by observing the maximum limits of
emission of atmospheric pollutant defined in the CONAMA Resolutions Nº 18 of 1986, Nº 8 of 1993. Until 1987, there
wasn’t exigency in the control of atmospheric pollutant emissions for new heavy vehicles or used vehicles. In the other
bands, the new vehicles must obey the phases of gradual reduction of the emissions limits defined by CONAMA (IBAMA,2004). The objective of these bands of manufacture is to avoid a comparison of the emissions of vehicles produced in very
different conditions of technology.
The size of the sample was defined for each band of manufacture through the Simple Aleatory Sampling Method,
considering the Normal Distribution, level of confidence of 95% and the error of estimation “d”. The sizes of samples were
calculated by the Equation 1 (MINGOTI, 2005) and are shown in the Table 1.
Nσ 2
n= (1)
( N − 1)( d )2 + σ 2
1,96
Where “n” is the size of sample, N is the total number of Diesel heavy vehicles registered in Belo Horizonte, “σ” is the
standard deviation for opacity and “d” is the error of estimation. The value of “N” for each band of manufacture of the
vehicles produced until 2001 was provided by DETRAN/MG in September of 2001, and for the band from 2001 to 2003,
the number of vehicles of the fleet was estimated by the increasing rate of fleet of Minas Gerais (DENATRAN, 2005).
Analyzing the coefficients of variation of the opacity measurements obtained for each band of manufacture, the error of
estimation was defined equal to 20% of the emissions limits established by the CONAMA Resolution Nº 251 of 1999. The
limits of opacity considered have been: 2,5m-1, for all inspected vehicles. Table 2 also shows the total of inspected vehicles
and the inspected vehicles that had opacity measurement on each band of manufacture.
Table 2 – Sample size and number of inspected Diesel heavy vehicles.
Year of Estimated sample size (1) Total of inspected Inspected vehicles that had
Manufacture vehicles (2) opacity measurement
Until 1987 6 72 5
1988 - 1993 53 44 4
1994- 1995 17 26 7
1996 - 1999 20 32 8
2000 - 2003 10 26 18
TOTAL 106 200 42
(1) (2)
Minimum number of vehicles to be inspected with opacity measurement. Total sample, including
vehicles reproved in the two first tests.
The vehicles inspected were manufactured between 1964 and 2003 and 36% of them (72 vehicles) were manufactured until
1987 (before the PROCONVE). These vehicles have different types of engine: 98 vehicles are naturally aspirated, 46 are
turbocharged with LDA and 56 are turbocharged. LDA (Adequacy of the Debited Load) is the system of control of the
bomb of fuel injection for adequacy of its debit for the pressure of feeding of the turbo.
3.2 Results of the visual inspection test
For the 200 analyzed vehicles, 17 were reproved at the visual inspection, especially because they emitted a blue smoke
and apparent emptying, indicating a lack of engine maintenance. In relation to the type of engine, 14 are naturally aspired
and 3 are turbocharged with LDA
3.3 Results of the rotation test
At the rotation tests of maximum free acceleration, the percentage of reproved was more expressive, around 59%. This
disapproval was due to, in most cases; the fact that the engine exceeded the maximum rotation limit because of alteration of
the mechanical injection pump sealing. It is a serious fact that can be punished because the owner didn’t obey the law.
Figure 2 shows the percentage of reproved vehicles in the maximum free rotation test versus the bands of manufacture of
these vehicles.100
90
80
70
Percentage
60
50
40
30
20
10
0
Until 1987 1988-93 1994-95 1996-99 2000-03
Year of Manufacture
Figure 2 - Percentage of reproved vehicles at the maximum
free rotation tests versus the band of manufacture.
The total number of disapproval at the rotation test was 118 vehicles and most of them were reproved because of an
intentional adulteration of the mechanical system of oil supply. This fact doesn’t represent only a deficiency of
maintenance, but mainly a lack of environmental conscience of the owners. It’s important to point out that 71 of these
vehicles are naturally aspired, 38 are turbocharged with LDA and only 9 are turbocharged. These numbers shows that, being
a great part of these vehicles aspired, it is easy to obtain the power gain through the alteration of the pump seal. Figure 1
shows biggest percentages of disapproval for the bands of older vehicles, until 1987 and between 1988 and 1993, being of
approximately 85% and 81%, respectively.
Figure 3 shows the relation between the averages of the maximum free rotation in the rotation test of the reproved
vehicles and the averages of the limits indicated by the manufacturer versus the bands of manufacture. In the realized tests,
there weren’t disapproval due to low gear rotation.
3600
3400
Maximum speed without load
3200
(rpm)
3000
2800
2600
Until 1987 1988-93 1994-95 1996-99 2000-03
Year of Manufacture
Measurement Indication of Manufacturer
Figure 3 - Averages of the maximum free rotations measured
and indicated by the manufacturer.
Figure 3 shows clearly that the older fleet has the higher alterations of maximum free rotation; being responsible by a
bigger production of soot in Diesel motors. The vehicles manufactured after 1994 have a smaller distance between the
averages of measured rotation and the average of the indicated rotation. These results tend to confirm the gain obtained with
the phase P-IV established by PROCONVE for vehicles manufactured since 1994 and the implantation of the electronic
system for Diesel engines.3.4 Results of the opacity tests
The 65 vehicles approved at both visual inspection and rotation test were submitted to the opacity test. Around 57% of
them (37 vehicles) were reproved. Because 23 of them had differences between the measurements bigger than 0.25m-1 or
they were in decreasing order (non valid measurements) and 14 had averages of 4 consecutive measurements bigger than
the maximum limits allowed by the legislation (valid measurements). In this test were considered the maximum limits
correspondents to 2,5m-1, for vehicles with natural aspired engines or turbocharged with LDA, and 2,8m-1 for the vehicles
with turbocharged engines, according to CONAMA Resolution Nº 251 of 1999.
The disapproval in this test is directly related to a lack of maintenance of the vehicles: insufficient cooling system (the
engine doesn’t reach the normal work temperature), obstructed air filter, consumed injector peak or non-regulated, low
pressure at the pump, carbonization in the combustion chamber, and others.
Figure 4 shows the average, maximum and minimum of opacity versus band of manufacture of the 42 vehicles, for which
the measurements of the opacity were considered valid (28 approved and 14 reproved because the measurements of opacity
were over the limit) versus band of manufacture of these vehicles. Practically all the vehicles manufactured from 2001 and
that were submitted to the opacity test have low index of soot. Consequently, they were approved at the opacity test.
7
6
5
Average opacity
4 Minimum
(m )
-1
Maximum
3 Average
2
1
0
Until 1987 1988-93 1994-95 1996-99 2000-03
Year of Manufacture
Figure 4 - Average, maximum and minimum of opacity versus
band of manufacture of the vehicles submitted to the opacity test.
Figure 4 shows a relatively low average of opacity for the first band of year of manufacture (until 1987) and values of
maximum and minimum next to this average. It is important to stand out that of 72 vehicles of this band, 13 vehicles were
reproved in the visual inspection and 50 were reproved in the free maximum rotation. Consequently, the test of the opacity
was only made for 9 of these vehicles. The values of opacity for the bands of the year of manufacture 1988-1993 and 1994-
1995 are bigger than the values of opacity for the first band. These results are not conclusive because for these bands the
number of vehicles with opacity inspection is very inferior to the number necessary to compose the samples. The maximum
and minimum values of the bands: 1988-1993, 1994-1995 and 1996-1999 are relatively distant of the respective averages,
indicating the trend of variation of the measurements of opacity for these vehicles.
Figure 5 shows the relation between the disapprovals at different tests of inspection, showing the total sampled vehicles.
Figure 5 shows clearly that great part of the disapproval due to speed (maximum free rotation), mainly for the first band of
manufacture (50 reproved vehicles between 72 inspected vehicles, i.e., 69% of disapprovals). For the others bands of
manufacture, the percentages of disapproval are: 77% (1998-93), 58% (1994-95), 44% (1996-1999), 20% (2001-03). The
proportions of disapproval due to visual test are: 18% (until 1987), 2% (1989-1993), 4% (1994-95), 3% (1996-1999), 4%
(2001-2003). The proportions of disapproval due to opacity are: 10% (until 1987), 14% (1989-1993), 31% (1994-95), 35%
(1996-1999), 12% (2001-2003).60
50
40
Number of Vehicles 30
20
10
0
Until 1987 1988-93 1994-95 1996-99 2000-03
Ye ar of Manufacture
Visual Rep. Speed Rep. Opacity Rep.
Figure 5 - Total number of disapproval during inspection of Diesel heavy
vehicles that circulate in Belo Horizonte.
Figure 6 shows the percentage of approved and reproved inspected vehicles during a visual inspection, a rotation test
and the opacity test of the exhaustion gas.
100%
80%
60%
Percentage
40%
20%
0%
Until 1987 1988-93 1994-95 1996-99 2000-03
Year of Manufacture
Approved Visual Rep. Speed Rep. Opacity Rep.
Figure 6 - Percentage of approved and reproved inspected vehicles during
inspection of Diesel heavy vehicles that circulate in Belo Horizonte.
3.5 Problems found at the realization of the inspections of Diesel heavy vehicles
According to what was established at the CONOMA Resolution Nº 16 of 1995, the vehicle manufacturer must fix a label
with the value of the smoke index (opacity) in free acceleration at the B column of the front right door of the vehicle, being
the manufacturer responsible by the declared opacity value. The resolution also establishes that this label must be adhesive
and resistant to the weather.The same resolution established that the service manual of the vehicle must has the value of the smoke index in free
acceleration, the angular speeds (rpm) at low gear and maximum free rotation; the correction factor or the already corrected
value for altitudes higher than 350m. These in formations must be enlightened for a correct maintenance of the vehicle.
However, this Resolution hasn’t been accomplished and most of the vehicles don’t have this label and manual, making
difficult the realization of the tests and the vehicular inspection at all.
4. Conclusions
During the inspections, it was verified that the mechanical injection pump adjustment seal was adulterated in more than
59% of the vehicles, especially in the oldest vehicles. The owners do that because they want to obtain a higher maximum
engine rotation and, consequently power gain. Nevertheless, these vehicles pollute more and turn their circulation infeasible,
especially in the big urban centers. The maximum rotation registered was bigger than the maximum free rotation specified
by the manufacturer. Generally it means alteration at the mechanical pump seal of fuel injection, occasioning as main
consequence the emission of black smoke by the exhaustion, which certainly does not pass on the opacity test and the life of
engine is reduced.
The Diesel heavy vehicles with electronic control system that are already manufactured in Brazil contribute little to
minimize the soot emission. Their contribution will happen in medium long-term with the increasing of the number of these
vehicles. The great advantage of this system is that doesn’t permit the adulteration of the engine maximum rotation; besides
it allows higher fuel injection pressure, reducing the soot emission.
The results shown in this article, although partials, indicate a tendency that a great part of fleet of Belo Horizonte has
adulterated mechanical system, compromising the results that were foreseen with the implantation of the Program of
Control of Air Pollution by Automotive Vehicles – PROCONVE. Consequently, the air quality conditions, especially in the
big urban centers, have gotten worse. Therefore, it’s evident the necessity of an effective inspection of the maintenance
conditions of the Diesel heavy vehicles that circulate in Belo Horizonte, which can be done through the implantation of the
Inspection and Maintenance Program of Vehicles in Use.
The project of inspection of the fleet of Belo Horizonte by sampling will continue until that the representation of the
fleet has been obtained so that the measurements will show a scenario about the index of disapproval of these vehicles and
the level of emission of pollutants by this fleet. For a better trustworthiness of the results of the Project, the sample will be
composed of at least 15 vehicles with measurement of opacity in each band of year of manufacture. Not only the
composition of this fleet but also the index of disapproval are important information to dimension the space, number of
equipment and workers for the Maintenance Program of Vehicles in Use.
5. Acknowledgements
The authors are grateful to Fundação de Amparo a Pesquisa de Minas Gerais - FAPEMIG for all support given to the
project. This support permitted the participation of the mechanics engineering students in the development of this work.
6. References
DENATRAN, 2005, “Estatística – Frota de veículos”, http://www.denatran.gov.br.
IBAMA, 2004, Private Communication “Nota Técnica Nº 04/2005/DILIQ/CGQUA”, Instituto Brasileiro do Meio
Ambiente e dos Recursos Naturais Renováveis. Brasília, Brazil, 11 p.
IBAMA, 2005, “Programa de Controle da Poluição do Ar por Veículos Automotores – PROCONVE/PROMOT”, Instituto
Brasileiro do Meio Ambiente e dos Recursos Naturais Renováveis, Brasília, Brazil, 359 p.
Mingoti, S. A. et al., 2005, “Sampling: Manual do Usuário”, Departamento de Estatística, Universidade Federal de Minas
Gerais, Belo Horizonte, Brazil, http://www.est.ufmg.br.
NAPRO, 2001, “Analisador de Gases com Inspeção Veicular e Software de Controle PC-IM - Manual do Usuário”, Napro
Eletrônica Industrial LTDA, São Paulo, Brazil.
7. Responsibility notice
The authors are the only responsible for the printed material included in this paper.You can also read